
EB Daily Market Report - Wednesday, April 1, 2020
Special StockCharts TV Appearance
I want to let all of our members know that I'll be joining David Keller on StockCharts TV's "The Pitch: 15 Stock Ideas In Uncertain Times". The show was recorded yesterday and airs shortly at 12:30pm EST. I'll be joined by Mary Ellen McGonagle (former co-host of mine for MarketWatchers LIVE) and Grayson Roze to share our thoughts on paradigm shift taking place in the market and we'll each provide 5 companies poised to benefit from this shift.
You can go to StockCharts.com and click on the StockCharts TV link to watch the show.
My 5 stocks (so that our members are the first to see) are:
PTON, REGN, ZM, PETS, WING
PTON, in particular, could be of interest as it shows that 56% of its float is short (as of March 13th). That's a lot of folks betting against the stock during a period in which many "stay at home" workers will be looking for virtual exercise classes. There are obviously no guarantees, but I like the story here.
Executive Market Summary
- Futures were sharply lower overnight and we saw the Dow Jones fall close to 800 points at the opening bell
- The dollar proxy (UUP) and gold (GLD) are both higher today as renewed fear drives investors to both
- Crude oil prices ($WTIC) are unchanged today
- Fear is sending investors into treasuries once again, with the 10 year treasury yield ($TNX) falling to 0.60%
- Global equities are being hit with few areas spared
- Many key indices and stocks (AAPL, GOOGL, FB, etc) are struggling today after recent 20 day EMA tests
- Clear leadership is returning to the defensive consumer staples (XLP, -0.86%) sector; real estate (XLRE, -6.90%) and utilities (XLU, -5.14%) are again falling victim to the selling
- We have no active trade alerts at this time
Market Outlook
Our major indices are succumbing to selling pressure after reaching, or nearly reaching, initial Fibonacci retracement levels at 38.2%. Here's the visual on the NASDAQ 100 ($NDX), which has been a relative leader:
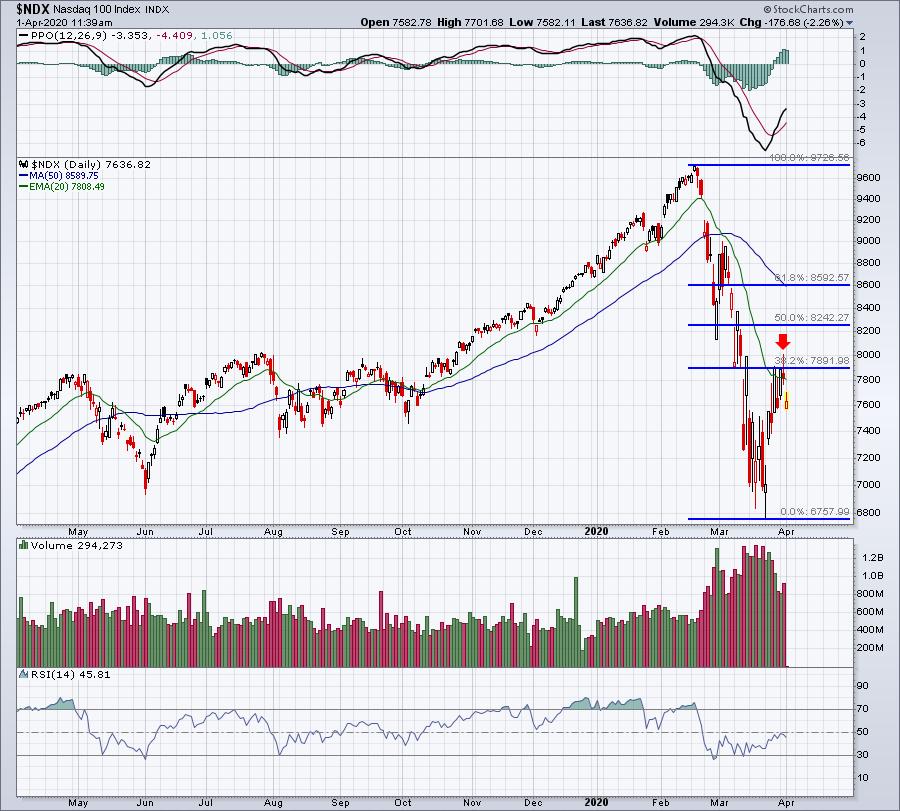
The long tail above the 20 day EMA with a corresponding close beneath it is always worrisome. Today's gap lower confirms that as an important short-term high. Our near-term trading range has now been established from the March 23rd intraday low of 6771.91 to yesterday's intraday high of 7701.68. That's nearly a 1000 point trading range and with Volatility Index ($VIX) readings still in the mid-50s, we need to be prepared for almost anything. To me, that screams be cautious.
Trading Ideas
I still trade on the long side, but because this market downturn has featured many opening gaps lower, followed by intraday moves higher (or even flat), the best opportunities have been found in the best performing industry groups where individual stock leaders gap lower at the open or during the first 60 minutes. So many of these stocks have finished with hollow candles (closes above opens), and that provides us literally "daytrading" opportunities. I have traded several stocks over the past month where I've owned them for hours. That's it. It's simply too dangerous to hold overnight. The exceptions to this rule are companies that I believe are actually set up to benefit from the long-term paradigm shift likely to take place because of the coronavirus. REGN, CLX, and ZM are three names that I've routinely held overnight during this crisis (but I've also short-term traded these as well). Bottom line, I'm not taking too many chances overnight. And perhaps most importantly, when I do trade, I try to trade fewer shares than normal so that my emotions don't take a toll on me. Once you begin reacting to market behavior rather than anticipating it, this trading journey becomes an uphill battle.
I began setting up ChartLists for the stronger sectors so I can continually update my list for the best stocks. Let me give you an example, using healthcare. Here's the scan I ran to identify the best SCTR stocks in healthcare:
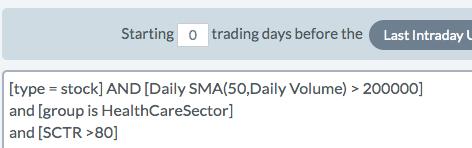
It's a very simple scan designed to return to me the best relative performers (according to SCTR scores) in the best performing sector. From there I can sort the stocks to see which are underperforming today:
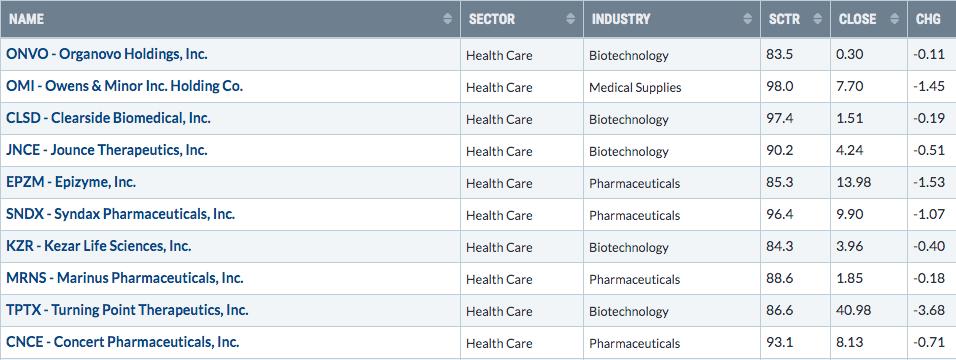
Now this doesn't mean I'd rush out to buy these 10 underperformers, but I can begin to analyze these stocks with the knowledge that they've been great relative performers and they belong to the best performing sector. Some of you EXTREMELY aggressive traders might like that top stock, ONVO. It's down 27% today after rising nearly 50% yesterday. It's only trading for 30 cents, however, which simply isn't my style.
Another aggressive trade would be OMI, which traded above 9.50 yesterday and has seen two huge advances the past two trading sessions and today neared key gap support at 7.50 (today's low was 7.55) on a big pullback. It's currently down 15% on the session. One that just missed making it into the top 10 list above is IVC. Here's the chart, which shows many hollow candles and long tails to the downside. These are solid indications that IVC has been routinely bought during the trading day, even though it's seen several large gaps lower at the open:
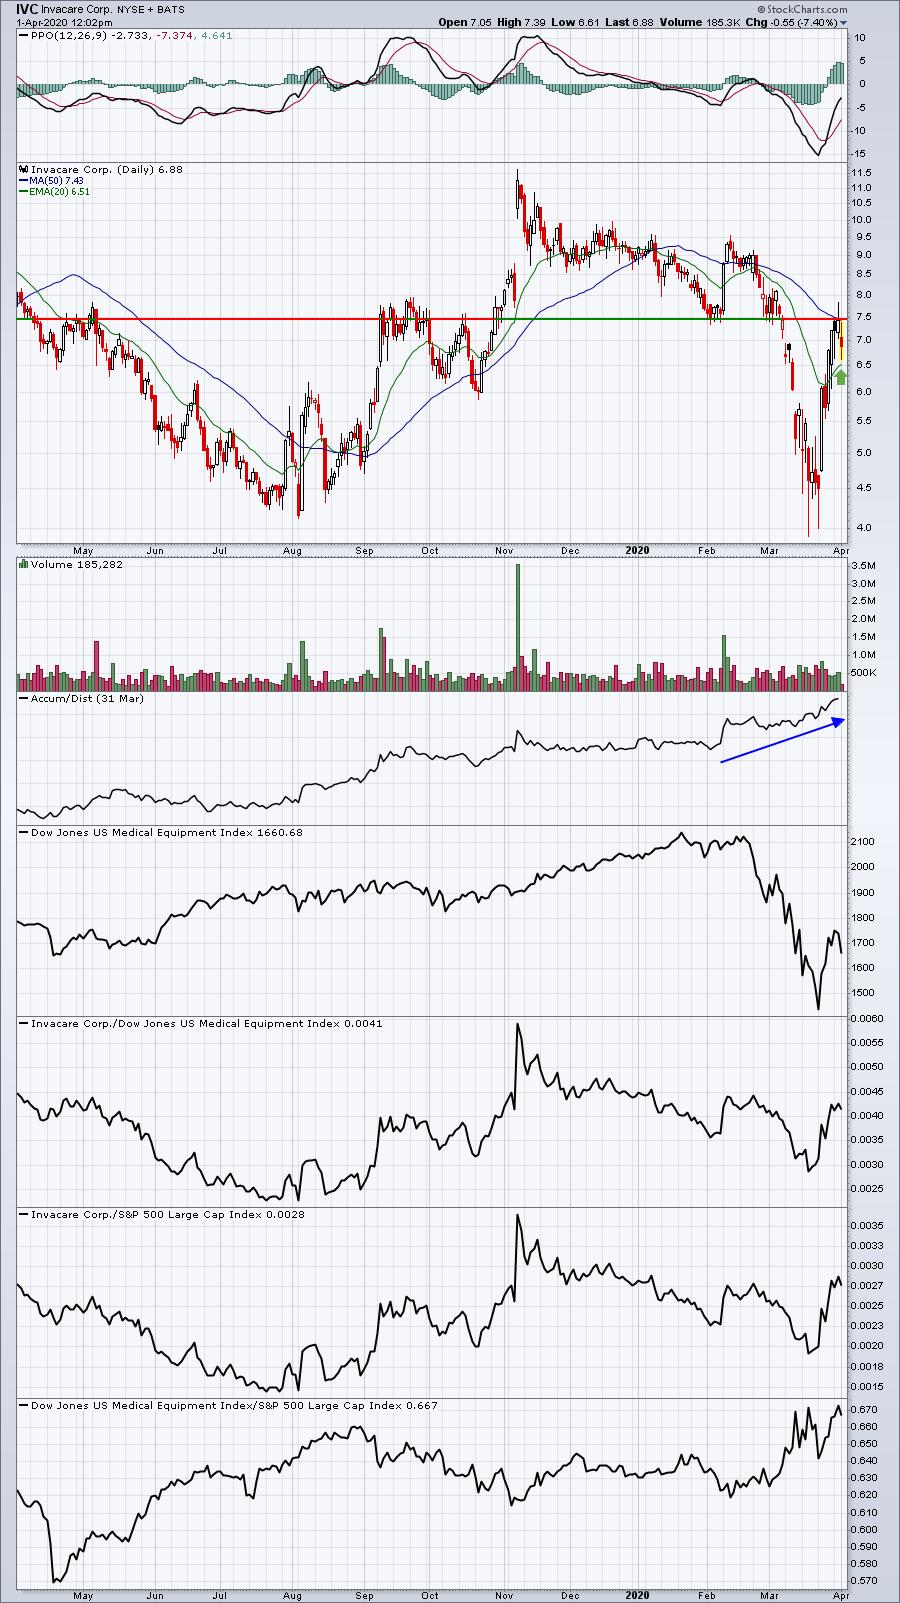
IVC failed at key price resistance at 7.50, but now is trending lower toward its rising 20 day EMA at 6.51. True to recent form, IVC is bouncing off its earlier low.
Happy trading!
Tom