
EB Daily Market Report - Monday, April 13, 2020
Executive Market Summary
- Futures were mostly lower overnight, though they recovered quite a bit by the opening bell
- The Dow Jones is down more than 500 points as of 11am EST
- The NASDAQ is outperforming on a relative basis as leaders such as Amazon (AMZN, +3.87%) and Netflix (NFLX, +3.85%) mask the overall selling in the market
- All 11 sectors are lower, though energy (XLE, -1.09%) is the best performer after OPEC agreed to a historic cut in production over the weekend
- Real estate (XLRE, -4.28%) and financials (XLF, -4.21%) are the weakest sectors
- Ford (F) warned of losses and a significant revenue decline; meanwhile, AMZN announced it will add 75,000 more workers due to heavy demand
- The 10 year treasury yield ($TNX) is up 1 basis point to 0.73%
- We have no active trade alerts at this time
Market Outlook
Last week, I pointed out that areas like mortgage REITs ($DJUSMR) and home construction ($DJUSHB) were poised to lead us back to the downside and that's what we're seeing today. These two groups are down 4.35% and 6.00%, respectively. Furthermore, if we look at the worst performing S&P 500 stocks today, here's the leaderboard:
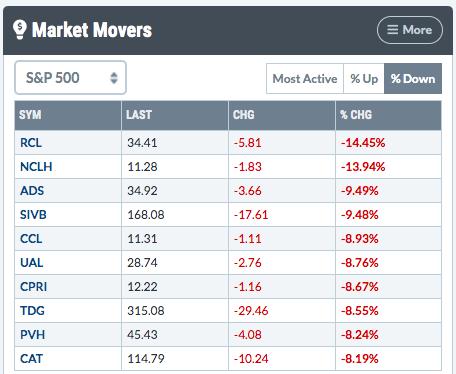
It's littered with cruise lines and airlines stocks, key underperforming areas since that February 19th market top. These groups led the recent stock market rebound, but are showing considerable weakness today. Also, let's not forget that the 50.0% Fibonacci retracement level was reached on Friday, so another bout of selling from this level would not be a big surprise.
This is also options expiration week as April monthly options expire this Friday. We will be sending out information for our regular monthly "Max Pain" webinar, where we'll identify the most likely scenario later this week as options expiration grows closer.
Trading Ideas
We had a great session on Saturday (postponed from Friday due to internet outage issues in my area) and I unveiled my list of 354 stocks included in a brand new AD ChartList (AD = accumulation/distribution). The idea here is to only consider trading stocks with SCTR scores > 80, solid relative strength vs. peers and the benchmark S&P 500, and strong accumulation/distribution lines. That last part was included because of the market's behavior the past 7 weeks. We've seen solid action during the trading day where some industry groups have been sold (distribution), while others have been bought (accumulation). Those companies with strong AD lines and also strong relative strength provide us "safer" trading alternatives, in my view, especially if we limit our exposure overnight (ie, trading during morning weakness in stocks showing strong AD lines). Here's a snapshot of the worst performers today on this AD ChartList (as of 11:30ish EST):
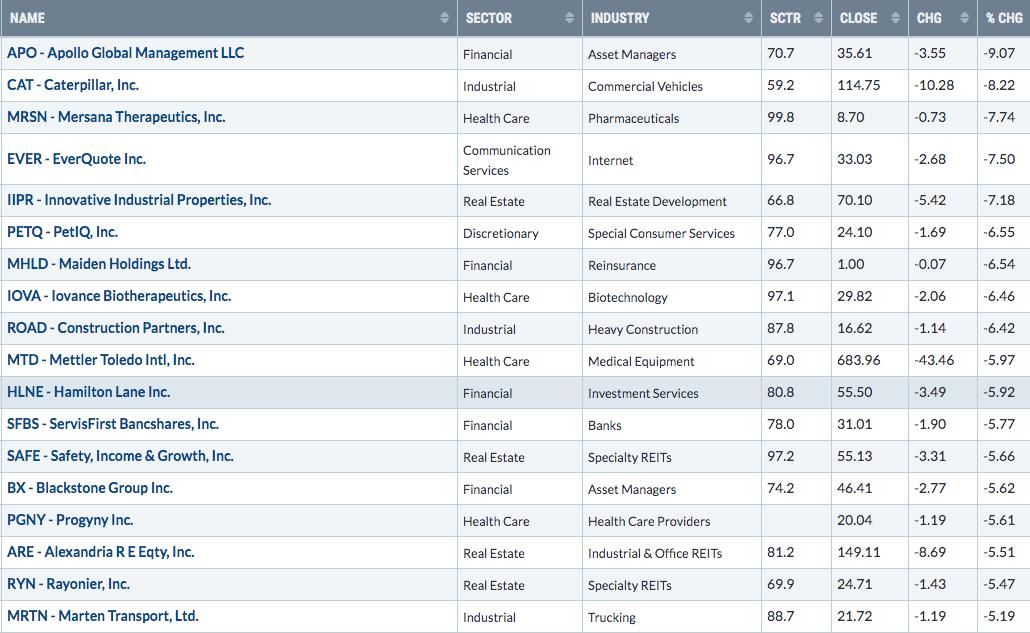
These are all the stocks on this AD ChartList that are down at least 5% today. Because they have strong AD lines, I'd expect several to bounce back later today, finishing with a smaller filled candle (close closer to the open) or even a hollow candle where these stocks close back above their open.
Here are two that look interesting to me:
EVER:
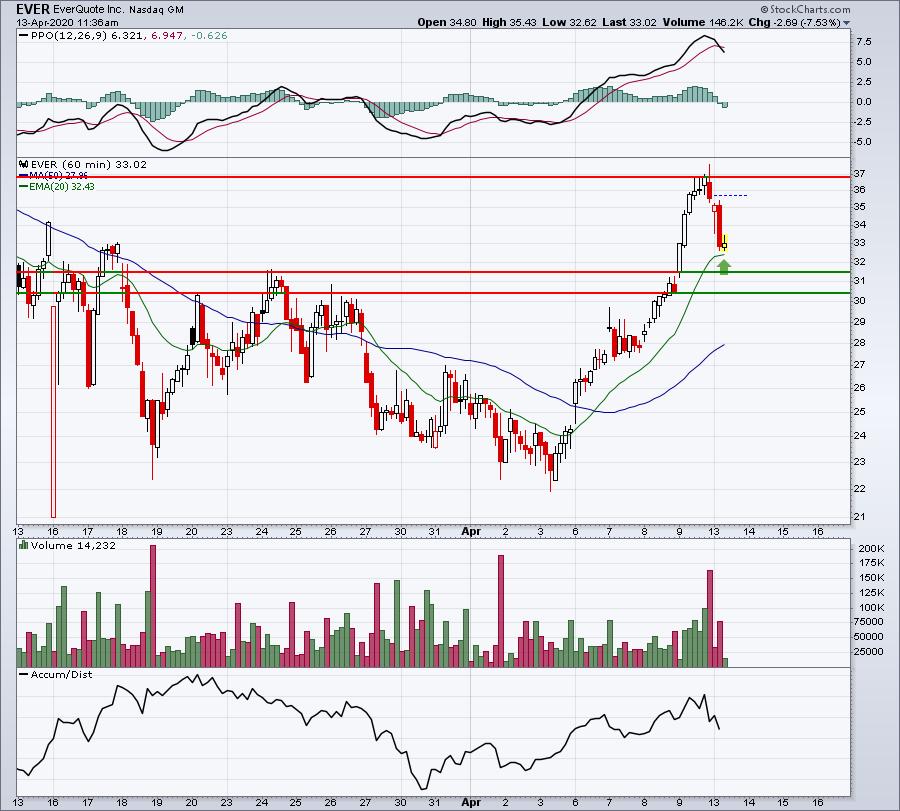
This is an hourly chart, but EVER's daily AD line is exceptionally strong. On this 60 minute chart, the hourly PPO is surging and today's selling is close to its rising 20 day EMA. I've also marked a key gap support zone to watch if the 20 day EMA fails to hold. I'd look for EVER to bounce from its current price, or from that gap support zone.
IOVA:
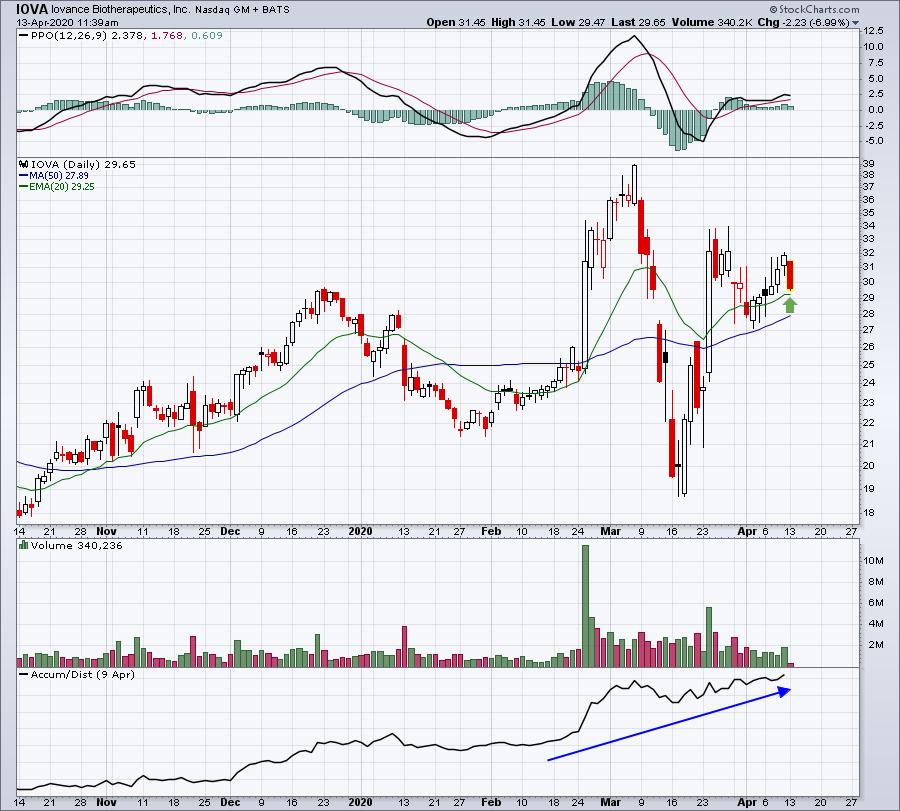
IOVA is falling back today and is approaching a potential 20 day EMA test. If you look at the candlesticks, you'll see that there haven't been many big red-filled candles since the mid-March low. Instead, we see more hollow candles or candles with long tails to the downside, meaning that buyers come in during the trading day and reverse the stock's trend into the close. I wouldn't be surprised to see IOVA finish much stronger than it started today.
Happy trading!
Tom