
EB Daily Market Report - Wednesday, April 15, 2020
Website Update/News:
First, I recorded a Max Pain webinar after the close yesterday and it's available for review. On the left navigational panel of our site and under "Members", you'll see "Webinars". Look under "Archived Webinars" and you'll find the monthly Max Pain Webinar listed first. Simply click on the recording. Please keep in mind that I use max pain as a directional clue, not as a guarantee that a stock or index will move to an exact price point. If you trade a max pain stock and it moves in your direction, I would not be greedy. The object is to make money, not to try to retire on an island after the trade (although the latter wouldn't be bad). And max pain is simply one clue. There are a number of factors involved, including volume. If a stock is moving against the expected max pain move and volume is heavy, market makers may have no choice but to remain on the long side. Heavy volume reversals, however, can carry a lot of weight as it suggests market makers have "switched sides".
Next, we've added a new Max Pain ChartList that Stockcharts.com's Extra members (and above) can download directly into their account. Again, under the "Members" section on the left navigational panel on our website, click on "ChartLists". Scroll down and you'll find "Max Pain ChartLists". Follow the link. The Max Pain ChartList is password protected, so be sure to enter the password that we provide.
Executive Market Summary
- Futures were weak across the board overnight and the Dow Jones opened down more than 2%
- Currently, our major indices are down from 2% (NASDAQ) to 5% (S&P 600 Small Cap)
- Volatility is spiking with the VIX up 11.7% to 42
- The 10 year treasury yield ($TNX) has tumbled 11 basis points after key economic reports came in below expectations
- The empire state manufacturing survey was reported at an all-time low at -78.2
- April retail sales were -8.7%, well below the consensus estimate (-7.3%)
- March industrial production and capacity utilization both missed estimates as well
- The April housing market index was crushed, falling to 30 from March's 72 reading; the estimate was 60
- We still have the beige book at 2pm EST, then housing starts and another initial jobless claims tomorrow
- All 11 sectors are lower, but once again healthcare (XLV, -1.39%) remains a bright spot relatively speaking
- We have no active trade alerts at this time
Market Outlook
I believe the battle lines have now been drawn by both sides. The bulls said "enough is enough" when the VIX surged into the 80s and a bottom ultimately formed near 2200. We saw a huge 650 point rebound, even beyond the Fibonacci 50.0% retracement level. That was the point where the bears drew their line in the sand. Now armed with unbelievably poor economic reports this morning, negative divergences on 60 minute charts, lower pessimism on both the VIX and equity only put call ratio ($CPCE), and max pain that suggests we're likely to see short-term weakness, I believe the bears are saying "this is IT". How will this battle ultimately end? Well, first please remain cautious because a lot of things must still unfold in terms of COVID-19, the timing of opening up our economy, unemployment, stimulus packages, the continuing Fed response, etc. If the bulls could somehow manage to stage a rally today or in the very near-term to clear Tuesday's close, that would be extremely impressive...and quite bullish. But if a top truly is in place, the bulls must respect recent history. Both of the recent downtrends (from February 19th through March 23rd and then again from March 26th through April 1st) saw BIG gaps lower at the opening bell. That characterized the selling. If we are beginning another leg lower, don't be shocked to see another repeat of large opening gaps to the downside. We saw one this morning and it could just be beginning.
Occasionally, I'll use a 10 minute chart to watch impulsive selling episodes develop. The red arrows on the chart below highlight this:
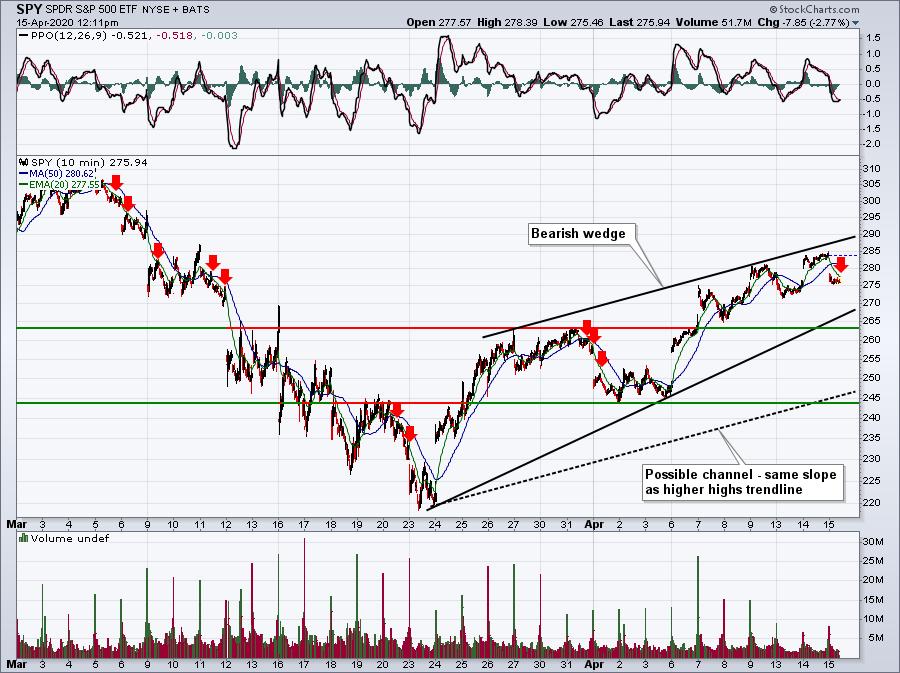
The SPY has moved beneath that 20 period EMA on the 10 minute chart. Will we stay there? That's a very short-term chart to watch. I've also illustrated a bearish wedge pattern that's currently in play. A break below that lower uptrend line would be a very bearish development. Should that happen, I've annotated two key price support levels to watch with the 244 level particularly important. If we were to bounce off that level, it's quite possible that we'd begin trending higher again within a bullish channel (black-dotted line would represent channel support).
I'm doing a lot of speculating here, and maybe the market reverses higher later today and it's all for naught.
Trading Ideas
I provided a few ideas in the max pain recording from last night, so you might check that out. While max pain provides us no guarantees, it definitely gives us a bit more confidence on which way the likely direction is. But we still must maintain our stops in the event the action goes in the opposite direction.
As an example of what I'm continuing to look for from a long trading perspective, check out PETS:
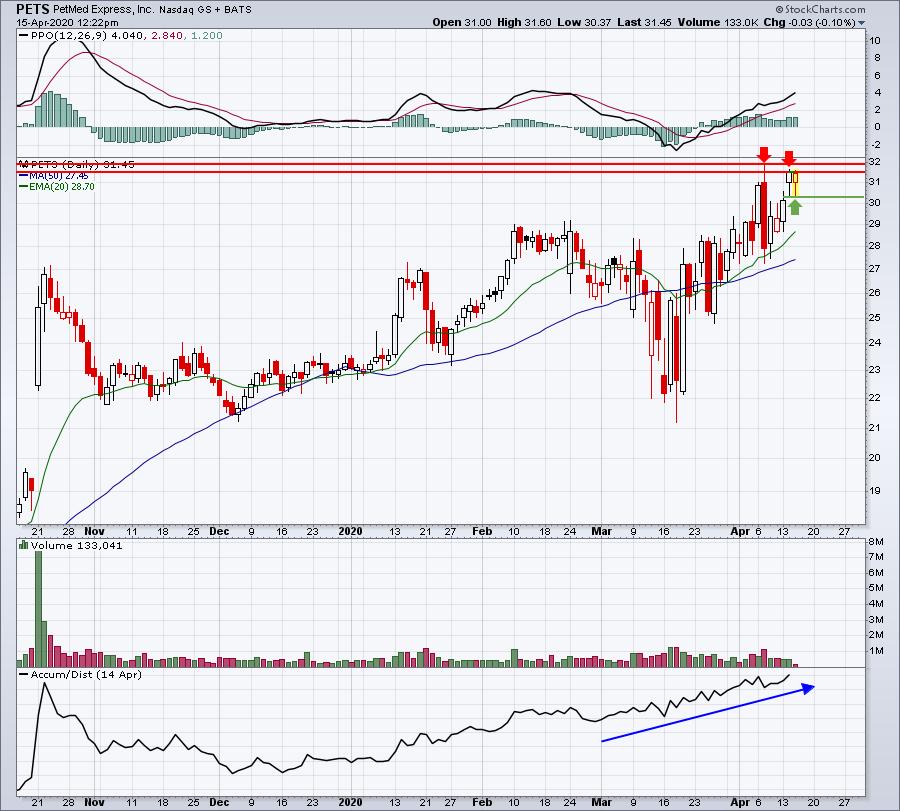
I require a strong AD line, which PETS has, and this morning PETS was lower and challenging its low from Tuesday. I was able to enter a small position, keep a tight stop a bit below Tuesday's low and look for a rebound to test Tuesday's high. Again, I'm not looking to break a bank. In this environment, small gains are ok with me. I've definitely left profits on the table as several stocks I've traded recently have continued to power forward, but again, in this environment, I'm quite cautious and am comfortable being mostly in cash come 4pm EST.
Happy trading!
Tom