
EB Daily Market Report - Thursday, April 16, 2020
Website Update/News:
I have created a Weak AD ChartList that comprises 250 stocks with SCTR scores below 20 and weak accumulation/distribution lines. This is the opposite of our Strong AD ChartList, which has been quite popular since we unveiled it recently. If you're an Extra member or above at StockCharts.com, you can download these ChartLists into your own account. You simply need to be signed into both your EarningsBeats.com and StockCharts.com accounts. In EarningsBeats.com, on the left navigational panel, go to "Members" and click on "ChartLists". If you scroll down the page, you'll see both the Strong AD ChartList and Weak AD ChartList. Follow the instructions provided and you'll have both of these valuable ChartLists in your account in seconds!
Enjoy!
Executive Market Summary
- Futures held up fairly well overnight and U.S. stocks jumped out of the gate a bit higher at the opening bell
- The NASDAQ continues to outperform the other major indices, while both mid caps and small caps lag
- Initial jobless claims were above 5 million today and March housing starts were weaker than expected
- Healthcare (XLV, +1.01%) and consumer discretionary (XLY, +0.86%) lead all sectors; energy (XLE, -3.90%) is getting hit hard
- Financials (XLF, -2.29%) also are lower as the 10 year treasury yield ($TNX) weakens further to 0.60%
- The Volatility Index ($VIX) is attempting to print its second consecutive higher low, which would be the first time it's happened since the S&P 500 low on March 23rd; in other words, fear is building a bit so be careful
- We have no active trade alerts at this time
Market Outlook
Yesterday at this time, it appeared our major indices might be rolling over and beginning a downtrend. Well, that was yesterday. This powerful rebound has not let up just yet and the NASDAQ 100 has actually broken out above Tuesday's high. It does come with a negative divergence still in play on its 60 minute chart, but thus far that sign of "slowing momentum" hasn't proven true:
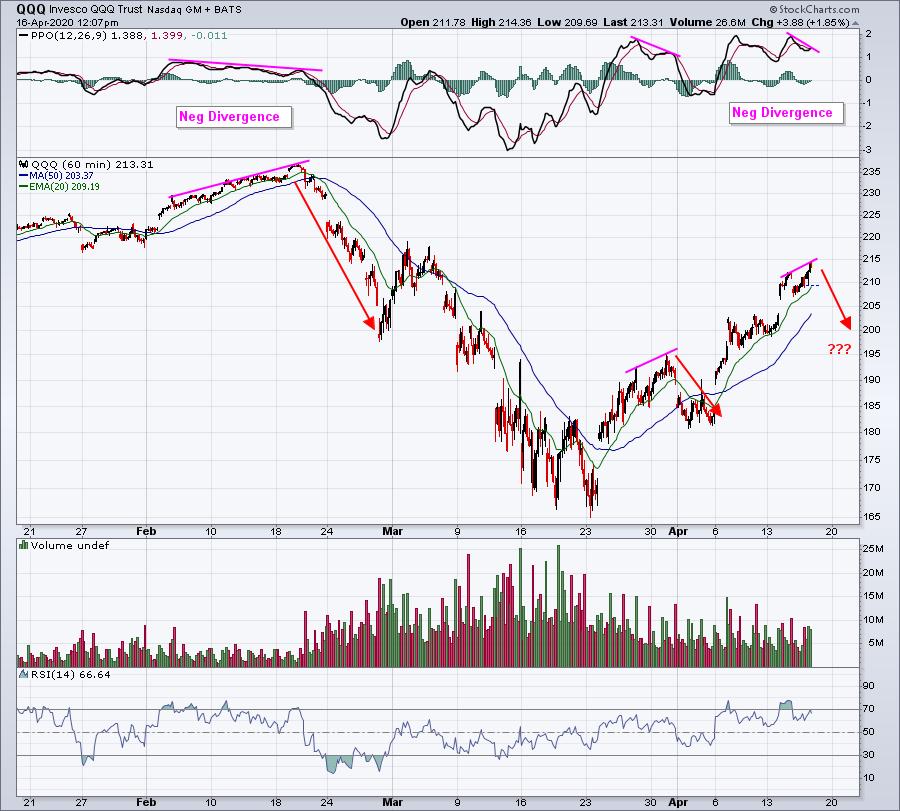
The negative divergence I pointed out two days ago was eliminated, but on today's high, another one has formed. We opened April with a significant 7% decline after a negative divergence printed. While it remains to be seen if the QQQ might tumble that much, there's definitely market maker interest financially in making it happen, but will they? Several NASDAQ leaders like AMZN, NVDA, AMD, NFLX, and REGN continue to power forward, but many of those names have a TON of net in-the-money call premium. A selloff could be seen at any time.
A member wrote in and said it seemed unlikely that any of our max pain candidates were likely to drop the amount we suggested they would. To clarify, I use max pain as a "directional aid", not a guarantee that a stock will drop X% in 2 days. That's completely unrealistic, even though I have seen it happen many times. Also, what the market (or an individual stock) looks like one day might be completely different the next day. Again, I've been around the block a few times and I've seen extremely volatile price action as we head toward monthly options expiration. While many of these NASDAQ stocks are moving higher, I'd be very careful to buy into this current strength because, as I've mentioned previously, it would be in the financial interest of market makers to try to drive some of these prices lower.
Another question that came up was "do market makers lose money if max pain levels are not reached?" While I don't have access to that information, my best guess would be NO. If calls are bought and a stock continues to rise into options expiration, remember that market makers can sell the calls and buy the stock. That's a covered call strategy that works fine during a period of rising prices. It limits your upside, but it's profitable. Where the market makers can make a killing is where they win on owning the stock during the uptrend, then turn and short the stock prior to a downtrend (so another win), while simultaneously wiping out net call premium (a third win). That's the risk of owning stocks long that have net call premium deep in-the-money heading towards options expiration.
Trading Ideas
We are planning to have another WebinAR (WAR) Room session on Saturday at 2pm EST. I want to focus on our Strong AD and Weak AD ChartLists and provide suggestions on how you can use them as we move into earnings season. It should be very educational and hopefully will provide you some trading strategies and techniques to aid your short-term trading success, either on the long or short side. Let me give you one example from our Strong AD ChartList that I'm watching closely right now. (I'll discuss more on the Weak AD ChartList on Saturday)
I use the CandleGlance charts at StockCharts.com occasionally when I'm looking for something specific technically, because I can quickly glance at 30 charts at a time. As an example, check this out:
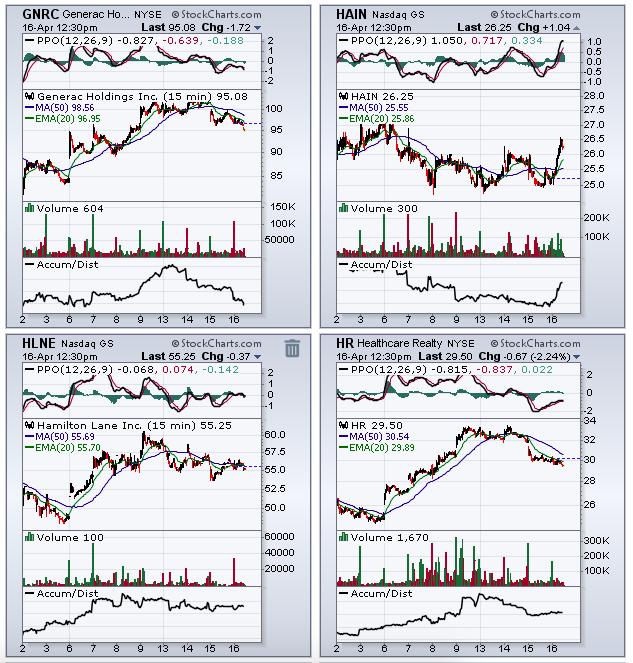
First, note that this is just a small snapshot of the CandleGlance charts and it's a 10 day, 15 minute chart style. Second, check out HAIN's chart. After downtrending for a few days, it sideways consolidated with some struggles at the 26 level. Today, it broke above 26 and its intraday accumulation/distribution line has begun to rise. Remember, this is the Strong AD ChartList where the bigger picture is already bullish and showing signs of accumulation....or a stock like HAIN wouldn't be on this list. So now I pull up the HAIN daily chart:
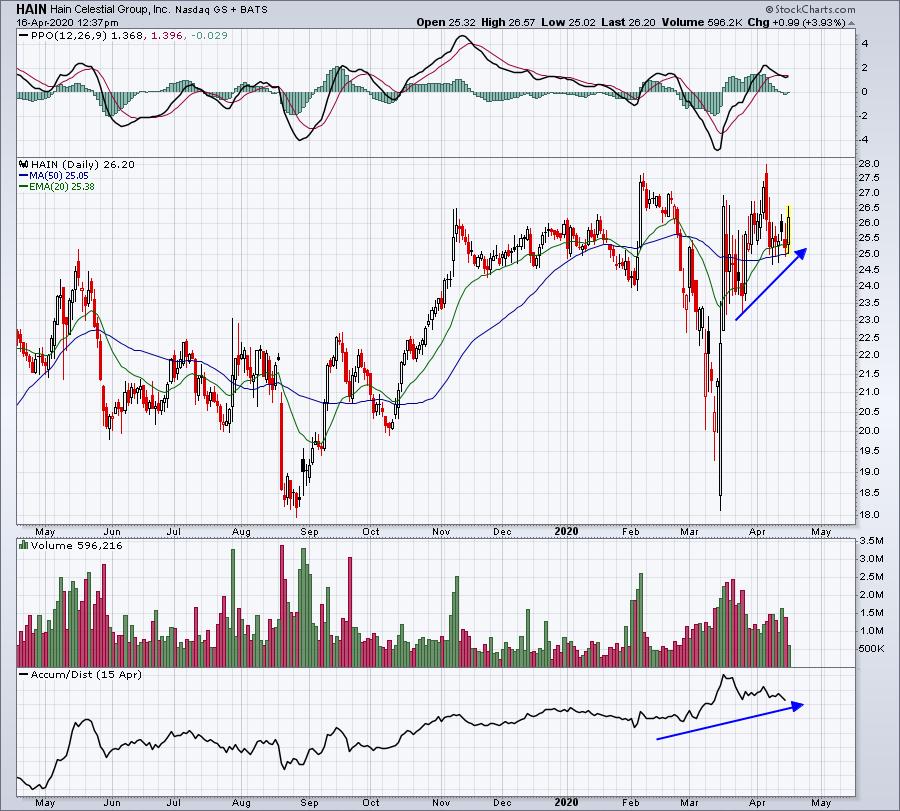
While this isn't a stock I'd jump right into (and I don't own it right now), it's one I might become very interested in if it weakens further. The 26.00 level could provide an initial entry or you could just take a note that HAIN could be very interesting on a morning selloff after what appears to be a breakout in the very short-term. Keep in mind that strong AD stocks that are down in the morning tend to have a solid chance of recovering later in the day. That's how the AD line becomes strong in the first place.
Happy trading!
Tom