
EB Daily Market Recap - Tuesday, April 21, 2020
Executive Market Summary
- Futures were weak for a second consecutive day with tremendous selling pressure in crude oil ($WTIC)
- The 10 year treasury yield ($TNX) has dropped another 6 basis points as the flight to safety resumes
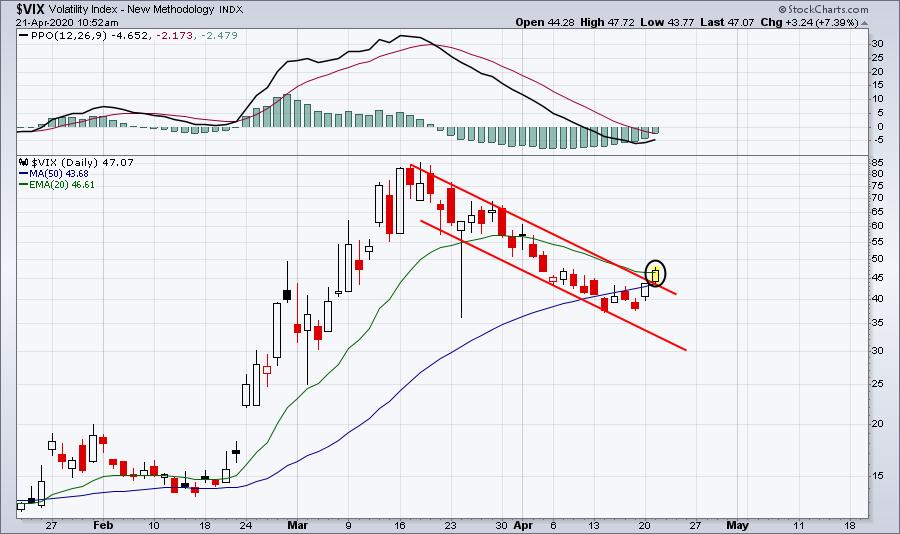
- The VIX hit 47.72 earlier and still resides at 46.75, a 6.7% boost from Monday's close
- Furthermore, among leading sectors are the defensive utilities (XLU, -1.29%) and consumer staples (XLP, -1.11%); energy (XLE, -1.00%) leads today on a relative basis
- Technology (XLK, -3.42%) is being hit hardest, giving up its recent relative strength
- One consistent theme remains - healthcare (XLV, -1.73%) is outperforming the benchmark S&P 500
- March existing home sales came in below expectations - 5.27 million units vs. 5.34 million units
- Coca Cola (KO) reported better-than-expected EPS, but did indicate the pandemic will hurt revenue in the quarter ahead
- We have no active trade alerts at this time
Market Outlook
For the first time in weeks, the bears have something to work with. In addition to having seasonality on their side as the poor historical performance from the 19th through the 25th of all calendar months would suggest, the weak after options expiration poses risk as well, and yesterday was the first close at or very near the low of the day since April 7th and it's only the second such day since the March 23rd bottom. Any time the stock market closes on the low of the day, there's a definitive possibility that market makers have resorted to shorting. Money is rotating to defensive areas of the market and the Volatility Index ($VIX) is back on the rise, breaking its recent downtrend line:
Moves to the downside can become quite impulsive as fear accelerates, so please be careful in the current environment. I will be watching rising 20 day EMAs on the major indices as an initial clue. An uptrending market with daily PPOs breaking above centerline resistance normally has excellent support at rising 20 day EMAs. Failure to hold those moving averages would be a much stronger signal to preserve capital in the days, possibly weeks, ahead.
Trading Ideas
As volatility increases, I'd consider more defensive plays on the long side as I believe those areas will more than likely hold up better. So on the Strong AD ChartList, here's a list of the top SCTRs among consumer staples:
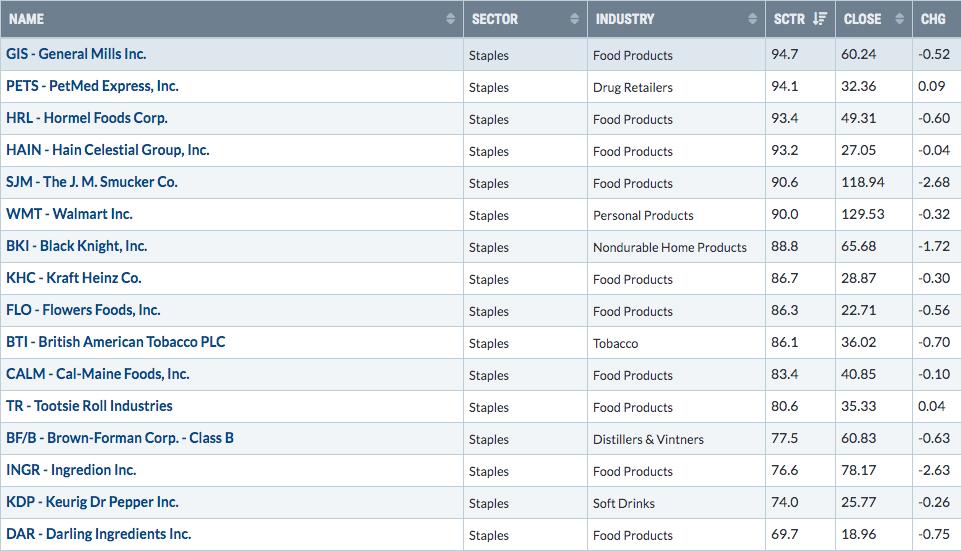
Let's look at a couple of these charts:
GIS:
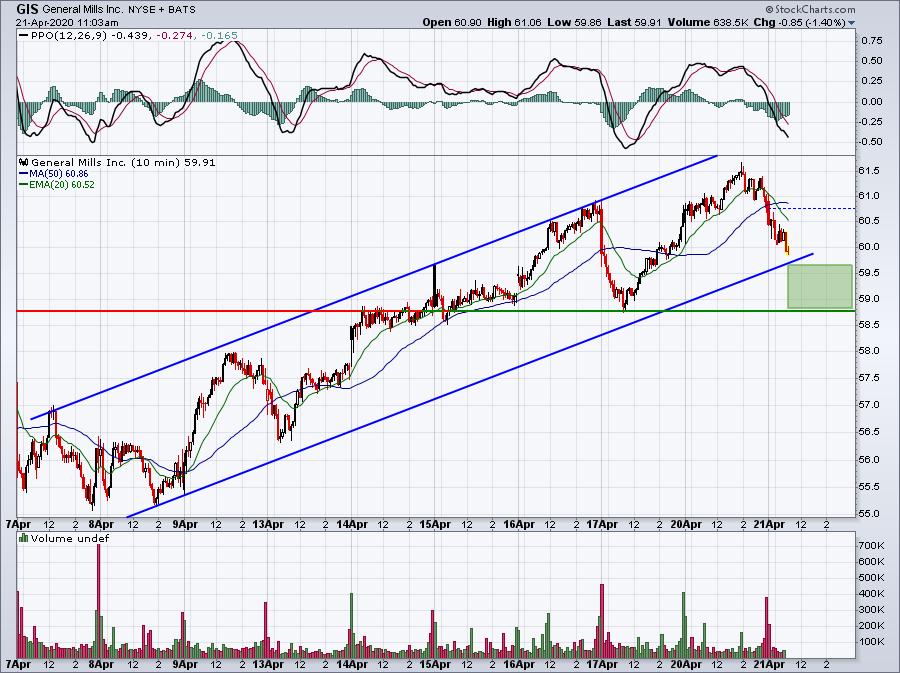
The green-shaded area represents the short-term channel support down to the key recent price support level. That provides a tight trading window with limited downside risk. In the increasing VIX environment, I'd keep a fairly tight stop on most trades.
WMT:
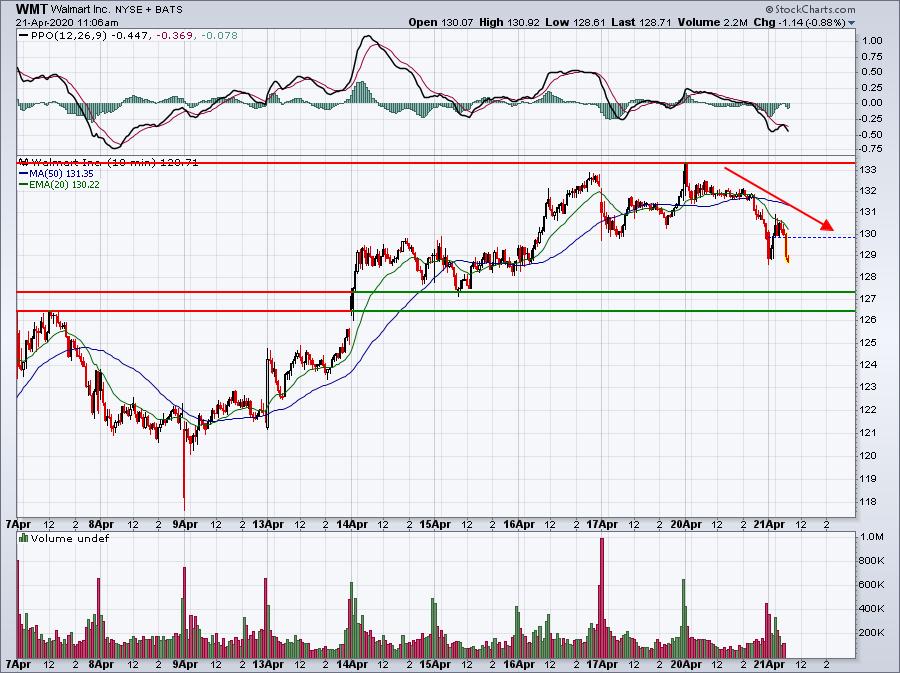
126.50-127.50 is a range of support on WMT. The red directional line shows that WMT has seemingly reversed from a period of rising prices to potentially a period of falling prices. Therefore, I'd have patience and see if WMT falls into that key support zone. Once again, I'd keep a tight stop in place.
There's a chance that we've begun another leg lower that will test the bulls' mettle. Make sure you review the 3 key support levels from my earlier StockCharts.com TV show, Trading Places LIVE. The first support area on the S&P 500 will be its 20 day EMA, currently at 2722. Can we reverse there? If so, that would be a check mark in the bulls' column. If not, it will likely lead to a higher VIX reading and further selling. Next support level would be the breakout above the March 26th close at 2630. So 2722 and 2630. That's where we want to watch for now.
I would definitely be more cautious in this rising VIX environment. Cash isn't a bad investment choice as we watch to see if support levels hold.
Happy trading!
Tom