
EB Daily Market Report - Thursday, April 23, 2020
ChartLists Update
I will be updating the Strong AD ChartList later this evening and I'll try to update the Weak AD ChartList as well. We want to keep those ChartLists fresh with only the highest SCTR scores (> 80) on the Strong AD list and lowest SCTR scores (< 20) on the Weak AD list. We'll send you an update with a password when the updated list(s) are available for download into your StockCharts.com account.
Executive Market Summary
- Futures were flat this morning, but we did manage to open slightly higher
- Buying accelerated in the first 60 to 90 minutes with leadership in small ($SML) and mid cap ($MID) stocks
- Energy (XLE, +2.99%) is having a strong day as crude oil prices ($WTIC) have surged 27% today
- Initial jobless claims were slightly higher than expected, 4.4 million vs. 4.25 million
- Recent laggards are performing well, including mortgage finance ($DJUSMF, +4.53%) and gambling ($DJUSCA, +7.05%), in addition to energy stocks
- 10 year treasury yield ($TNX) is down two basis points to 0.60%, providing a headwind for U.S. equities
- We have no active trade alerts at this time
Market Outlook
In order to measure how the bond market sees U.S. economic performance ahead vs. its global peers, I typically plot the 10 year treasury yield vs. Germany's 10 year yield ($UST10Y-$DET10Y). A rising line would suggest that the U.S. economy is expected to outperform Germany's. A falling line would suggest the opposite. Here's how that chart looks now:
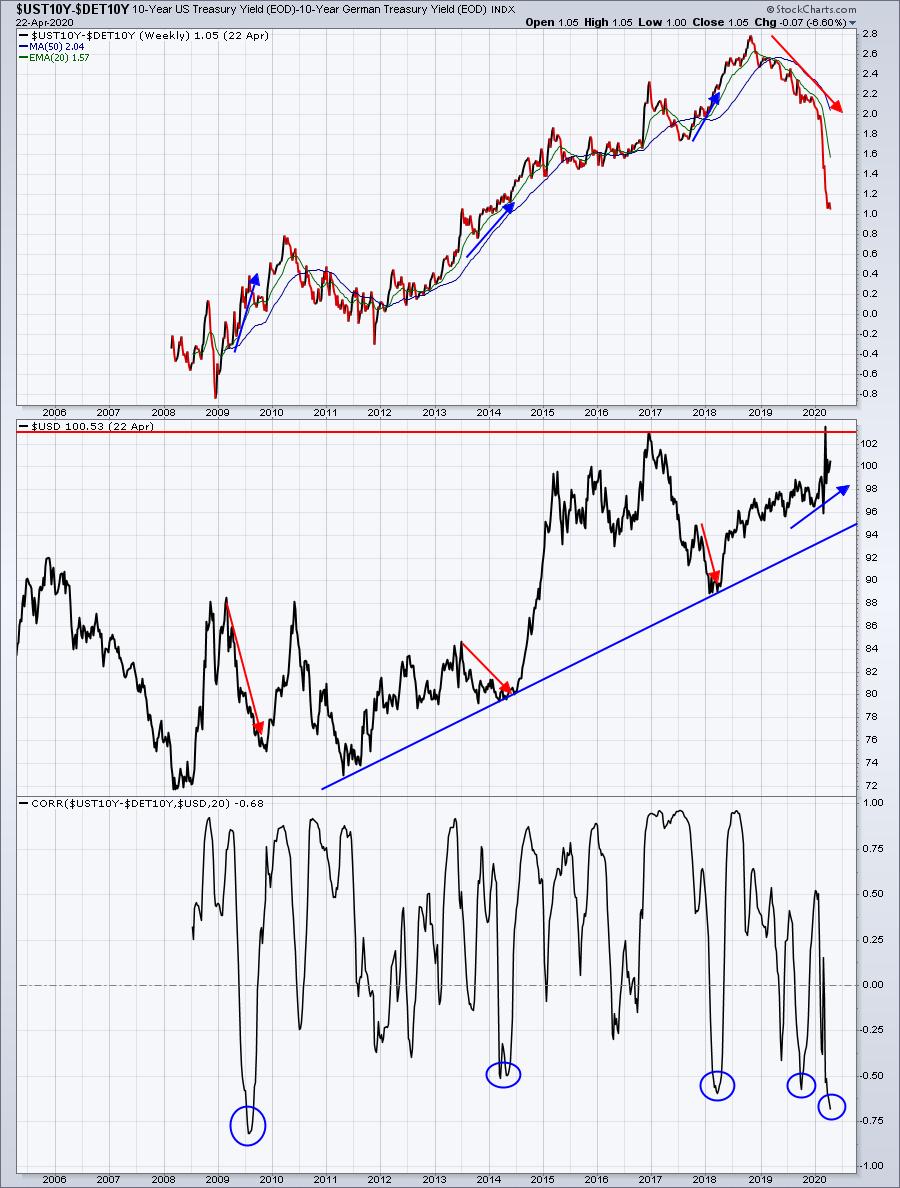
There's been a real disconnect here and I've been waiting patiently for it to resolve itself. The blue circles highlight the negative correlation when it reaches -0.50 or beyond. It's only happened a handful of times over the past 15 years, but three of them have occurred in the last 2 years. And the last two, in particular, have been different than the prior three. We're seeing U.S. treasury yields fall rapidly vs. German treasury yields. Ordinarily, that would suggest our economy is worsening vs. Germany's. But the dollar has been rising. Typically, the dollar will fall if our economy is faltering on a relative basis.
One possible resolution here would be a surge higher in U.S. treasury yields, which would underscore a rapid rotation out of treasuries and into equities - obviously bullish for equities. But a move in the other direction for the U.S. dollar would likely hurt the performance of equities, although a falling dollar would likely enable energy and materials to outperform. That's something they haven't enjoyed in nearly a decade.
I'll keep watching this develop, but I wanted to pass along the clear disconnect currently.
Trading Ideas
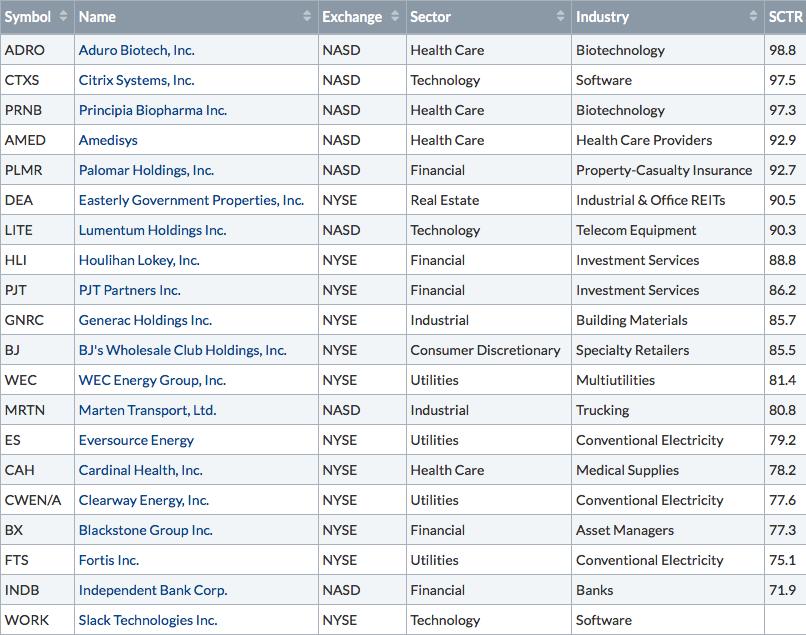
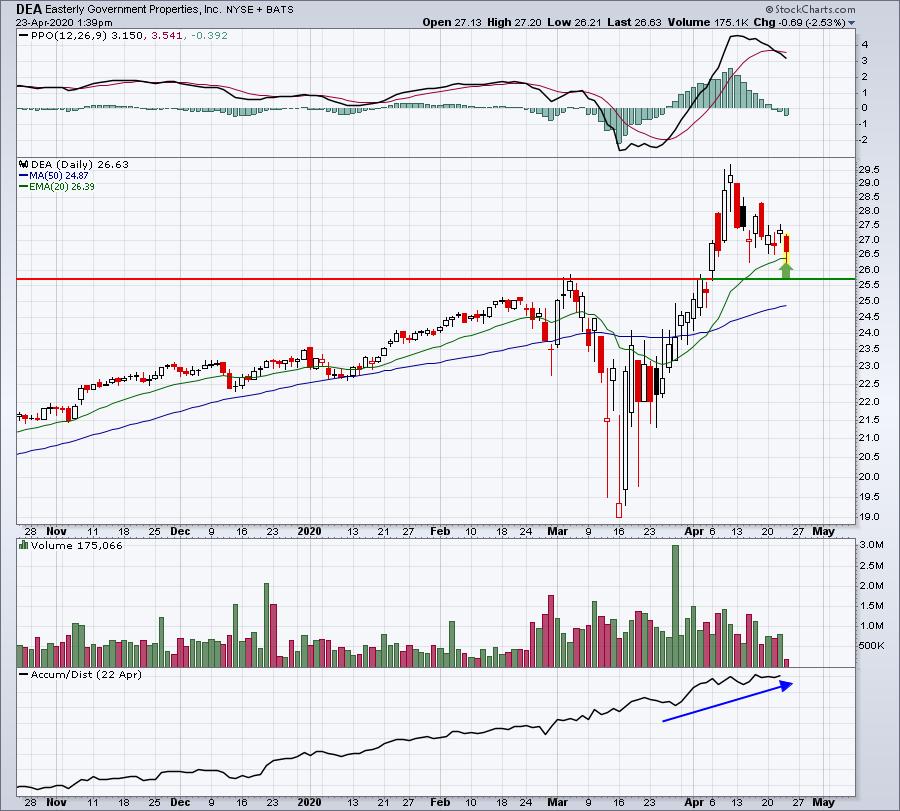
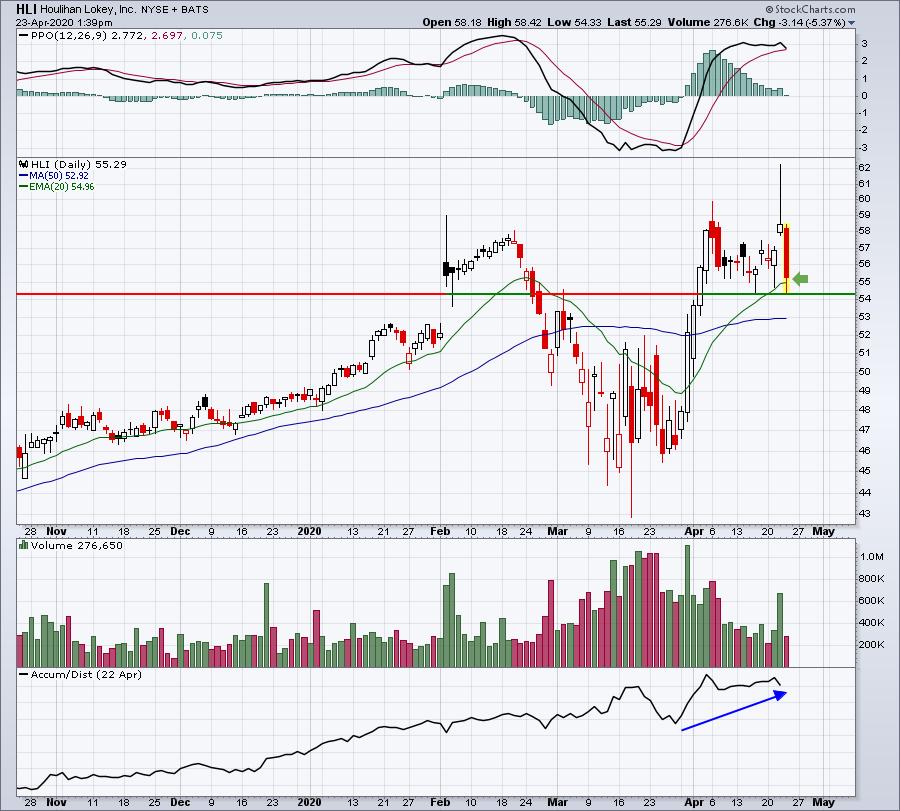
As I mentioned above, I'll be updating our Strong AD ChartList later today (and probably the Weak AD ChartList as well). In the meantime, I wanted to point out stocks from the Strong AD ChartList that have moved beneath their 20 day EMAs, but are currently above that key moving average. This can be a very important reversal point in the chart of uptrending stocks. I ran a scan of Strong AD stocks (from the Strong AD ChartList) that opened above their 20 day EMA, traded below their 20 day EMA, and are currently above their 20 day EMA, searching for a possible reversal at a key moving average. Here are the scan results:
PRNB:
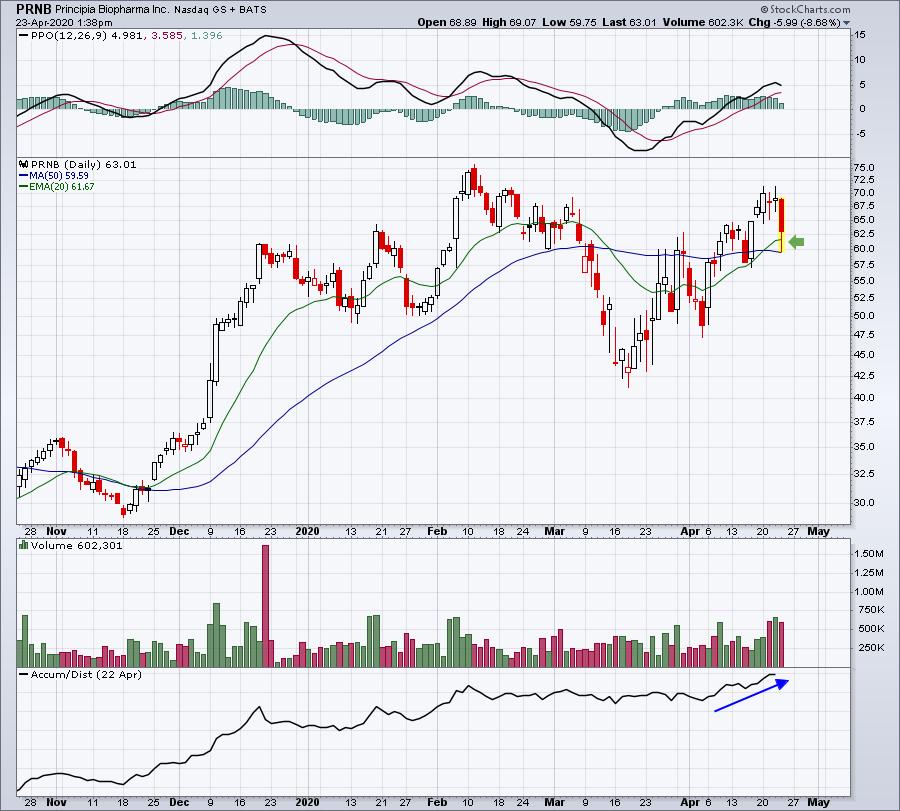
DEA:
HLI:
WORK:
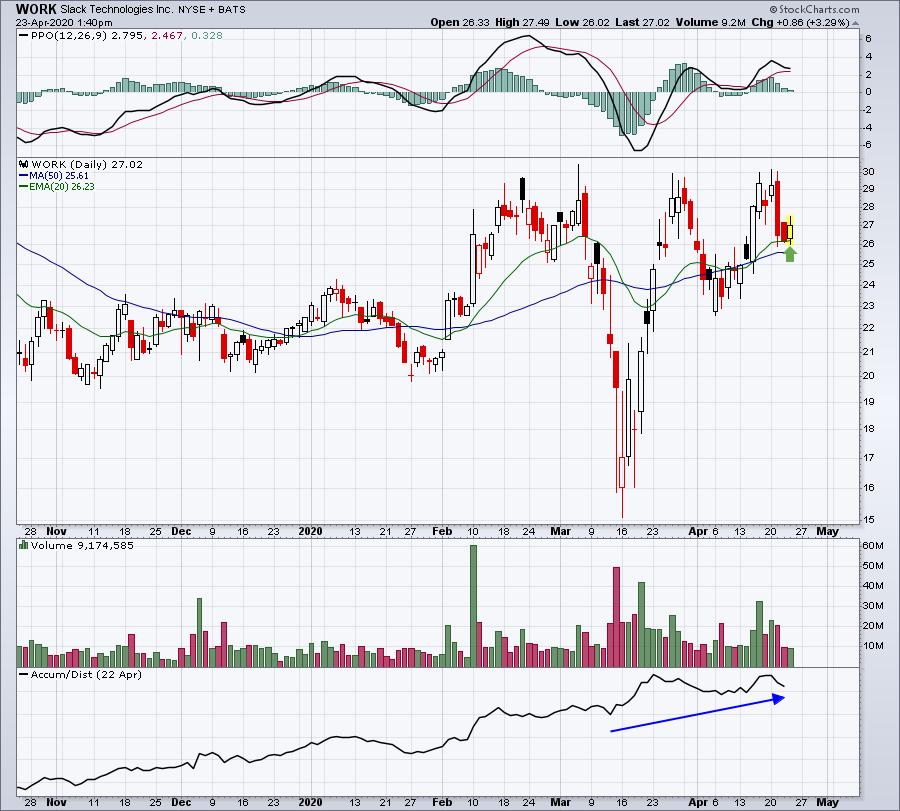
Should our major indices rise from current levels, I'd expect these four strong candidates to outperform and resume their prior uptrends. Should they close back below their rising 20 day EMAs, you could consider keeping a tight stop there. In other words, if they bounce, you stick with them. If they falter, you exit. The biggest risk with this strategy, of course, would be a big opening gap lower.
Happy trading!
Tom