
EB Daily Market Report - Tuesday, April 28, 2020
Executive Market Summary
- Futures were strong out of the gate, but sellers were ready at the open
- The Dow Jones and S&P 500 are still clinging to gains, but the NASDAQ went red early and remains there
- Value stocks (IWD) are favored today, while growth stocks (IWF) are shunned, leaving many recent leaders in negative territory and failing to keep up with our major indices
- Crude oil ($WTIC) remains under pressure, falling 2.7% to $12.44 per barrel
- A rotation into treasuries is also taking place today as the TNX falls 3 basis points to 0.62%
- Asia was flat overnight, but European indices are mostly higher; strength there is no doubt helping U.S. indices in their attempt to rally off earlier lows
- Sectors are mixed with strength in industrials (XLI, -2.00%), while healthcare (XLV, -1.37%) lags
- We have no active trade alerts at this time
Market Outlook
If you're watching today's action and wondering if everything has suddenly flipped, well, it really has. I don't expect this to be a long-term change, but in the very near-term, things have changed. One chart that helps to illustrate this is the IWF:IWD chart, which highlights the recent shift to value stocks vs. growth stocks:
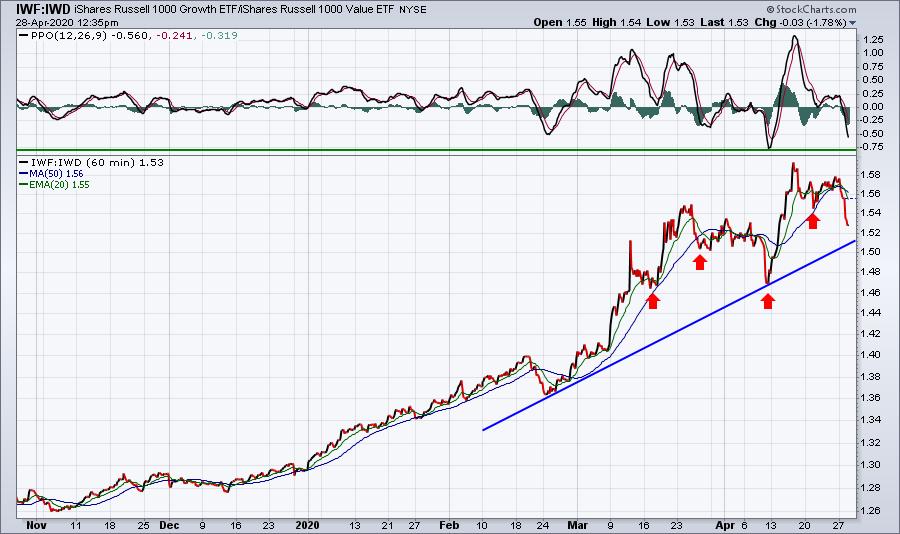
It's important to recognize the short-term shift in strategy, but to ignore the post-virus, 2-month shift to growth stocks would probably be a bigger mistake. We certainly could see more selling of both growth and value stocks after the recent rally, but I'd expect to see a relative strength return to growth after this short-term shift plays out.
Sector/Industry Focus
NASDAQ stocks are feeling the effects of the short-term momentum shift to value stocks. The NASDAQ 100 ($NDX) really doesn't even comprehend the word "value". This index is made up of mega-growth stocks, many of which will likely grow their earnings rapidly, even with the issues posed by COVID-19. That growth in a historically low interest rate environment should result in further gains ahead. In the short-term, however, the market's focus has clearly shifted:
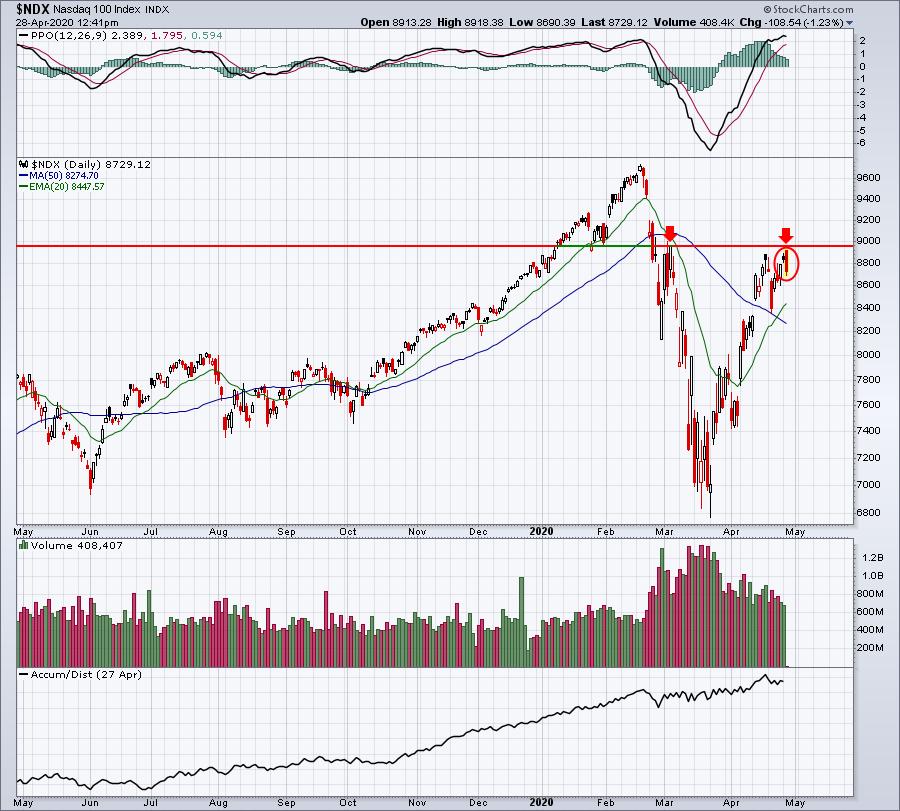
9000 is a big deal. On the first leg to the downside, buyers stepped in and the first rebound attempt failed just beneath 9000. Closing above it, even if just for a day, would show a lot of muscle on the part of the bulls. But we're going to see a selloff at some point, at least a period of consolidation. I think there's very good price/gap support in the 8300-8400 area. In addition, the rising 20 day EMA is typically a destination for a possible selloff and that's currently at 8447. If that range from 8300-8450ish fails to hold, then it'll be time for a more significant evaluation. Until then, I'd treat this as a buyable pullback. It doesn't mean buy anything, it means buy off key support levels and remain vigilant about keeping stops in place.
Strong Earnings ChartList (SECL)
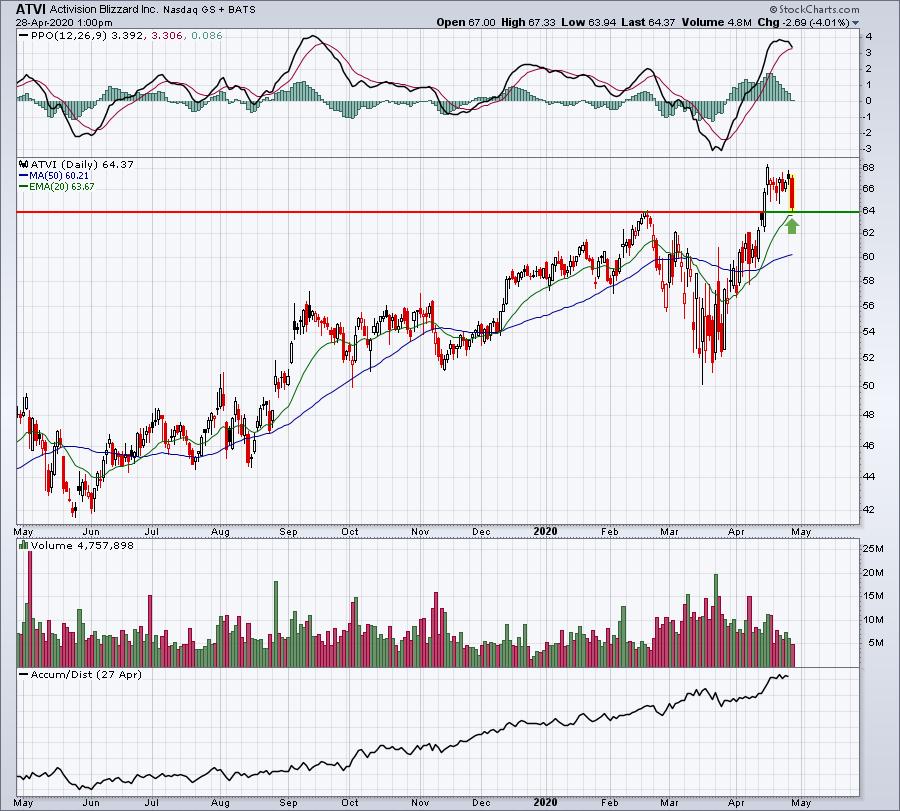
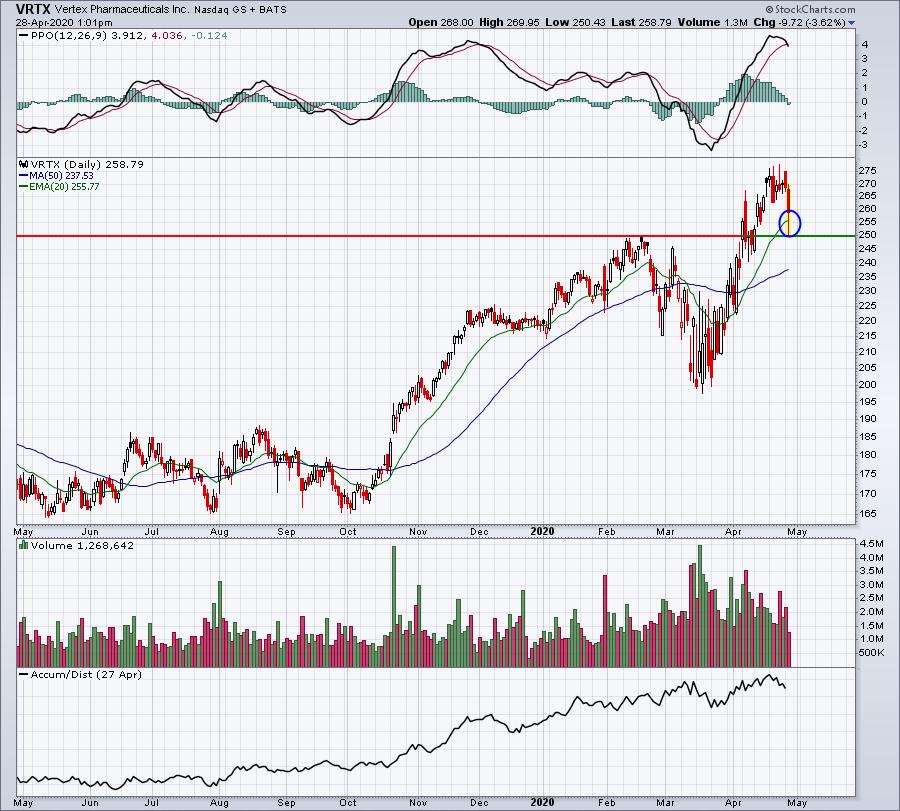
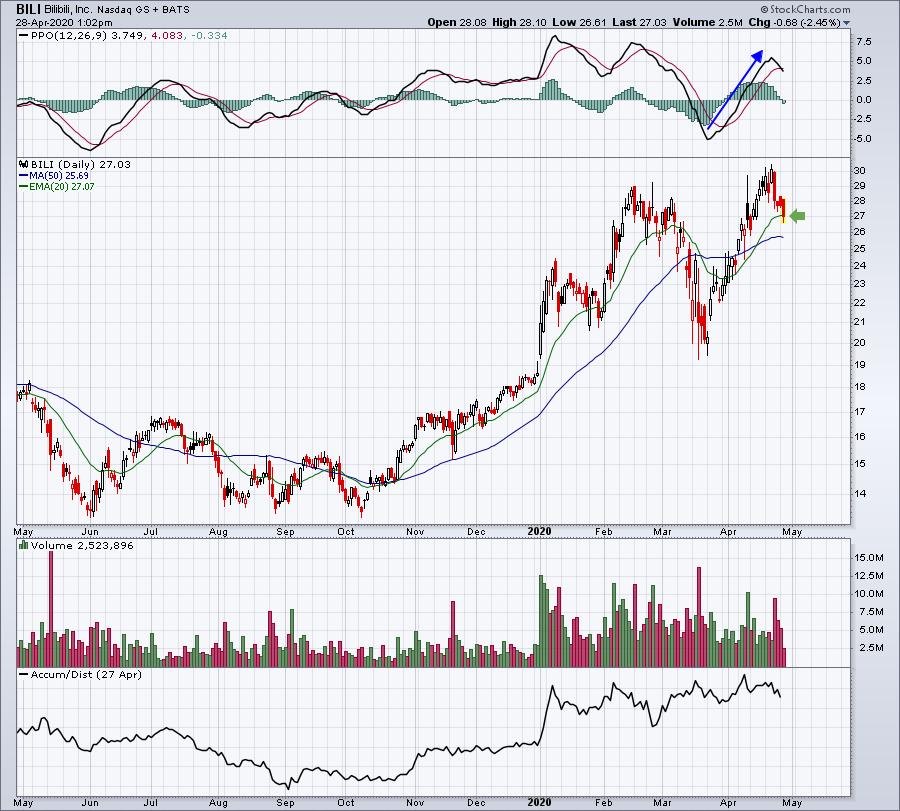
Whether it's the SECL or the Strong AD ChartList, I'd look for pullbacks in very strong stocks (consider SCTRs above 90 with rising AD lines) where we're seeing key support tests. My "go to" support level in a rising market is the 20 day EMA. Here are a couple stocks worth consideration:
RNG:
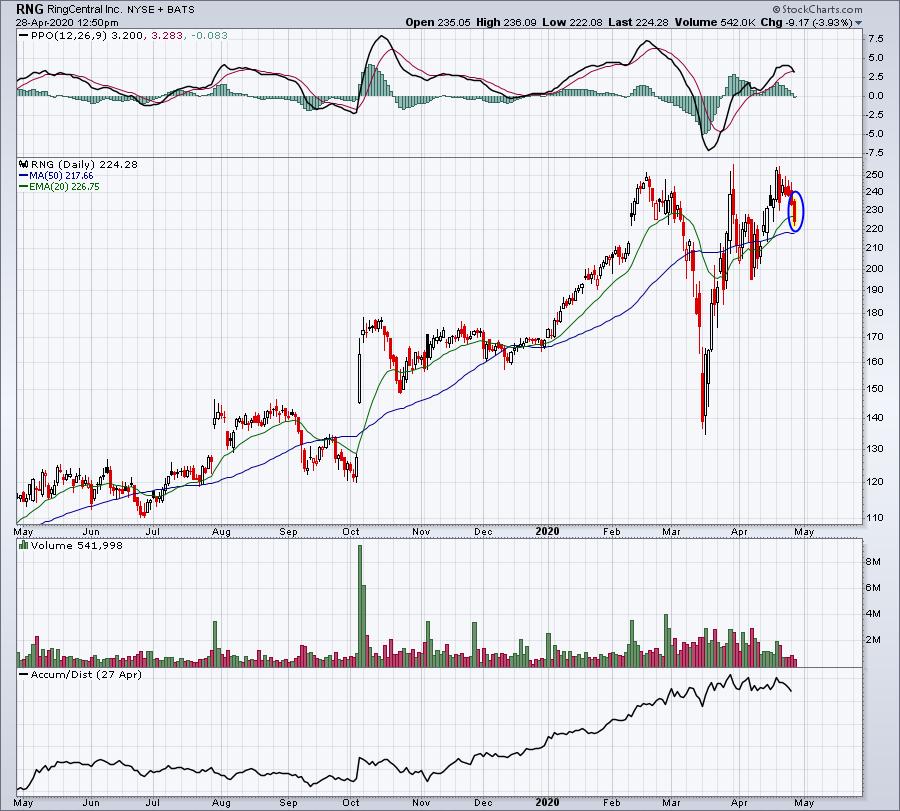
It's slightly below the 20 day EMA, so I might hold off until we see if market makers support the stock. If they do, we should see a recovery later today above the 20 day EMA. At that point, those with a higher-risk mentality might consider buying RNG on the "kick save" at its 20 day EMA with a stop beneath today's low. One risk to consider, though, would be holding overnight. Be sure you're comfortable with that. We still have a Volatility Index ($VIX) in the 30s. Any time the VIX is this high, there remains the possibility of violent moves back and forth - like we saw after the opening bell today.
ZTS:
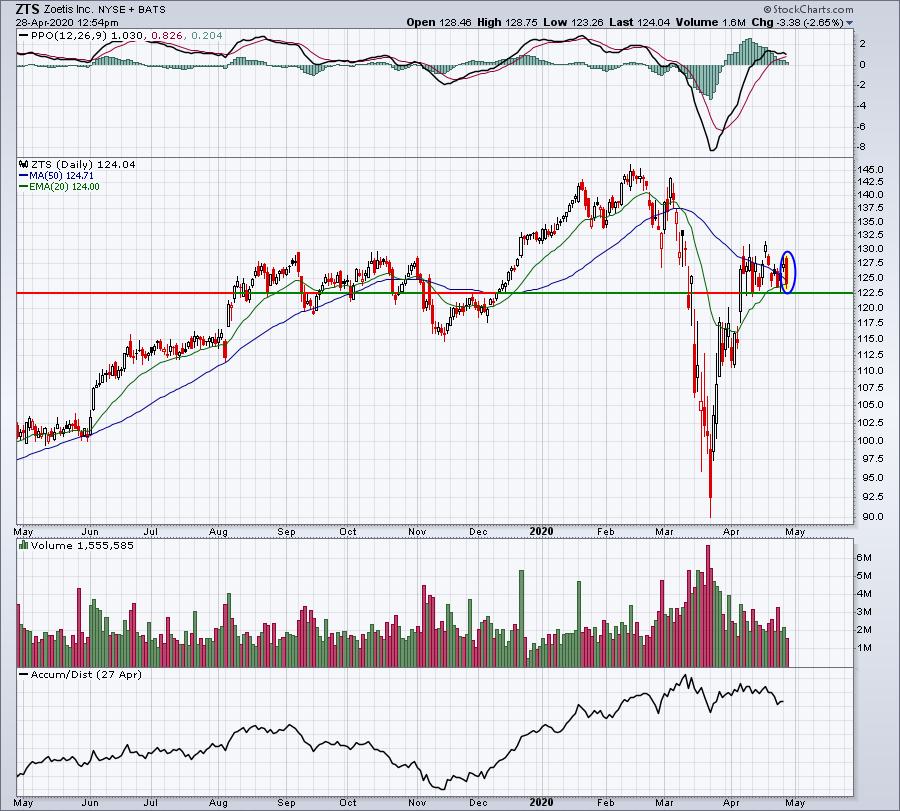
ZTS is sitting almost squarely on its 20 day EMA and it's also close to key price support near 122.50. When I see a clear short-term support like this, I like to see an intraday move beneath that support and a recovery. Why? Well, if ZTS were to drop to say 120, many technicians would view the violation beneath 122 as a reason to sell. If a lot of technical selling begins and the stock recovers, there's usually just one explanation for it. Market makers are likely accumulating for an institutional client.
Strong and Weak AD ChartLists
I'd stick with the same theme as above. The following stocks on the AD ChartList look very interesting to me:
ATVI:
VRTX:
BILI:
NFLX:
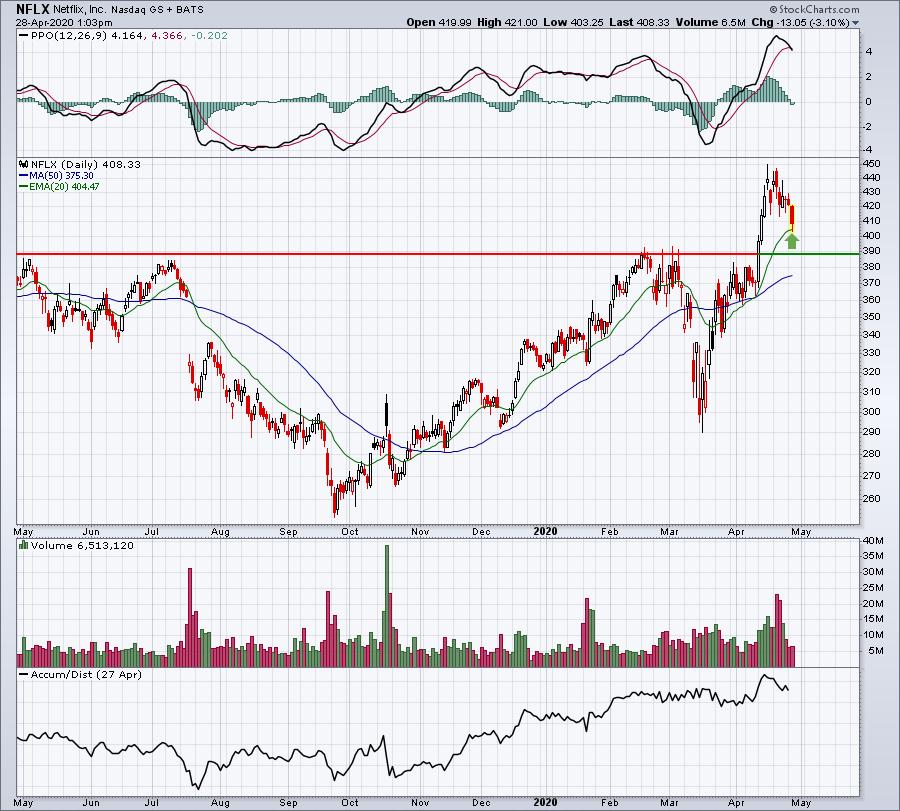
I didn't provide individual explanations on the charts above, but I think you'll be able to see the common denominator. Rising stocks. Strong PPOs. Pullbacks to test either rising 20 day EMAs, price support levels, or both. If you trade them, simply keep fairly tight stops just beneath 20 day EMAs/price support levels.
Earnings Reports
Here are the key earnings reports for today and tomorrow, featuring stocks with market caps of more than $10 billion. I also include a few select companies with market caps below $10 billion. Finally, any portfolio stocks (or active trade alerts) that will be reporting results are highlighted in BOLD. Beginning next week, I'll be placing an asterisk (*) next to stocks that are showing excellent relative strength and accumulation/distribution lines heading into their respective earnings report. In my judgment, I'd expect strong results and guidance, although correctly predicting which way a stock might gap after an earnings report is much more difficult. If you decide to hold a stock into earnings, please understand the significant short-term risk that you are taking. For this week's earnings reports, you should check out our "Q1 Earnings" webinar, where I detailed in two separate ChartLists those stocks where I'd look for good and bad quarterly earnings results. Please be sure to check for earnings dates for any companies you own or are considering owning:
Tuesday, April 28:
GOOGL, MRK, PFE, NVS, PEP, SBUX, UPS, MMM, BP, MDLZ, SPGI, AMD, CAT, ECL, CNC, VALE, ROP, DXCM, TAL, MSCI, IQV, SIRI, TROW, TEL, CERN, CMI, CSGP, ROK, DTE, F, YUMC, BSBR, AKAM, LUV, GLW, DHI, MXIM, AGR, BXP, TRU, PAYC, OKE, WAT, YNDX, NUE, OMC, MASI, ZBRA. Others less than $10 bil: CHRW, MPWR, JNPR, MKSI, MRCY, PII, XRX, HELE, HOG, WERN, LSCC, FEYE, MTH, IRBT
Wednesday, April 29:
MSFT, FB, MA, AZN, TSLA, AMT, QCOM, BA, VRTX, CCI, ANTM, CME, ADP, NOW, NOC, GE, BSX, HUM, SHW, NSC, GD, EPD, EBAY, AFL, YUM, SPOT, VLO, CAJ, ADM, BCS, BMRN, GIB, MKTX, LH, ALGN, GRMN, TDOC, HIG, DRE, TYL, ROL, HOLX, MAS, HAS. Others less than $10 bil: AVY, FICO, RJF, NLY, URI, CREE, SLAB, CCS
Economic Reports
FOMC 2-day meeting begins
February Case-Shiller HPI: +0.4% (actual) vs. +0.4% (estimate)
April consumer confidence: 86.9 (actual) vs. 90.0 (estimate)
Happy trading!
Tom