
EB Daily Market Report - Wednesday, April 29, 2020
Executive Market Summary
- Futures were up after a strong quarterly report from Alphabet (GOOGL)
- Futures strengthened further after positive results from Gilead Sciences' (GILD) coronavirus treatment
- Gold ($GOLD) is down $10 per ounce and nearing $1700; crude oil ($WTIC) is up 28%
- The 10 year treasury yield ($TNX) remains problematic, dropping a basis point to 0.60%
- Asia was mostly lower overnight, but Europe is having another strong session
- Energy (XLE, +5.97%) is having a very strong day, followed closely by communication services (XLC, +4.94%), which is buoyed by GOOGL's strength
- Consumer staples (XLP, +0.29%) is lagging today's strength by a considerable margin
- We have no active trade alerts at this time
Market Outlook
On the NASDAQ 100 ($NDX), the intraday high on the March 3rd rally attempt was 9000.46. At last check, the NDX was at 8973.08. We're moving very, very close to an important technical resistance level. The NDX is easily the first major index to test this reaction high. For comparative purposes, the S&P 500 is at 2947.62, while that March 3rd reaction high ended at 3136.72. That shows you the relative strength of the NDX. Another way to visualize the relative strength of the NDX is as follows:
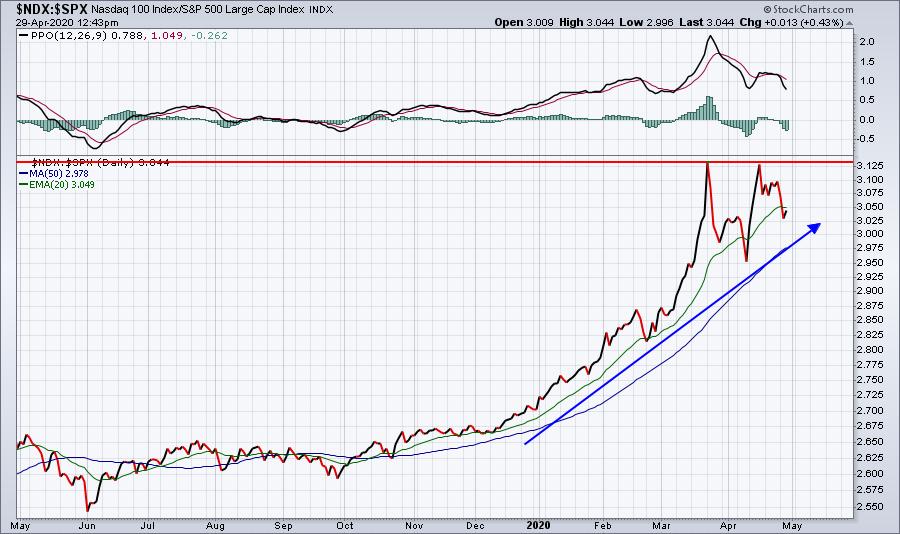
When we see a chart like this, we always want to assume that something can't continue higher. Well, just keep in mind that the NASDAQ 100 index is home to some of the fastest growing technology companies in the world. In a historically-low interest rate environment, earnings growth is extremely valuable. The normal "PE bar" gets raised and these high growers can rally as long as their earnings growth continues. I'd stick with this trend until the trend ends. Don't assume it will end. If you had thought this relative rally was unsustainable back in January or February, it would've been a very costly mistake. The trend truly is our friend.
Sector/Industry Focus
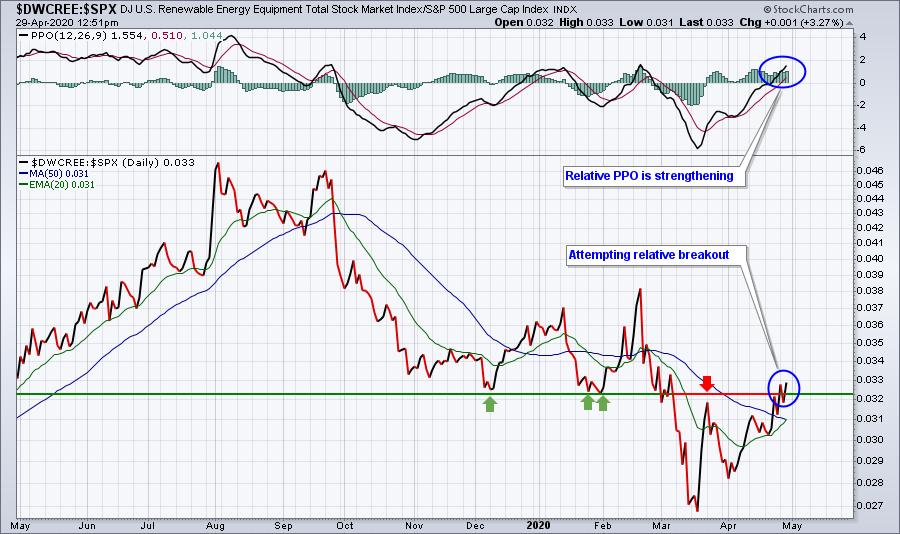
For the first time in seven months, the renewable energy group ($DWCREE) has begun to show considerable relative strength vs. the S&P 500. Check out this relative price chart ($DWCREE:$SPX):
One of the stocks in our Aggressive portfolio is Enphase Energy (ENPH), a renewable energy stock, and it's broken out and has been scorching higher:
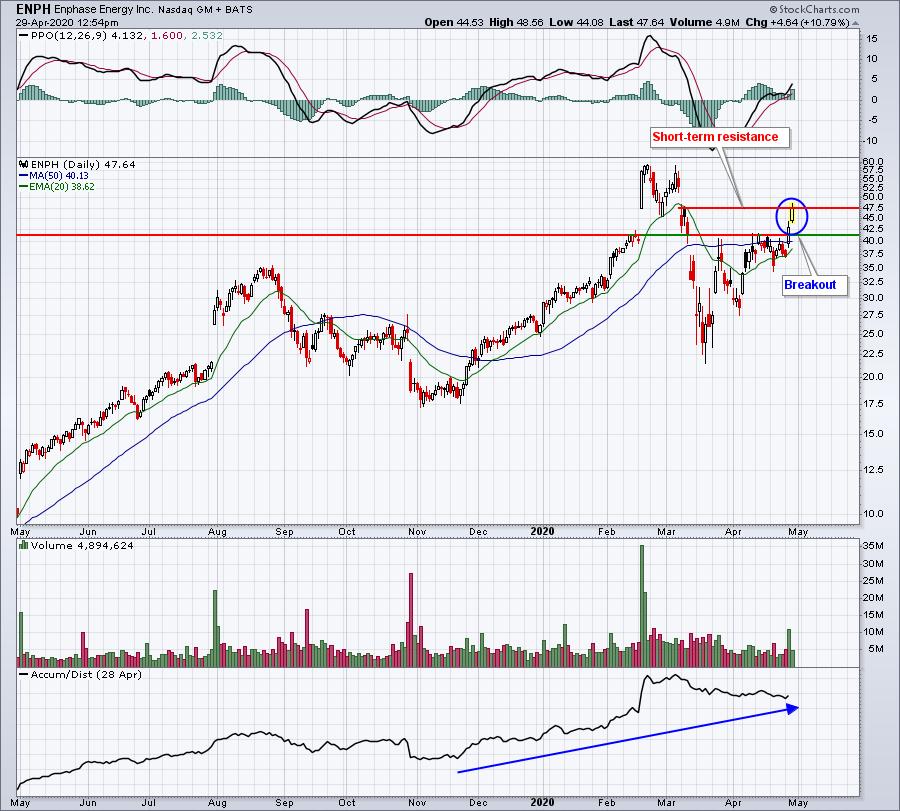
It has hit a short-term area of price resistance, however, so a pullback from this level shouldn't be a surprise.
Strong Earnings ChartList (SECL)
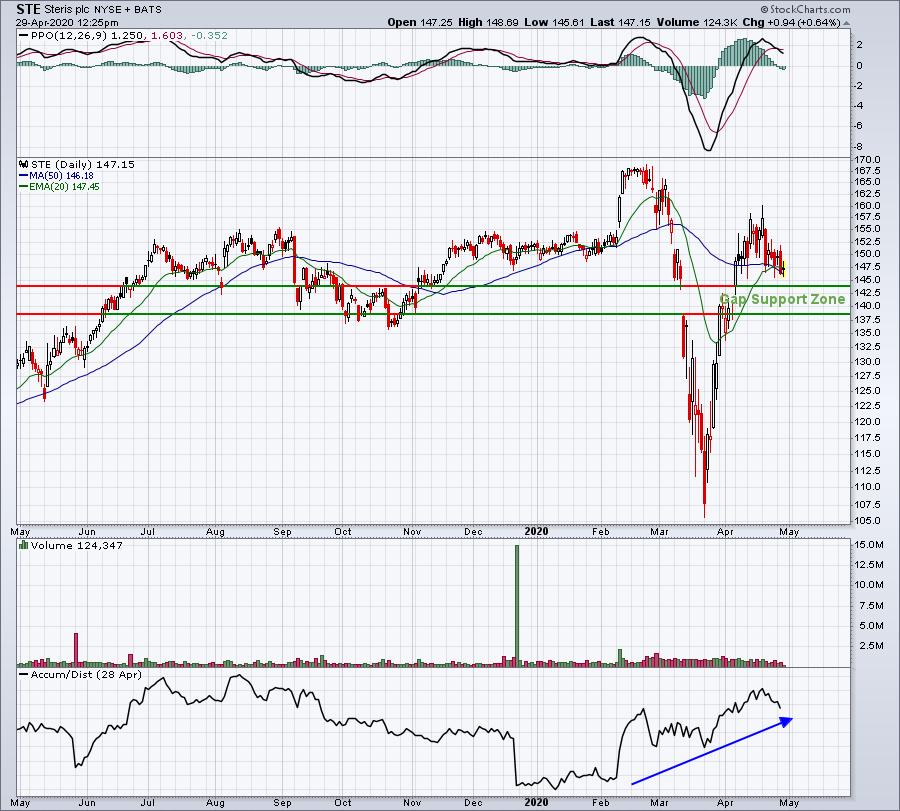
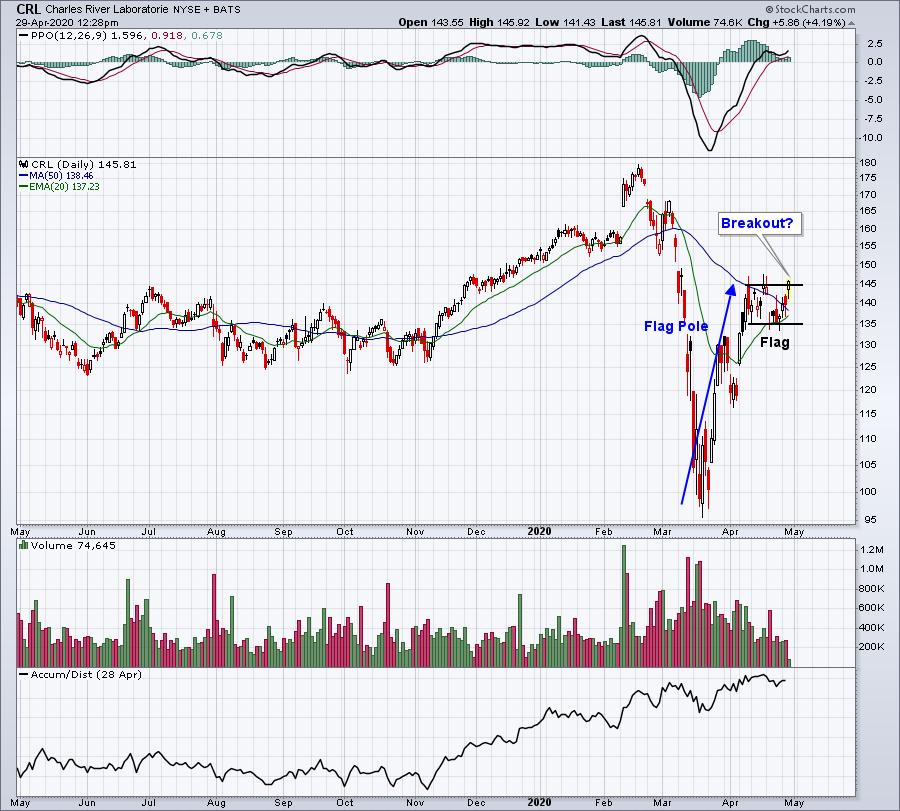
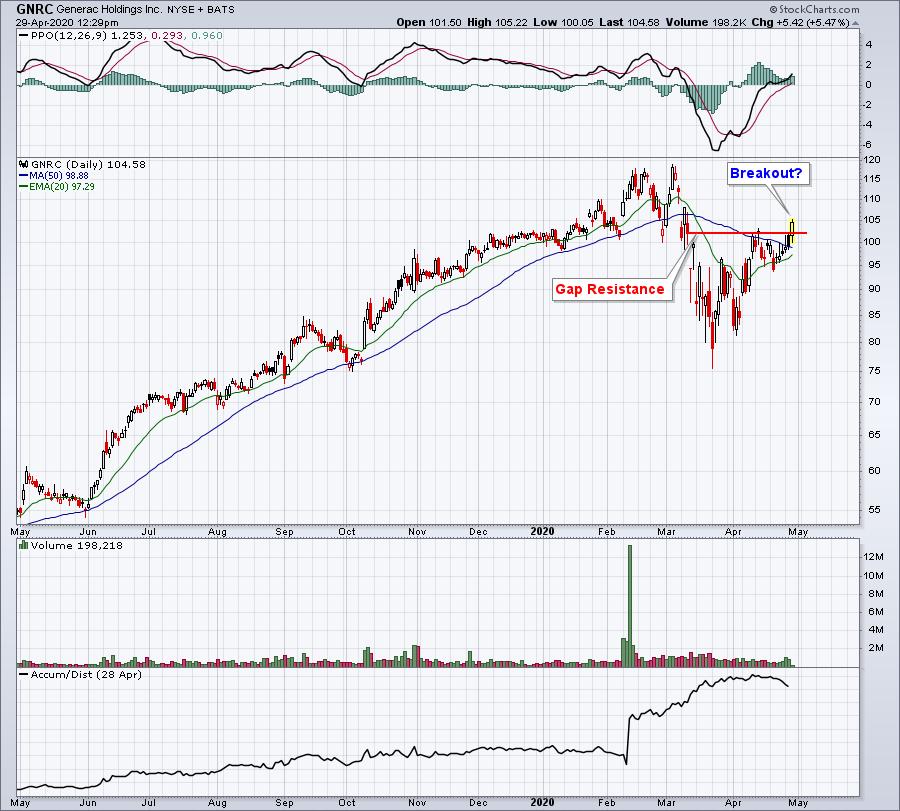
Scrolling through today's SECL, I found the following charts interesting:
STE:
CRL:
GNRC:
EVBG:
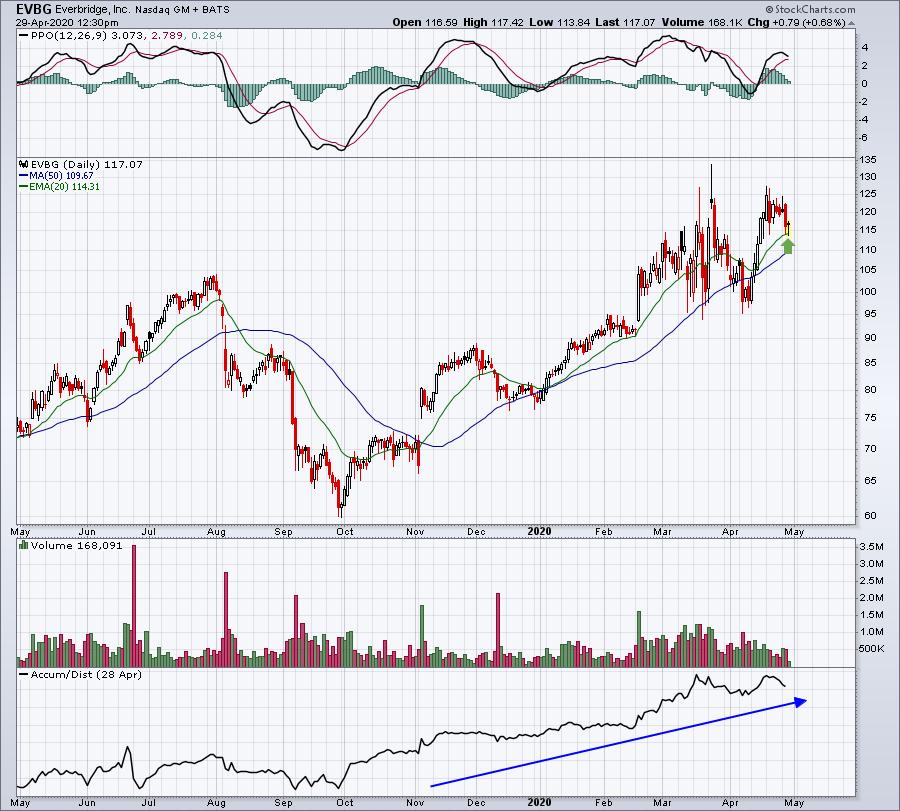
The charts above feature both pullbacks and potential breakouts as trade candidates, keeping in mind that their latest quarterly results came in ahead of expectations as to both revenues and EPS. Also, accumulation/distribution lines are very bullish as well.
Strong and Weak AD ChartLists
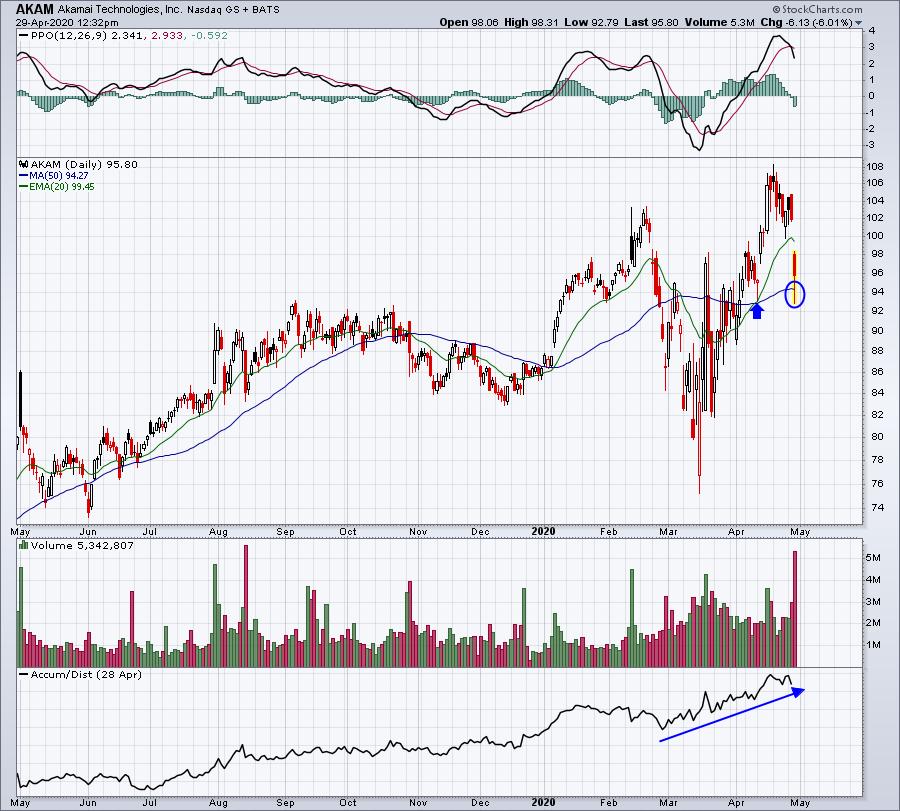
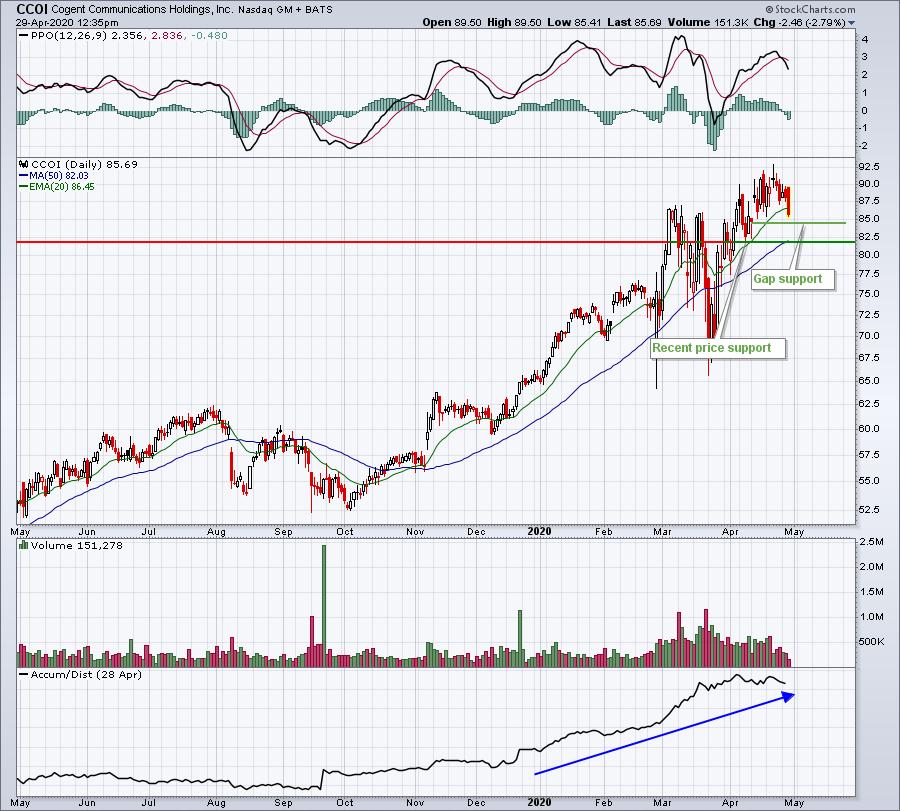
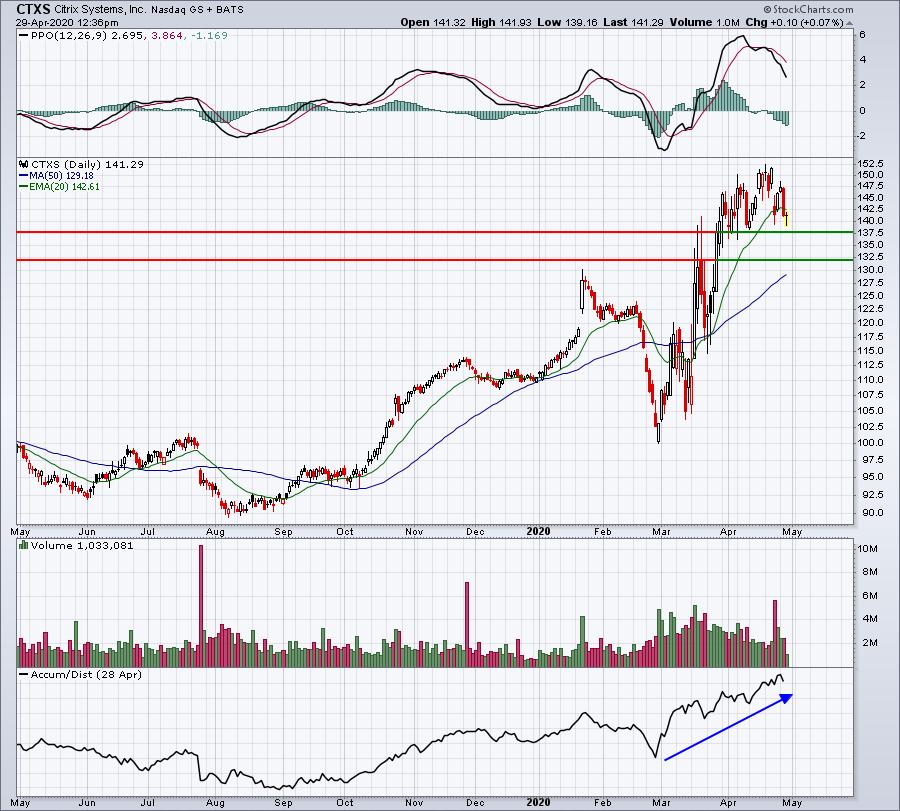
On the Strong AD ChartList, I looked through all 373 charts and found the following to be noteworthy:
AKAM:
CCOI:
CTXS:
PGR:
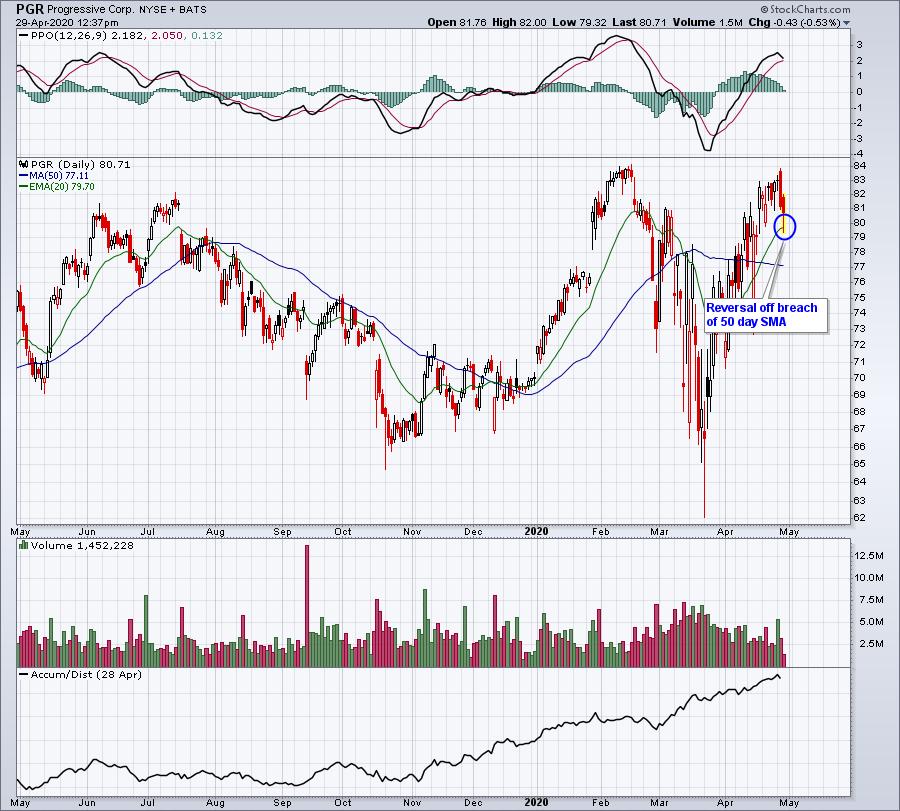
These are four examples of pullbacks that definitely grab my attention in a bull market phase. 20 day EMAs and price support are very critical to watch. Reversals that occur at these levels can be extremely profitable. Just make sure you keep fairly tight stops in place in the event a stock breaks down.
Earnings Reports
Here are the key earnings reports for today and tomorrow, featuring stocks with market caps of more than $10 billion. I also include a few select companies with market caps below $10 billion. Finally, any portfolio stocks (or active trade alerts) that will be reporting results are highlighted in BOLD. Beginning next week, I'll be placing an asterisk (*) next to stocks that are showing excellent relative strength and accumulation/distribution lines heading into their respective earnings report. In my judgment, I'd expect strong results and guidance, although correctly predicting which way a stock might gap after an earnings report is much more difficult. If you decide to hold a stock into earnings, please understand the significant short-term risk that you are taking. For this week's earnings reports, you should check out our "Q1 Earnings" webinar, where I detailed in two separate ChartLists those stocks where I'd look for good and bad quarterly earnings results. Please be sure to check for earnings dates for any companies you own or are considering owning:
Wednesday, April 29:
MSFT, FB, MA, AZN, TSLA, AMT, QCOM, BA, VRTX, CCI, ANTM, CME, ADP, NOW, NOC, GE, BSX, HUM, SHW, NSC, GD, EPD, EBAY, AFL, YUM, SPOT, VLO, CAJ, ADM, BCS, BMRN, GIB, MKTX, LH, ALGN, GRMN, TDOC, HIG, DRE, TYL, ROL, HOLX, MAS, HAS. Others less than $10 bil: AVY, FICO, RJF, NLY, URI, CREE, SLAB, CCS
Thursday, April 30:
AAPL, AMZN, V, CMCSA, RDS.A, AMGN, MCD, GILD, MO, SYK, CI, SO, ICE, MMC, MCO, BAX, ILMN, COP, KHC, ETN, PSA, BBD, DOW, SGEN, IDXX, TWTR, RMD, WLTW, K, EIX, FTV, NOK, TEAM, PH, CHD, SWK, ATUS, TFX, AJG, AEM, SSNC, IP, WDC, LNG, CXO, MOH, OTEX. Others less than $10 bil: TAP, COG, ZEN, MGM, PRGO, WHR, UAL, GNRC, DNKN, TNDM, AAL, BAND, FLWS
Economic Reports
FOMC 2-day meeting ends with policy statement at 2pm EST
Q1 GDP - first estimate: -4.8% (actual) vs. -3.7% (estimate)
March pending home sales: -20.8% (actual) vs. -10.0% (estimate)
Happy trading!
Tom