
EB Daily Market Report - Friday, May 1, 2020
Executive Market Summary
- Futures were very weak this morning, with big moves lower in premarket action from both Apple (AAPL) and Amazon.com (AMZN)
- These two giants reported their quarterly results and, surprisingly, AMZN missed its EPS estimate
- We have seen some initial buying off the opening gap lower - that was a theme in March if you recall; I'll be watching to see if it continues today
- Volatility ($VIX) has spiked 8% today, but it is off it's earlier high and remains below its 20 day EMA
- Early action shows strength in communication services (XLC), consumer staples (XLP), technology (XLK), and health care (XLV), which is where we saw March relative strength during selloffs
- Clorox (CLX, +5.13%) is one of the best S&P 500 performers after easily beating EPS estimates (1.89 vs. 1.17)
- We have no active trade alerts at this time
Market Outlook
The accumulation/distribution line, which we have featured significantly throughout this pandemic, ignores gap downs and only considers the intraday action. The hallmark of the 35% selloff in the S&P 500 from February 19th through March 23rd was primarily the fact that opening gaps lower accounted for the overwhelming majority of losses throughout that period. In other words, once the opening bell rang, buyers were present. The bears will be looking for something different this time. They want to see fear escalate and impulsive selling kick in during the trading day. If they have any hope of seeing a retest of the March 23rd low, or worse, sellers need to show up in droves during the trading day. Otherwise, I see a continuing trend higher after a period of consolidation.
Sector/Industry Focus
Thanks to Apple's (AAPL) recovery since the opening bell gap lower, computer hardware ($DJUSCR) continues its trend higher. Here's the current chart:
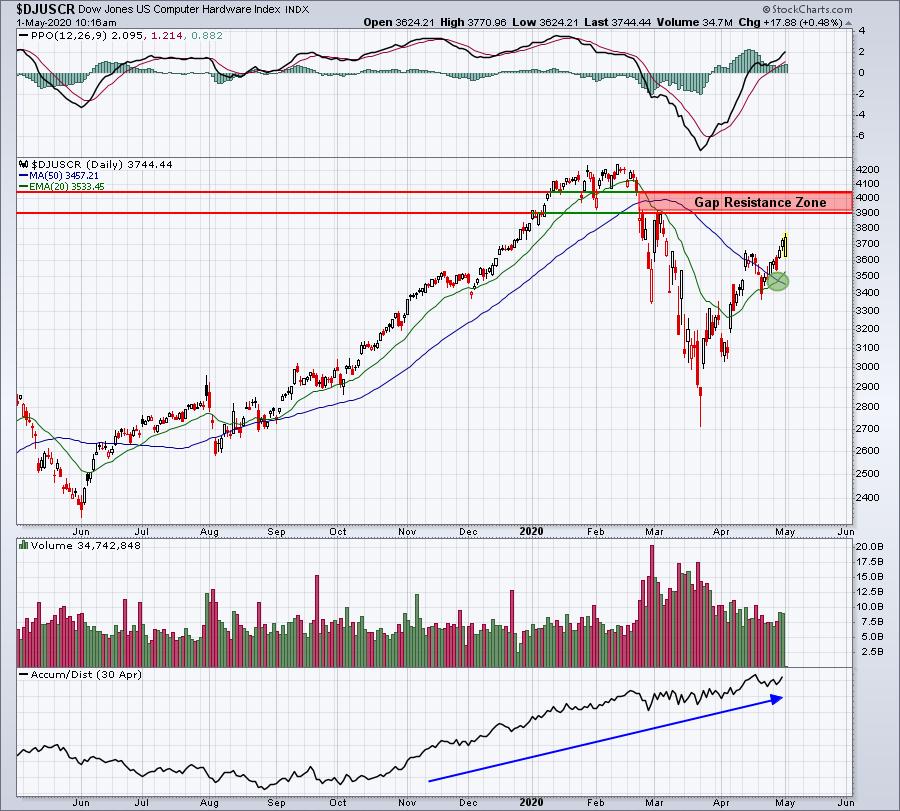
The DJUSCR is nearing a key area of gap resistance, but it does have further short-term room to run. To the downside, the green-shaded area is simply illustrating the "golden cross", which is when a short-term moving average crosses above a longer-term moving average. It suggests confirmation of a trend reversal, so I'd now watch that rising 20 day EMA as key support for the DJUSCR on any short-term selling.
Strong Earnings ChartList (SECL)
I've had multiple members ask me to provide more specifics about setting up a potential trade. So I thought ACAD would be a good example for today. When we see weakness in the market like today, sometimes I'll look for reversing-type candles on healthy stocks. Here's a possible trade strategy on ACAD today if it reverses back above its 20 day EMA:
ACAD:
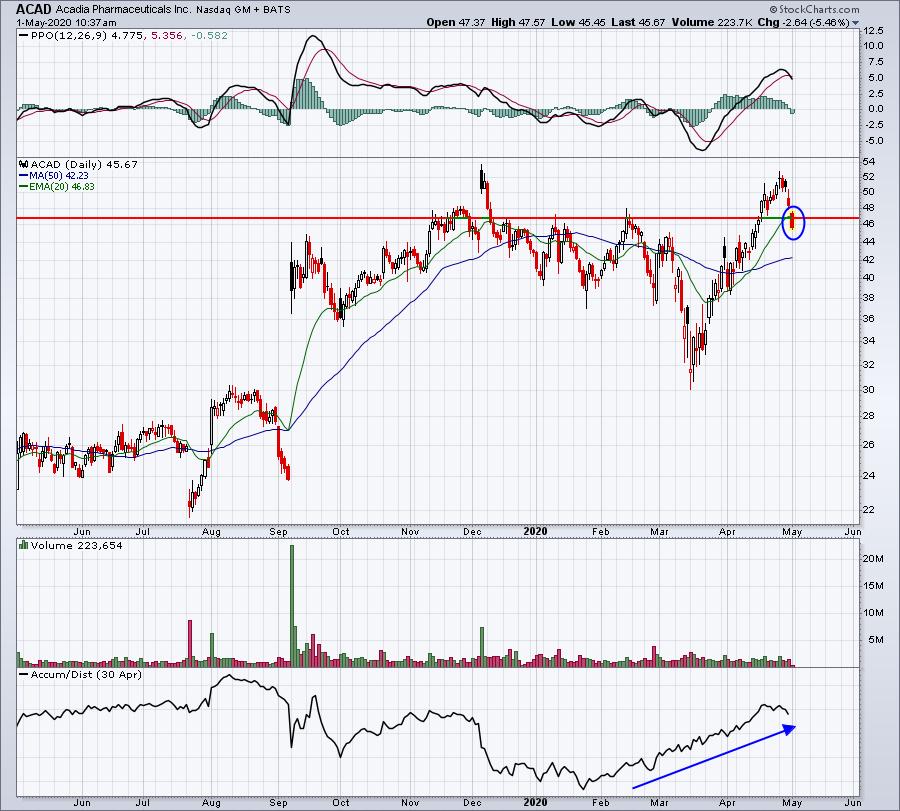
Currently, ACAD appears to be breaking down beneath its rising 20 day EMA. Given the very strong PPO and AD lines and the fact that it's part of one of the strongest industry groups in 2020 - biotechs ($DJUSBT) - a reversal today and close above that 20 day EMA would be a very bullish short-term development for ACAD. Buying it now provides a better reward opportunity, but it's taking a chance that we'll see that reversal. Tough call. But putting in a "buy stop" just above the 20 day EMA would mean that you're actually seeing the reversal before buying. At that point, an intraday stop could be placed beneath today's intraday low. You could evaluate that potential % loss and see what you'd be willing to risk based on that. For instance, if the current low turns out to be THE low at 45.45 and ACAD returns to 46.84 to move back above its 20 day EMA, a buy with an intraday stop at 45.44 would result in a 1.40 loss, or 3%. If you don't want to lose more than say $300 on the trade, then you can only buy 214 shares ($300/$1.40 loss per share) at 46.84. 214 shares would cost $10,023.76. I would want to make sure that the chart suggests at least the potential for a $2.80 gain (2x the loss potential). That would mean a rise on ACAD back to 49.64 (46.84 buy price plus 2.80 gain). Looking at the chart above, I see a recent price high near 52.00. If we used 52.00 as our target, a potential profit would be 5.16. The reward to risk (5.16 profit potential divided by 1.40 loss potential) would equal 3.69. That's how I would review a potential trade.
Keep one thing in mind. As ACAD trades lower in the trading day, this impacts the reward to risk calculation should we see that reversal later today. If it were to move below 44.26, the reward to risk on this trade would drop beneath 2 to 1 and would become less appealing to me.
Strong and Weak AD ChartLists
I looked at the worst performing Strong AD ChartList stocks today and here's what I saw:
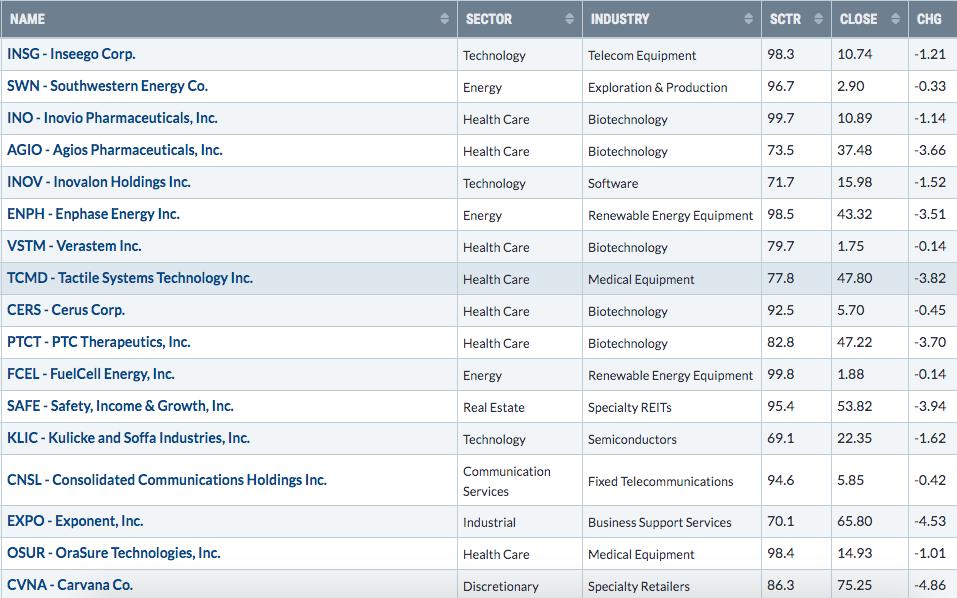
Two stocks that could get very interesting as they near price/moving average support are as follows:
CERS:
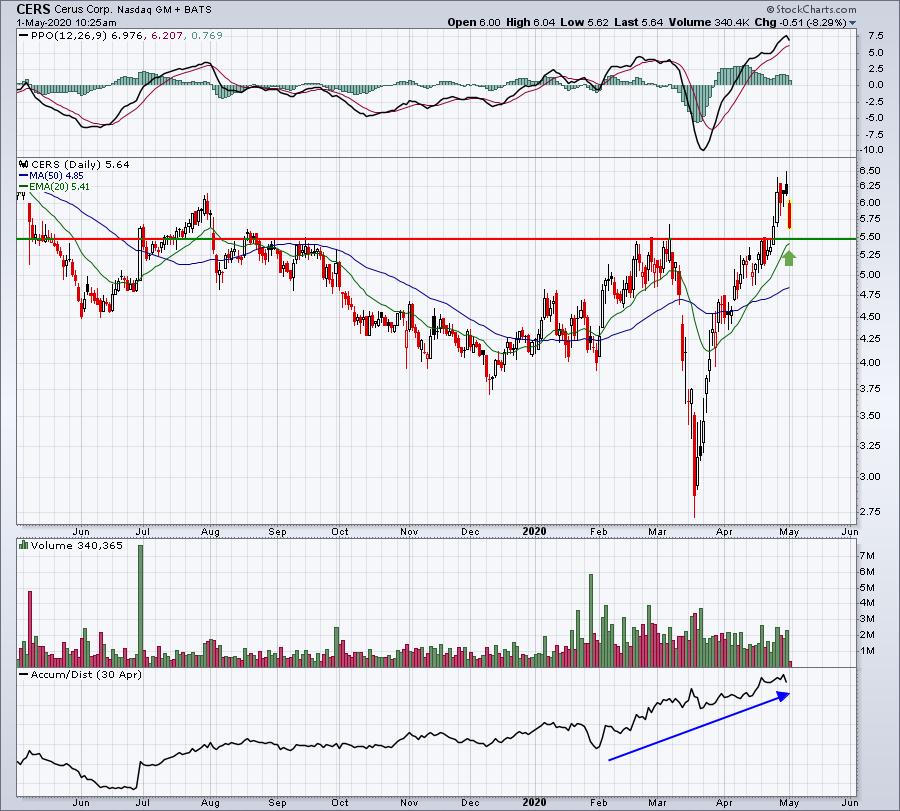
CERS has been a very strong biotech stock of late and its AD line shows that there hasn't been a lot of intraday selling recently. Therefore, today's move lower and approach of its 20 day EMA could be an opportunity should the market reverse later in the day.
ENPH:
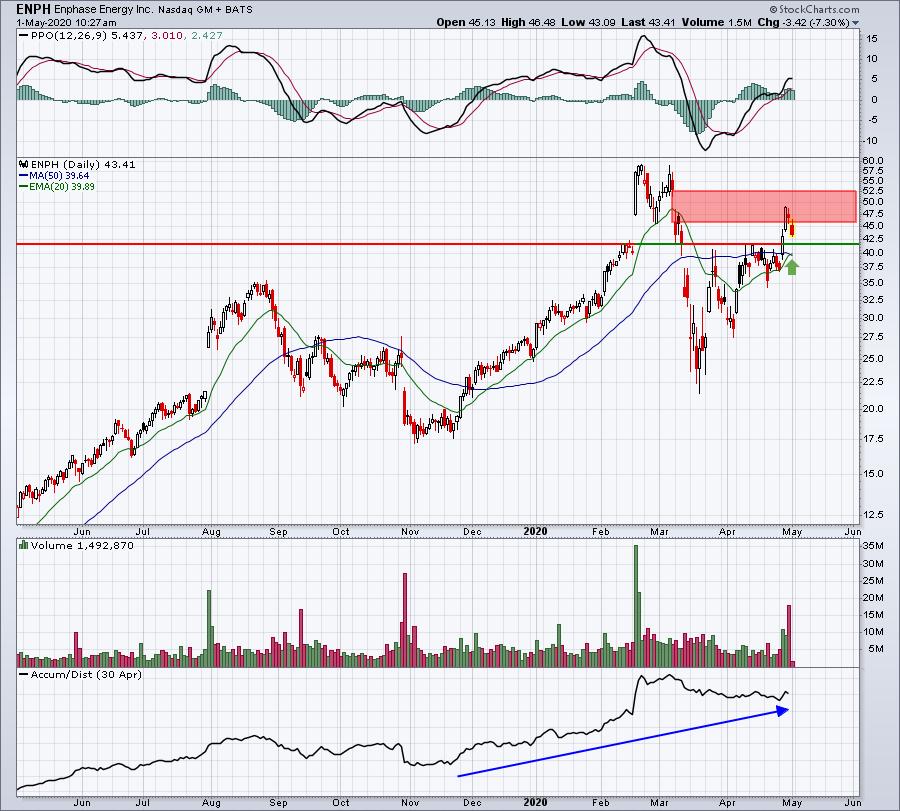
40-42 is the key support range that I'd want to see hold here on ENPH. Building a position in that "zone" given the zero commission trading environment makes sense to me. I'd be careful, however, with a close beneath 39.50. Ultimately, a target in that red-shaded gap resistance area would provide a solid return.
Earnings Reports
Here are the key earnings reports for today and tomorrow, featuring stocks with market caps of more than $10 billion. I also include a few select companies with market caps below $10 billion. Finally, any portfolio stocks (or active trade alerts) that will be reporting results are highlighted in BOLD. Beginning next week, I'll be placing an asterisk (*) next to stocks that are showing excellent relative strength and accumulation/distribution lines heading into their respective earnings report. In my judgment, I'd expect strong results and guidance, although correctly predicting which way a stock might gap after an earnings report is much more difficult. If you decide to hold a stock into earnings, please understand the significant short-term risk that you are taking. For this week's earnings reports, you should check out our "Q1 Earnings" webinar, where I detailed in two separate ChartLists those stocks where I'd look for good and bad quarterly earnings results. Please be sure to check for earnings dates for any companies you own or are considering owning:
Friday, May 1:
XOM, CVX, ABBV, CHTR, HON, CL, EL, TRP, AON, PSX, CLX, JCI, LYB, WY, QSR, WPC, CBOE, IMO, PSXP. Others less than $10 bil: APO, HRC, NWL, CCJ, HUN, MINI
Monday, May 4:
ITUB, SRE, WEC, RACE, PEG, AIG, WMB, TSN, O, SWKS, JKHY, WAB, VAR, ACGL. Others less than $10 bil: CNA, VNO, OHI, MHK, XPO, FIVN, CRUS, ALSN, UNM, FN, SHAK, EVER
Economic Reports
April PMI manufacturing: 36.1 (actual) vs. 36.9 (estimate)
April ISM manufacturing: 41.5 (actual) vs. 37.5 (estimate)
March construction spending: +0.9% (actual) vs. -3.5% (estimate)
Happy trading!
Tom