
EB Daily Market Report - Thursday, May 7, 2020
Big Saturday Event
Mark your calendar for Saturday, May 9th at 2pm EST. That's when Grayson Roze and Bill Shelby will join the EarningsBeats.com community in our WebinAR (WAR) Room! Grayson and Bill will share their expertise in organizing ChartLists, managing ChartStyles, creating ChartStyle buttons (a superb short cut!), setting up scans (Bill is the creator of the scan engine at SC, so absolutely NO ONE knows scanning at SC like Bill), etc. I'll also be discussing our AD ChartLists and will unveil yet another ChartList - the ShortSqueeze ChartList to track stocks that could be setting up for an explosive rally thanks to all of those that are betting against this market and, more specifically, certain stocks.
It should prove to be another great day of education at EarningsBeats.com! I hope you all can make it. We'll be sure to provide instructions over the next two days to make sure you can join us LIVE. If you have a prior commitment and can't make it, no worries! We'll be recording the event and we'll make sure it gets posted to our Webinar Archives.
Executive Market Summary
- Futures were strong out of the gate, following the lead of European indices
- All major U.S. indices are higher, led by the Russell 2000's 2.09% rise
- Initial jobless claims were over 3 million once again, slightly higher than forecast
- Moderna (MRNA) surges 13% at the open after FDA approves its COVID-19 vaccine for phase 2 trial
- Crude oil ($WTIC) rises more than 7% to top $25 per barrel for first time since early April
- 10 year treasury yield ($TNX) falls 6 basis points to 0.65% on high jobless claims
- Energy (XLE) and financials (XLF), two beaten down groups, lead the market higher
- Consumer staples (XLP) and healthcare (XLV) trail today, though all 11 sectors are currently higher
- Earnings lift many companies, including PayPal (PYPL, +13%), Peloton Interactive (PTON, +14%), and Fortinet (FTNT, +22%)
Market Outlook
Those of you that know me well or have followed my work for years know that I am a student of history. Today, we are entering a period of the month where we can see short-term bouts of profit taking. The 7th through the 10th tends to be a period of profit taking and we've certainly seen a solid advance lately that could set up to a bit of selling. Therefore, we shouldn't rule that out. I wouldn't necessarily raise 100% cash because of this historical tendency, but being prudent and selling positions that have hit or approached your target makes some sense. Even selling partial positions to raise cash in the event that stocks get a little cheaper makes sense as well.
The S&P 500 appeared to be channeling lower.....until it wasn't any longer:
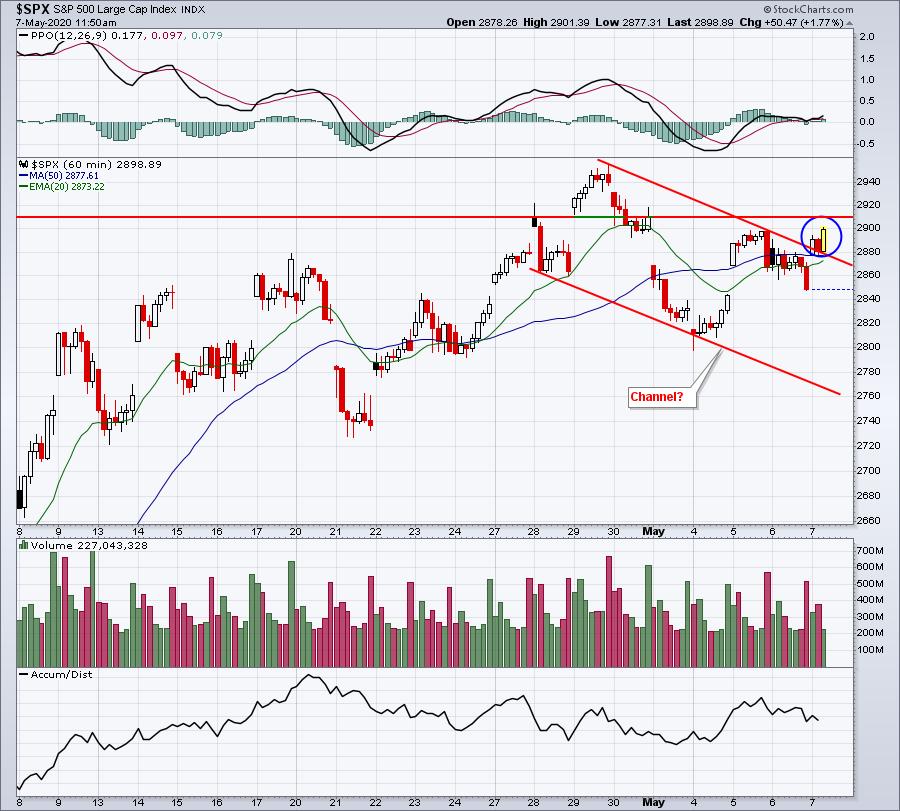
A close above gap support near 2910 would add yet another argument to the bullish case for U.S. equities, despite the historical tendency to see prices pull back some.
Sector/Industry Focus
Toys ($DJUSTY) has been a hot industry group and it's been of the best groups since the February 19th top. In other words, it's been a safe haven of sorts as the pandemic kicked into gear. The DJUSTY just broke out again yesterday, but I will offer some words of caution as you look at this chart:
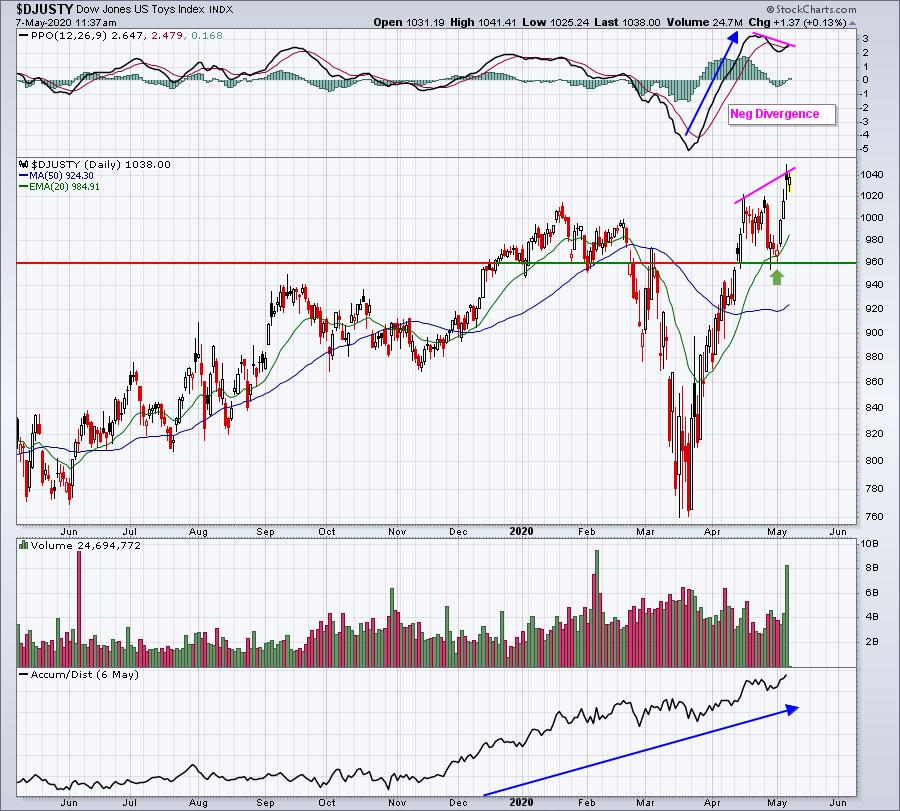
The AD line has been awesome in 2020 and the uptrend has been solid as well. At the April price high, check out that PPO - pointing straight up. That suggests that any bout of selling is likely to be contained at or near the 20 day EMA (green arrow), which is exactly what happened. However, this latest breakout currently shows a lower PPO, or a negative divergence. That doesn't mean we're going to move lower, but it does provide us a bit of a red flag. The bullish argument is that this breakout occurred on very heavy volume. That is NOT a signal of slowing momentum. The bulls would like to see continuing movement to the upside and the PPO strengthening and clearing the previous high. That would eliminate the negative divergence. The bearish development would be the DJUSTY failing to hold price support near 1020 with a negative divergence in play. That could lead to more short-term selling.
Strong Earnings ChartList (SECL)
On our next updated SECL, stocks like PetMed Express (PETS) will be added. PETS recently blew away both revenue and EPS estimates and the stock's been on a tear. I'm stalking the stock right now and could pull the trigger on a trade soon. I just wanted to show you a couple charts and what I'm looking at:
PETS - daily chart:
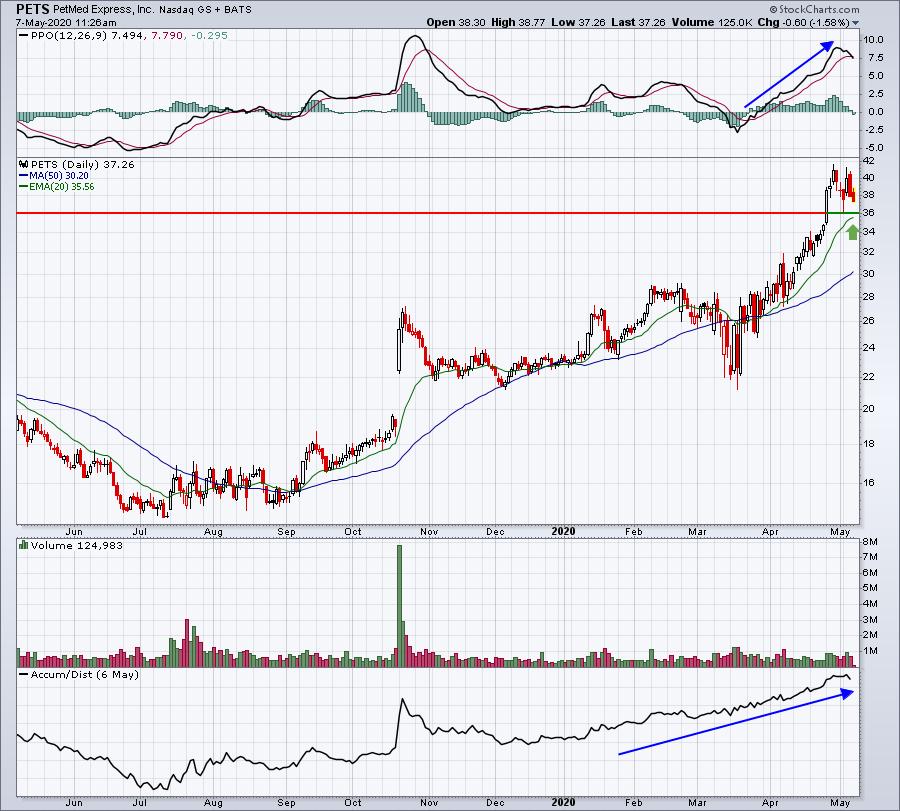
The daily PPO is very strong and PETS really seemed to be trading in a "buy on rumor, sell on news" pattern. After the extremely bullish quarterly earnings were released on Monday, PETS sold off. It was above 41 on Tuesday and now it's at 37.26. I'm salivating. The AD line has been powerful, even through the March downturn. Here's the intraday chart:
PETS - 5 day, 10 minute chart:
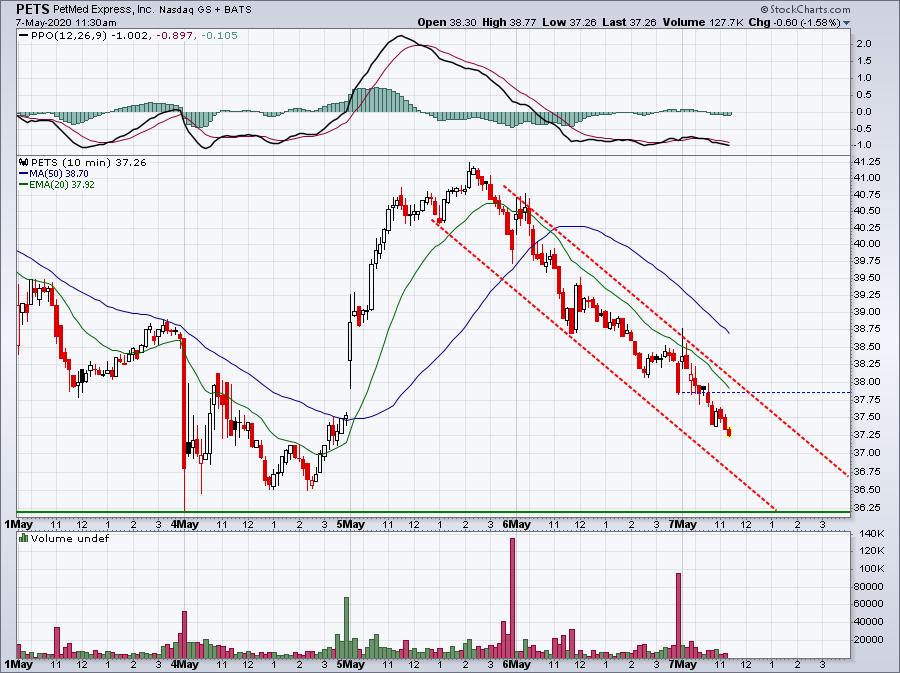
It's channeling lower and has been now for almost two days. The further it drops, the better the reward to risk scenario that unfolds. The price low from last week near 36.20 would be interesting entry, as would the rising 20 day EMA (on the first chart above), which is at 35.56.
Strong and Weak AD ChartLists
After 5 days of significant outperformance by our Strong AD ChartList stocks, they seem to be taking a breather today. However, even on poor relative performance days, I'd still feel much more comfortable trading stocks showing strong accumulation on the long side.
So I decided to run a scan against all stocks, wanting to see accumulation/distribution higher at yesterday's close than it was 1 week ago, 2 weeks ago, 4 weeks ago, 6 weeks ago, and 12 weeks ago. In other words, it's safe to assume that the AD line has consistently been rising over the past 3 months, or throughout this pandemic. I also wanted SCTR scores > 99, meaning that this should produce the strongest relative strength charts with the best AD lines. Here are the stocks that were returned:
MRNA, NEM, CCXI, MGNX, REGN, W, INO, SHOP, VAPO, PYPL, RCUS, AKBA, NOW, ADVM, KALA, TWLO, ETSY, VERI.
That's a strong group of stocks. I decided to annotate a couple charts of the lesser-known companies, companies that I haven't really discussed in the recent past.
VAPO:
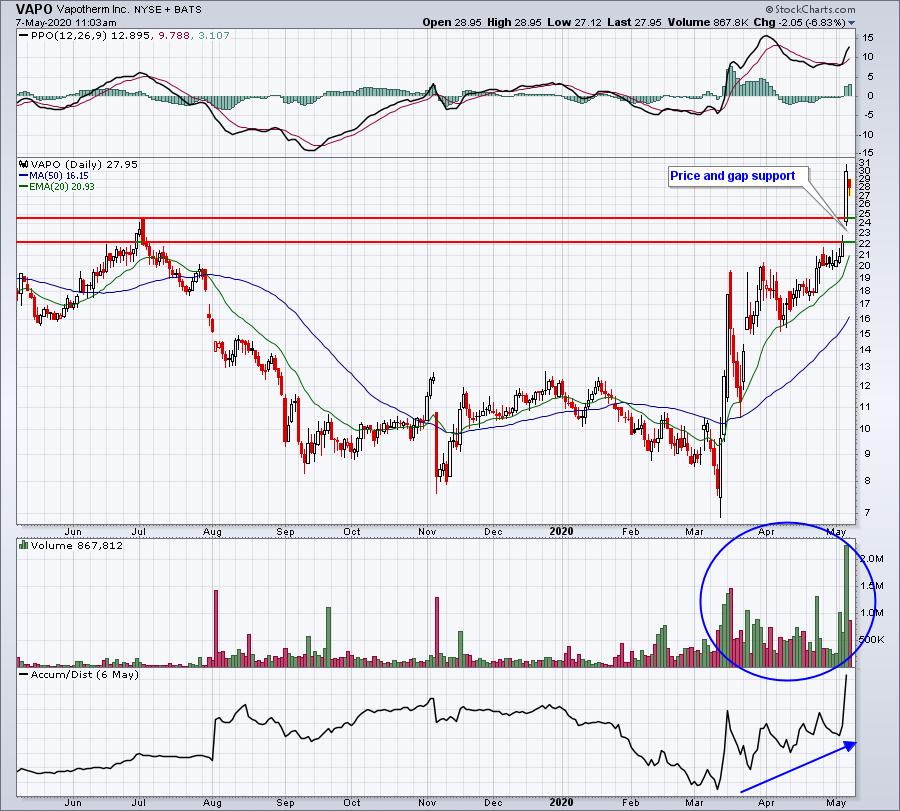
VAPO, a strong medical equipment stock ($DJUSAM), showed no early signs of reversing. Its AD line was weak in March, but it has really turned everything around since mid-March. Volume has been off the charts during this uptrend. Now I'm looking at key support being in that 22-24 area.
VERI:
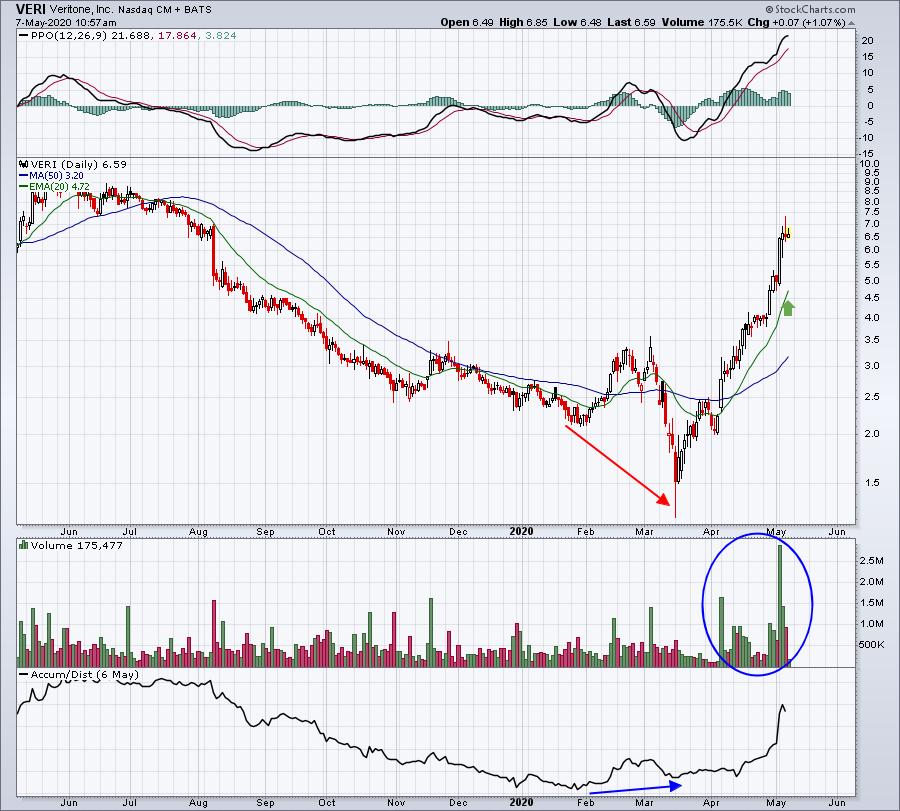
This started off like so many others. Prices moved lower in March, while the AD line printed a higher low. This is the positive divergence that Marc Chaikin referred to when he created this indicator. It signals a potential reversing signal and it's been at the heart of much of my work the past couple months. Then note the heavy volume that's accompanied this 6-7 week advance. There's clearly accumulation taking place. I'm not a fan of chasing a huge rally like this one, but a sudden pullback to test that rising 20 day EMA could be a great opportunity for traders with a big appetite for risk.
Earnings Reports
Here are the key earnings reports for today and tomorrow, featuring stocks with market caps of more than $10 billion. I also include a few select companies with market caps below $10 billion. Finally, any portfolio stocks (or active trade alerts) that will be reporting results are highlighted in BOLD. Beginning next week, I'll be placing an asterisk (*) next to stocks that are showing excellent relative strength and accumulation/distribution lines heading into their respective earnings report. In my judgment, I'd expect strong results and guidance, although correctly predicting which way a stock might gap after an earnings report is much more difficult. If you decide to hold a stock into earnings, please understand the significant short-term risk that you are taking. For this week's earnings reports, you should check out our "Q1 Earnings" webinar, where I detailed in two separate ChartLists those stocks where I'd look for good and bad quarterly earnings results. Please be sure to check for earnings dates for any companies you own or are considering owning:
Thursday, May 7:
BMY, DHR, LIN, BUD, FIS, BDX, FISV, ENB, BKNG, RTX, UBER, EQNR, DLR, BCE, ABEV, XEL, MNST, CTSH, EOG, ED, MSI, BLL, OTIS, FLT, HLT, MCHP, TU, CTVA, CNQ, ABC, MRNA, MTD, ROKU, HES, GLPG, CBRE, TTD, DISH, PODD, PBA, EPAM, LNT, BAP, MGA, QRVO, MT, TEVA, IT. Others less than $10 bil: QGEN, LYV, ZG, DBX, HST, ACAD, NET, GH, AVLR, OLED, CRL, PCTY, NWSA, NUAN, HLF, PWR, FSLR, IPHI, SRCL, AAXN, BILL, MNTA, APPN, STMP, HAIN, TDC, TRIP, JBLU, TGNA, RPD, YETI, SYNA, AAN, YELP
Friday, May 8:
EXC, PPL, CARR, BR, NMR, BIP, VTR, IEP. Others less than $10 bil: XRAY, PNW, LEA, SWCH, CRON, TWNK, BLMN
Economic Reports
Initial jobless claims: 3.17 mil (actual) vs. 3.04 mil (estimate)
Q1 productivity: -2.5% (actual) vs. -5.5% (estimate)
Happy trading!
Tom