
EB Daily Market Report - Monday, May 11, 2020
Spring Special
First, I'm sorry this DMR is coming out so late today. For newer members, I typically publish the DMR each day between 11am and 2pm EST. More often than not, it's published during the noon hour.
I will send out a few reminders over the next two weeks, but I want to make sure that all of our trial and monthly members have an opportunity to sign up for an annual membership to save a lot of money. Current annual members may also extend their membership if they'd like using our best special of the year - $697 for 14 months, so 2 additional bonus months for free if you lock in during the special. You can use the link HERE or simply write to us at "[email protected]".
Executive Market Summary
- Futures were weak this morning, but once again buyers stepped up to the plate during early action
- Currently, our major indices are higher, led by the NASDAQ
- Health care (XLV, +1.56%) and technology (XLK, +0.98%) are showing leadership, as they have throughout this crisis
- The U.S. Dollar (UUP) is higher with most commodities lower
- Crude oil ($WTIC) is down 2.25%, while gold ($GOLD) has fallen back beneath $1700 per ounce - excellent support resides near $1675
- The 10 year treasury yield ($TNX) is up 4 basis points to 0.72% and now taking aim at its 50 day SMA (0.75%), which it hasn't been above since the first week of 2020
- Biotechs ($DJUSBT, +3.06%) are having a huge day, although Cardinal Health (CAH, +6.74%), a medical supplies company ($DJUSMS) is the top S&P 500 performer on the day
Market Outlook
I absolutely believe the stock market will continue pushing higher, but short-term I have two growing concerns. First, options expire this Friday so if you're trading stocks that have considerable open option interest, I'd be more and more careful as the week wears on....and I'd definitely keep trailing stops in play. Second, as the S&P 500 attempts another breakout today, the accumulation/distribution line has been continuing to push lower. If you're more risk averse, I would definitely be building a bigger pile of cash. We could see some of the high flyers of late a bit more reasonably priced a week to ten days from now. Here's the chart showing the AD line rolling over on the SPX:
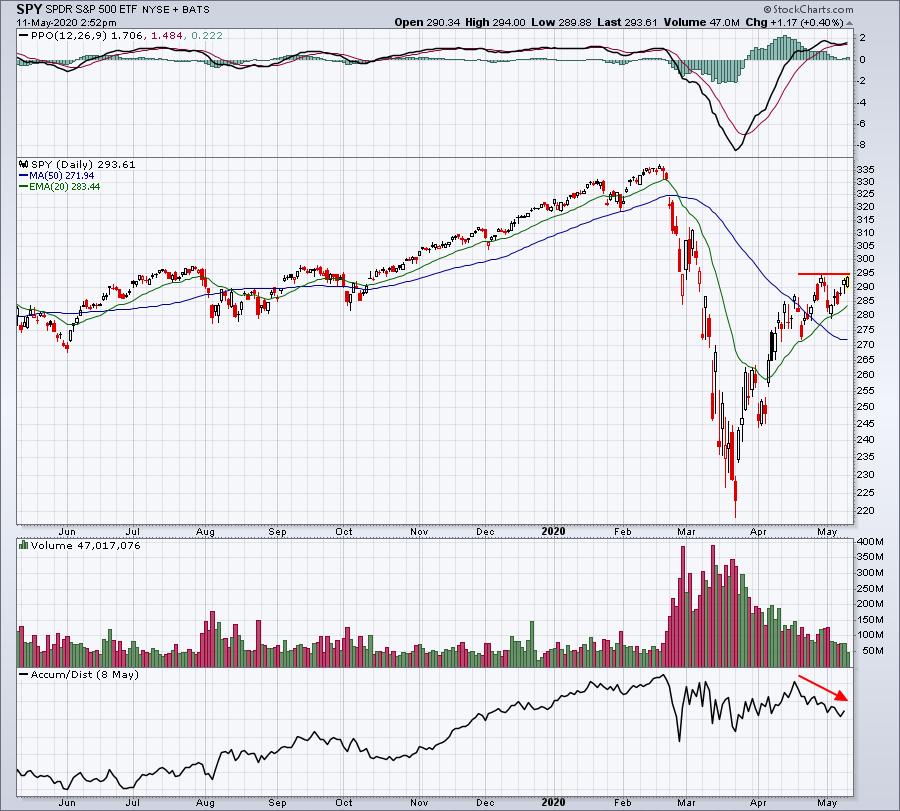
Don't misunderstand me. This isn't any sort of guarantee we're heading lower and I do remain bullish, but I'd interpret this as simply saying that risks are increasing.
Sector/Industry Focus
I continue to believe that biotechs could wind up being the best industry group over the next few years and today's breakout is only adding to that belief:
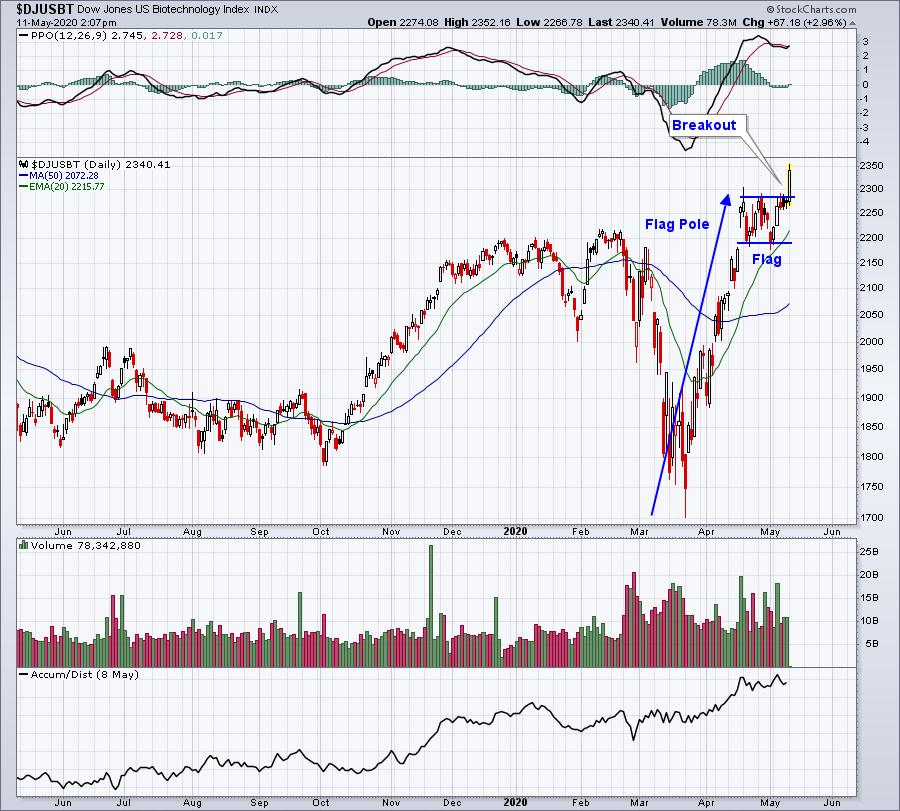
A bull flag breakout measures higher using the length of the flag pole. That's nearly 600 points to 2900, which also is the target on the following weekly chart pattern:
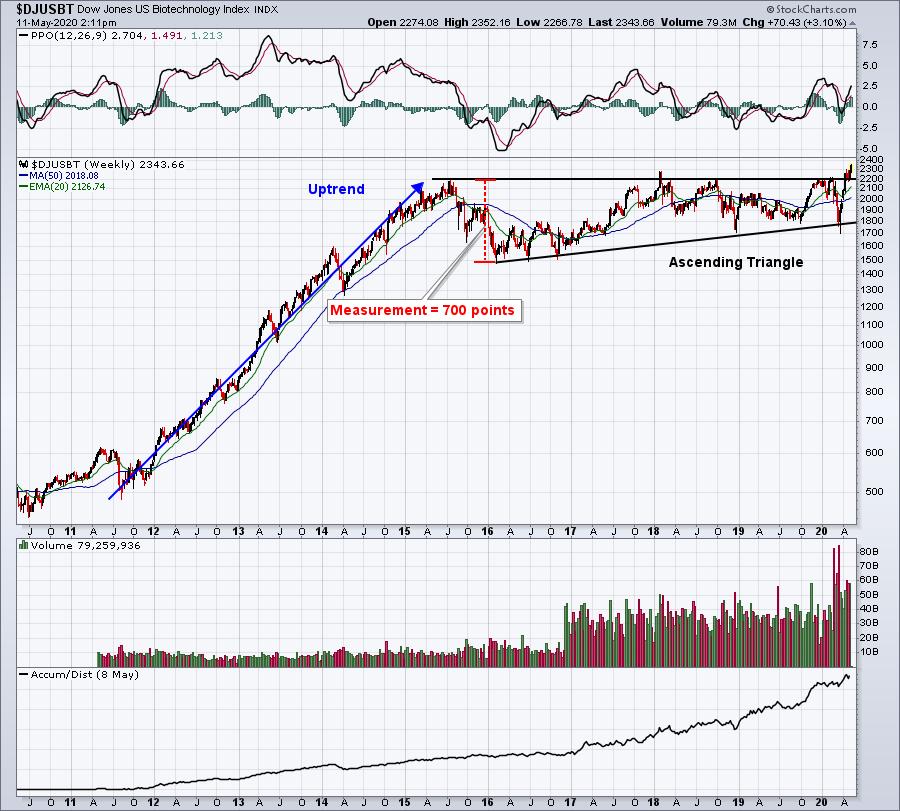
An ascending triangle measures from the price resistance (top of triangle, 0r 2200) to the initial low (1500), or 700 points. The measurement is the breakout point (2200) plus the measurement (700). That equals 2900. I rest my case.
Strong Earnings ChartList (SECL)
I should have this ChartList updated and ready for download over the next 2-3 days. It's very time consuming this time of the quarter because SO many companies have reported the past couple weeks. For the first time in awhile, however, I'm going to pass on highlighting new trade opportunities on our ChartLists as I believe risks are increasing in the very near-term.
Strong and Weak AD ChartLists
As I mentioned above, I'm going to skip potential trading opportunities today, but I do want to point out where the majority of the strength on the Strong AD ChartList is coming from. Check out today's leaders:
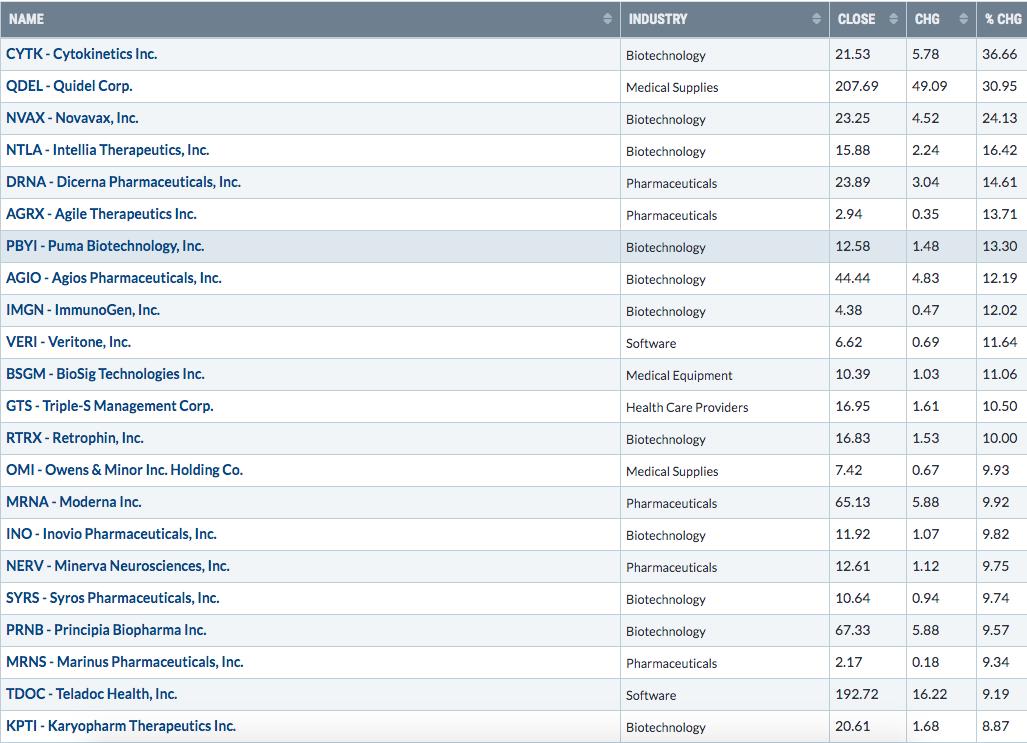
Of the top 22 performers, 20 are in health care. Of those 20, 11 are biotechs. It's fairly easy to see where Wall Street is putting its money today. Biotech remains a MUST OWN area of the market, though like other areas, it could be very risky by week's end as options expire.
Short Squeeze ChartList
We provided our EB members yet another powerful ChartList on Saturday - our Short Squeeze ChartList, which features companies that are heavily shorted. There are 143 companies on this ChartList and I'd describe the ChartList as follows:
"Charts 001-049 are listed in order of "dollar volume short". That takes the number of shares short and multiplies it times the price of the stock. TSLA had the highest "dollar volume short" at over $15 billion, while AAL had "dollar volume short" of under $1 billion. Charts 100-193 represented highest to lowest "short percentage of float", which I believe is a bit more meaningful, though both are important. Chart 100 was GME, which had a short % of float over 80%, an incredibly high number, while Chart 193 (VKTX) had a short % of float closer to 20%. Stocks on this ChartList should not be viewed as guarantees for higher future prices. Instead, it's simply being aware of high short interest in the event that a stock breaks above key resistance levels. It CAN trigger panicked buying. Always keep in mind that many of these stocks are being shorted for good reason and will likely move lower. We want to be aware, however, of a potential short squeeze and these stocks represent those more likely to trigger such an event."
My personal preference in trading many of these names would be to stick with stocks on this list that are showing solid relative strength and AD lines. To start, consider sorting this ChartList in SCTR (StockCharts Technical Rank) order, highest to lowest, as this represents a relative strength measure vs. other stocks in its asset class. Here is the current ranking for companies with SCTRs above 95:
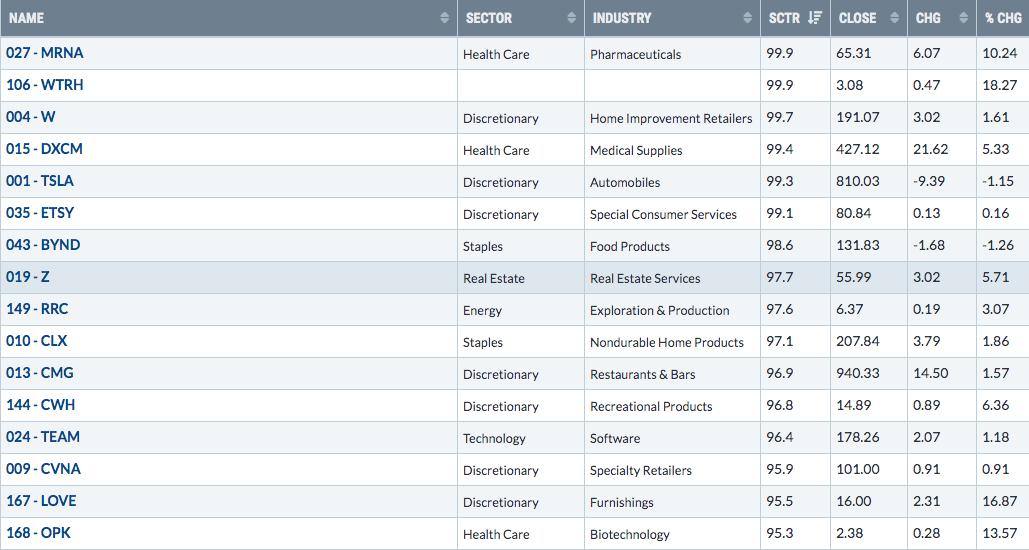
You can see that most of these stocks are higher, further pressuring short sellers to consider covering their positions, which, in turn, would send prices higher.
Earnings Reports
Here are the key earnings reports for today and tomorrow, featuring stocks with market caps of more than $10 billion. I also include a few select companies with market caps below $10 billion. Finally, any portfolio stocks (or active trade alerts) that will be reporting results are highlighted in BOLD. Beginning next week, I'll be placing an asterisk (*) next to stocks that are showing excellent relative strength and accumulation/distribution lines heading into their respective earnings report. In my judgment, I'd expect strong results and guidance, although correctly predicting which way a stock might gap after an earnings report is much more difficult. If you decide to hold a stock into earnings, please understand the significant short-term risk that you are taking. For this week's earnings reports, you should check out our "Q1 Earnings" webinar, where I detailed in two separate ChartLists those stocks where I'd look for good and bad quarterly earnings results. Please be sure to check for earnings dates for any companies you own or are considering owning:
Monday, May 11:
MAR, ZBH, ET, EC, ETR, SPG, AEE, TME, IFF, DDOG, CAH, AMCR, CABO. Others less than $10 bil: MYL, LOGI, TXG, G, CZR, ON, UAA, JCOM, COTY, AN, MIME, CDLX, NVAX, TLRY
Tuesday, May 12:
DUK, HMC, ALC, XP, BNTX. Others less than $10 bil: IR, HLI, VIR, VSH, CVLT, PGNY, EGHT, TPTX
Economic Reports
None
Happy trading!
Tom