
EB Daily Market Report - May 12, 2020
Special Event Today
I will be hosting our May "Max Pain" webinar after the market closes today at 4:30pm EST. The room should be open by 4:00pm EST. Here's a link to the room:
https://us02web.zoom.us/j/82862627947
For those unfamiliar with max pain, it relates to options expiration and the amount of open interest that exists on indices, ETFs, and stocks. While nothing in the stock market provides us guarantees, max pain is a signal that can help us understand the likely short-term direction of the market/certain stocks as we approach options expiration Friday, and the week after.
I hope you can join me!
Executive Market Summary
- Futures were weak overnight, but strengthened this morning
- U.S. indices began the day higher, but are now retreating
- Short-term warning signs are mounting, especially a key options sentiment indicator (See CPCE discussion below)
- Crude oil ($WTIC) is up nearly 7% to $25.80 per barrel
- The 10 year treasury yield ($TNX) is down 5 basis points as traders move cautiously and back into treasuries
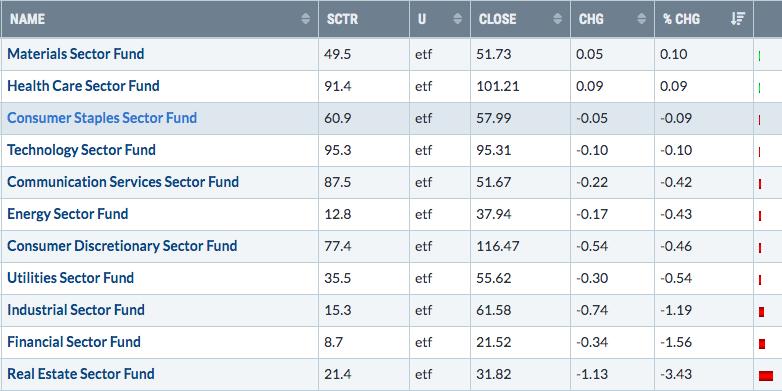
- Materials (XLB, +0.12%) and health care (XLV, +0.04%) are the only two sectors in positive territory
- Real estate (XLRE, -3.49%), financials (XLF, -1.58%), and industrials (XLI, -1.19%) are being hit the hardest
Market Outlook
I am believing that it's more and more likely that the S&P 500 will see another all-time high in 2020, possibly a lot sooner than most think possible. In the longer-term, it will be held back by some groups like airlines ($DJUSAR), but strength in key areas like technology (XLK) and health care (XLV) will easily offset that. Rising earnings with historically-low interest rates, fiscal stimulus packages, and an accommodative Fed will all send equity prices higher and I believe this scenario will launch equities for many years to come.
But let's talk about the short-term. Options expire Friday and the week of, and the week following, options expiration can be very dicey for U.S. equities. The momentum is strong to the upside right now and options expiration doesn't guarantee a big drop over the next couple weeks, but we need to be "on guard" for some selling. Trading on the long side is okay, but I'd be a little more careful, so think "smaller position sizes", tight stops, and possibly even hedging (protective puts). Yesterday, I highlighted the falling AD lines as our indices test recent highs or break out to new highs. Today, let's look at the more bullish tone in the options world (equity only put call ratio, or $CPCE). Here's a chart of the 5 day SMA of the CPCE:
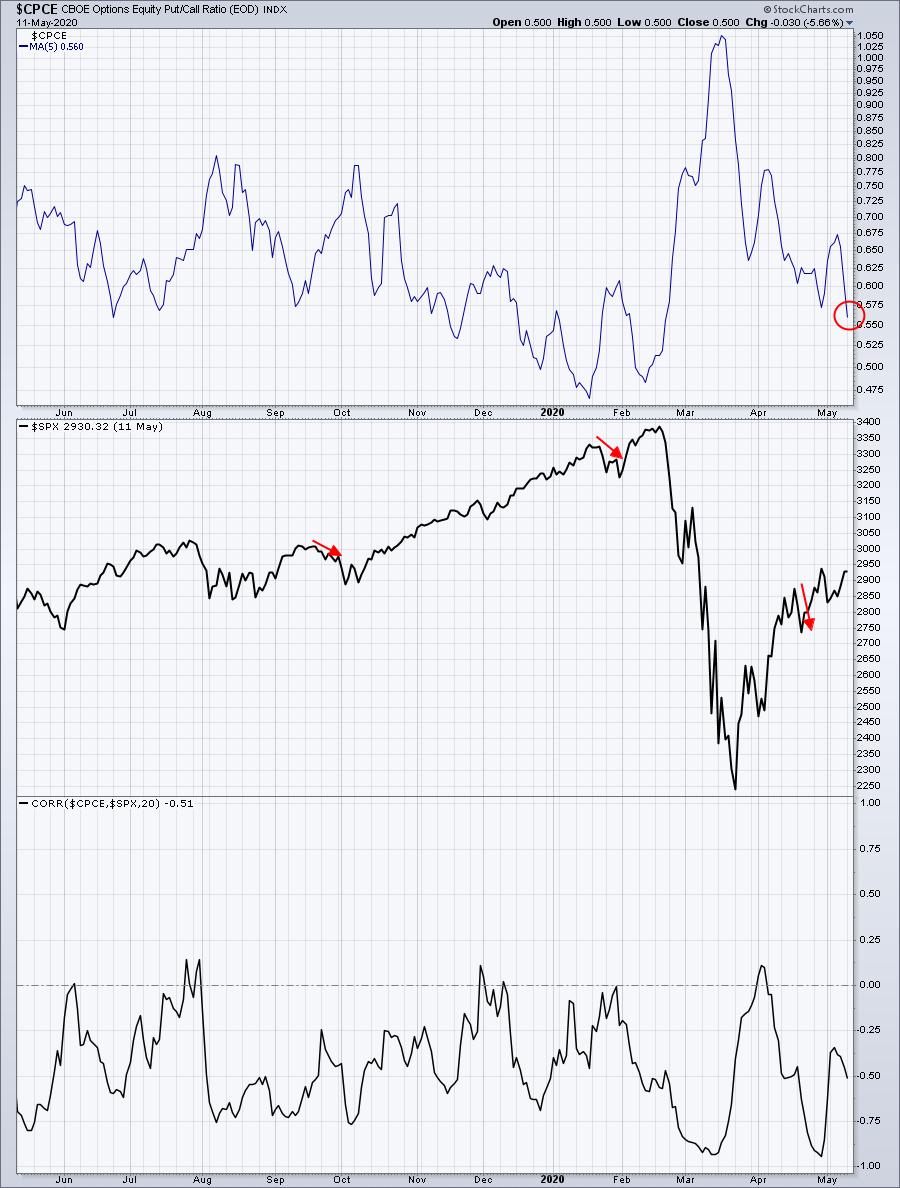
The 5 day SMA of the CPCE has fallen to its lowest level since the crisis began in late-February. That's beginning to show an excess of bullishness in the options world. This is a contrarian indicator as the correlation shows at the bottom of the chart. The CPCE and S&P 500 tend to move in opposite directions. As the CPCE nears historically key support, a bounce would likely mean a push lower in the S&P 500. This would suggest some caution as we approach the market currently.
Sector/Industry Focus
Autos ($DJUSAU) took the day off yesterday, but this is one of the strongest areas of the market today. Relative strength has improved tremendously over the past two months. TSLA's been a leading "driver" of this group and I suspect that will continue for while:
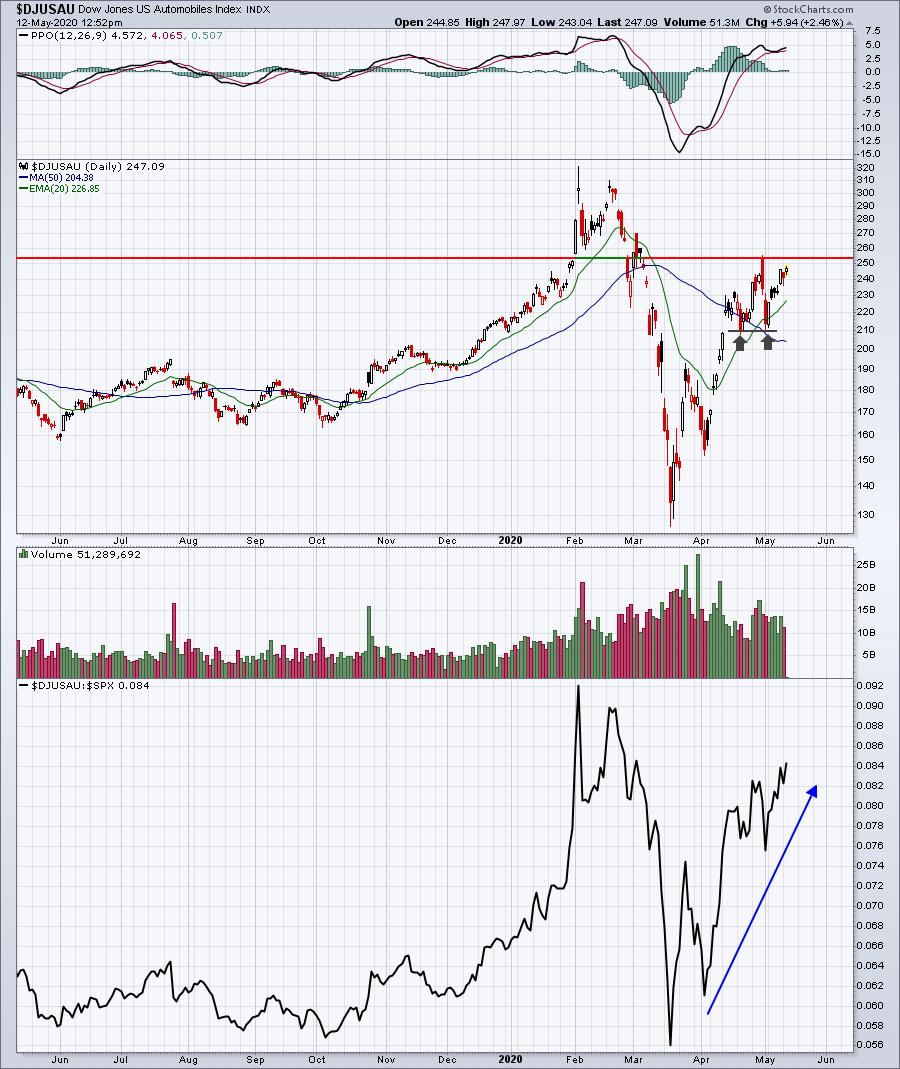
Autos have been one of the industry groups that's helped to turn around the consumer discretionary sector (XLY).
Strong Earnings ChartList (SECL)
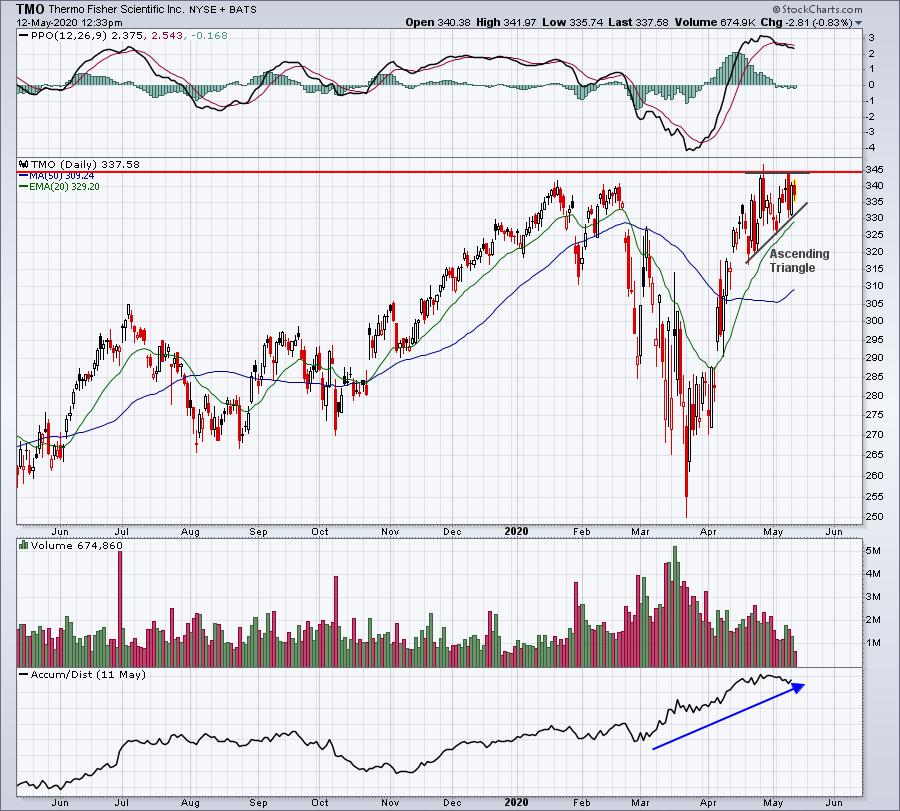
I'm watching two stocks that recently reported excellent quarterly results for a breakout:
TMO:
VRSN:
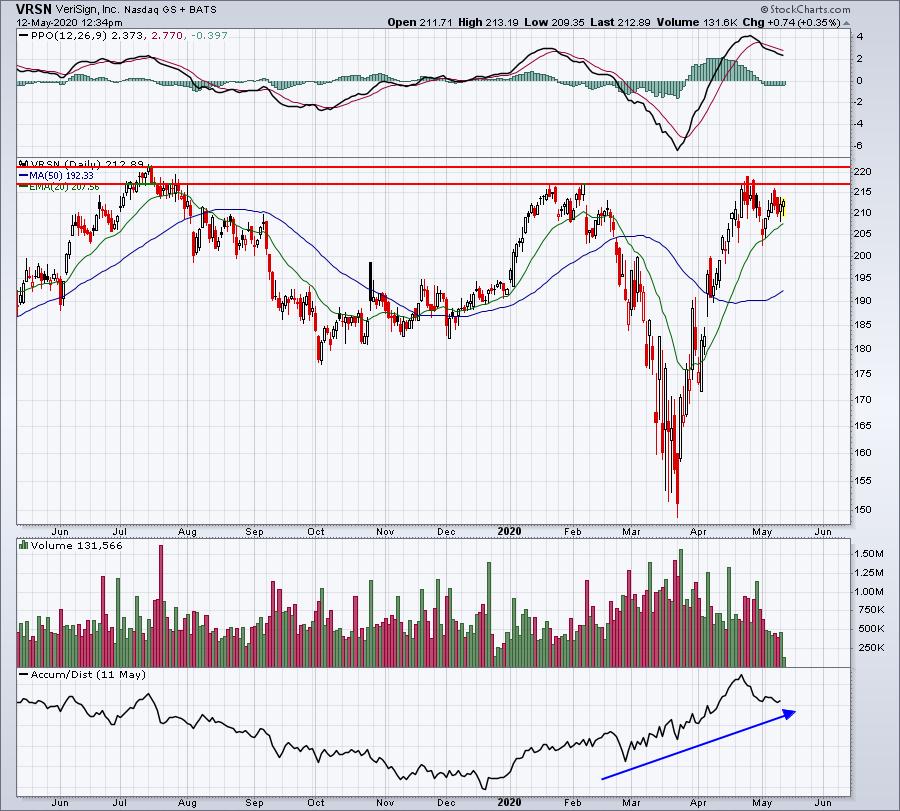
Both of these charts are on the verge of breakouts and both have strong AD lines. I believe it's only a matter of time before we see breakouts. In the meantime, consider rising 20 day EMAs as potential entry areas on any short-term selling.
Strong and Weak AD ChartLists
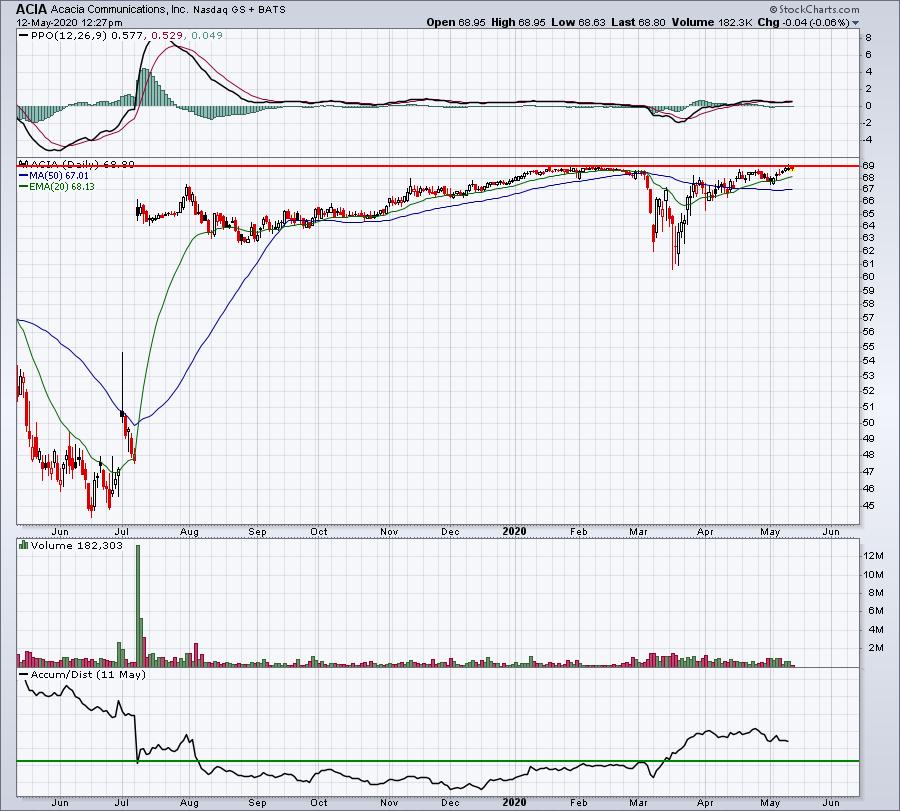
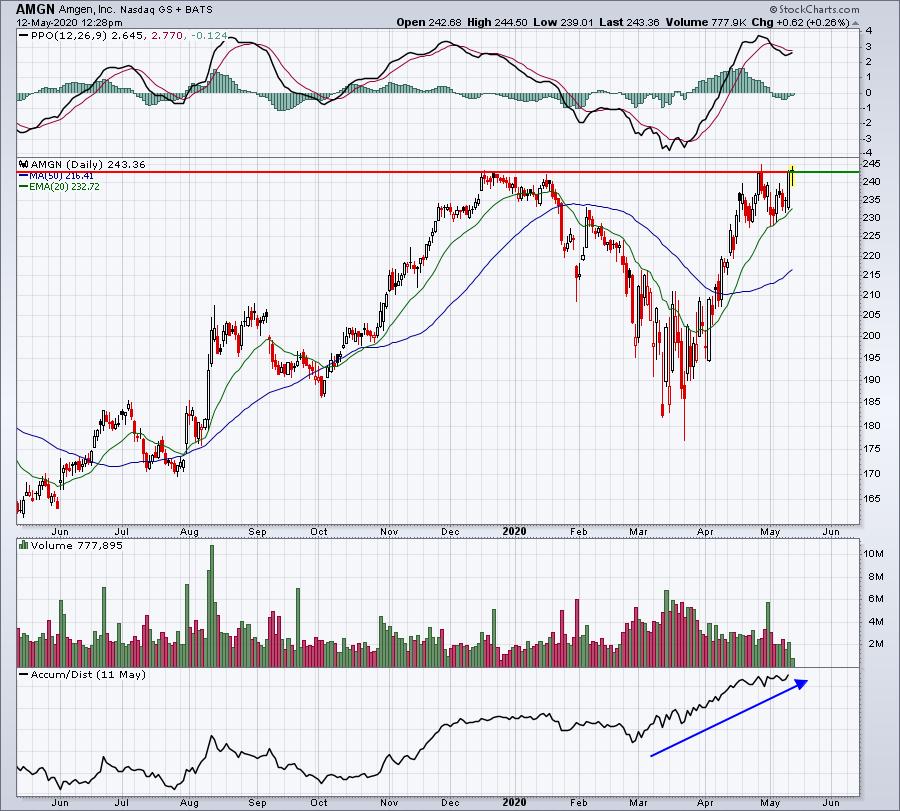
Health care stocks (XLV) on our Strong AD ChartList are again having a powerful session, but the entire ChartList is crushing the Weak AD ChartList. After using the CandleGlance charts to quickly find interesting candidates, here are two to keep a close eye on:
ACIA:
AMGN:
PODD:
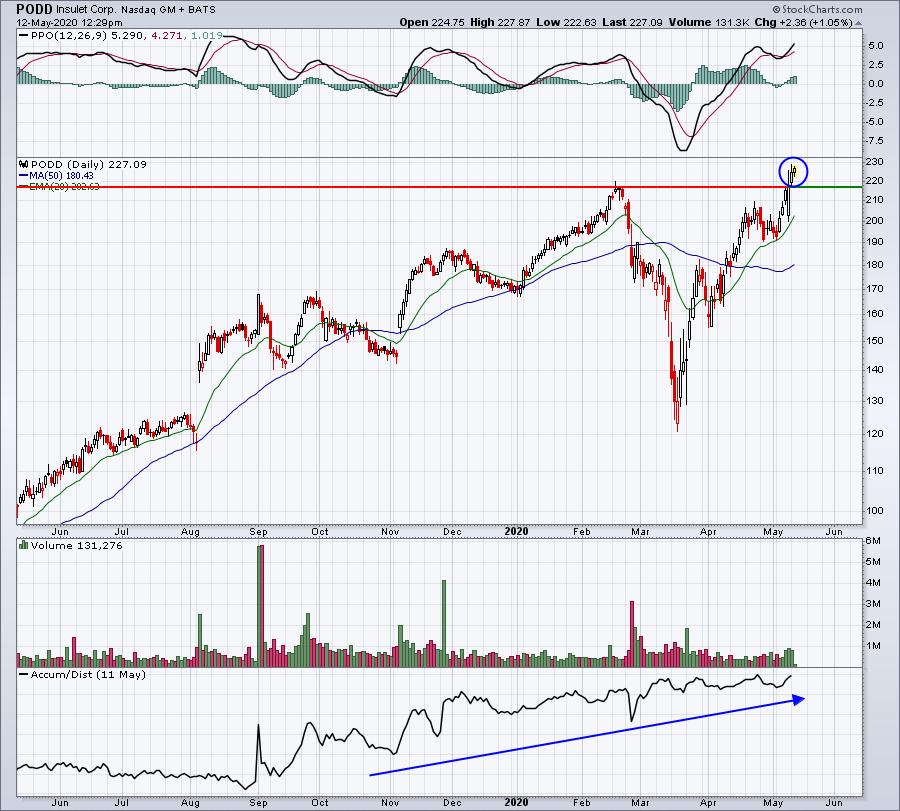
While ACIA and AMGN are on the verge of breakouts, PODD has just made a breakout. AMGN looks particularly attractive to me as it's part of the very strong biotech industry ($DJUSBT).
Short Squeeze ChartList
BYND is on our ChartList and it's moving to a 7-month high. Volume has been picking up, so this one is certainly a solid candidate for panicked shorts adding to the recent buying frenzy:
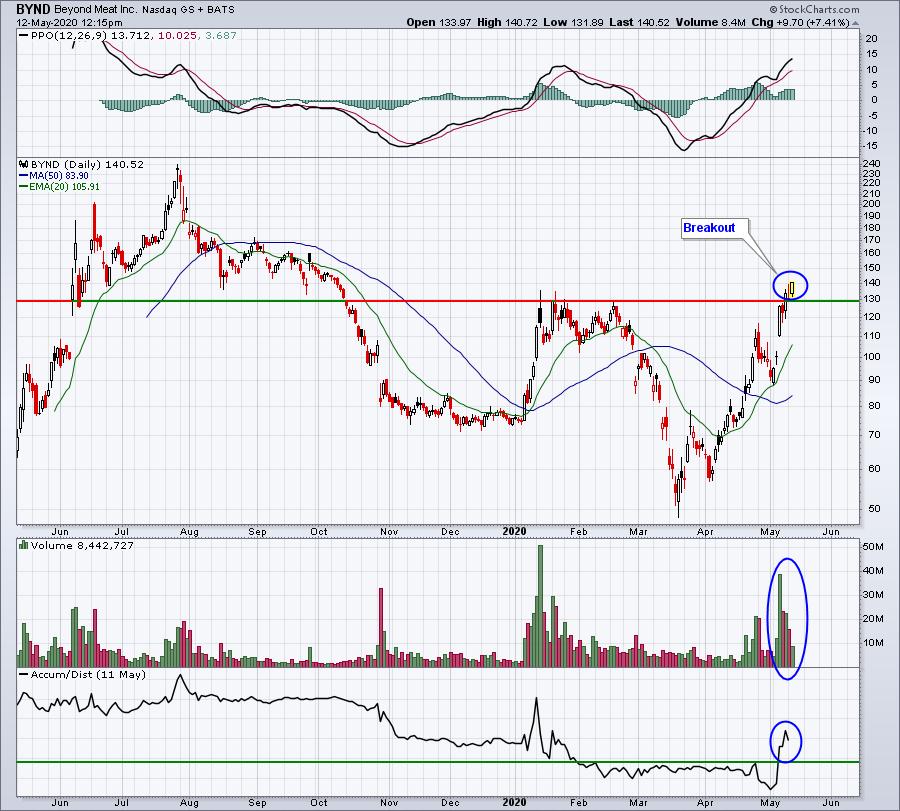
Short-term price support would now be around 129, which represents the level of the latest price breakout. I wouldn't be surprised to see shorts drive the price even higher, but it has moved a lot recently.
Earnings Reports
Here are the key earnings reports for today and tomorrow, featuring stocks with market caps of more than $10 billion. I also include a few select companies with market caps below $10 billion. Finally, any portfolio stocks (or active trade alerts) that will be reporting results are highlighted in BOLD. If you decide to hold a stock into earnings, please understand the significant short-term risk that you are taking. Please be sure to check for earnings dates for any companies you own or are considering owning:
Tuesday, May 12:
DUK, HMC, ALC, XP, BNTX. Others less than $10 bil: IR, HLI, VIR, VSH, CVLT, PGNY, EGHT, TPTX
Wednesday, May 13:
CSCO, SNE, STE. Others less than $10 bil: FLO, CYBR, TSEM, JACK, VRTU
Economic Reports
April CPI: -0.8% (actual) vs. -0.8% (estimate)
April Core CPI: -0.4% (actual) vs. -0.2% (estimate)
Happy trading!
Tom