
EB Daily Market Report - Wednesday, May 13, 2020
Executive Market Summary
- Futures were initially weak, but recovered and the NASDAQ, in particular, started the day quite strong
- Asian markets were mixed and mostly flat overnight
- European markets were hit hard as the German DAX ($DAX) fell more than 2.5%
- After the NASDAQ tested its key 20 hour EMA in early trading, the market's wheels fell off
- Significant selling pressure came in various forms, but energy (XLE) and financials (XLF) were very weak
- The 10 year treasury yield ($TNX) fell 5 basis points to 0.64% after PPI came in well below expectations
- Cisco Systems (CSCO) will reports its latest results after the bell today; Applied Materials (AMAT) is on deck as they'll report tomorrow after the bell
Market Outlook
During yesterday's May max pain webinar, I discussed the possibility that we'd see early strength today to perhaps test the declining 20 hour EMA. After impulsive bouts of selling, this test is not unusual at all. But the question was......how would the market react on that test? Well, I think our question was answered rather emphatically:
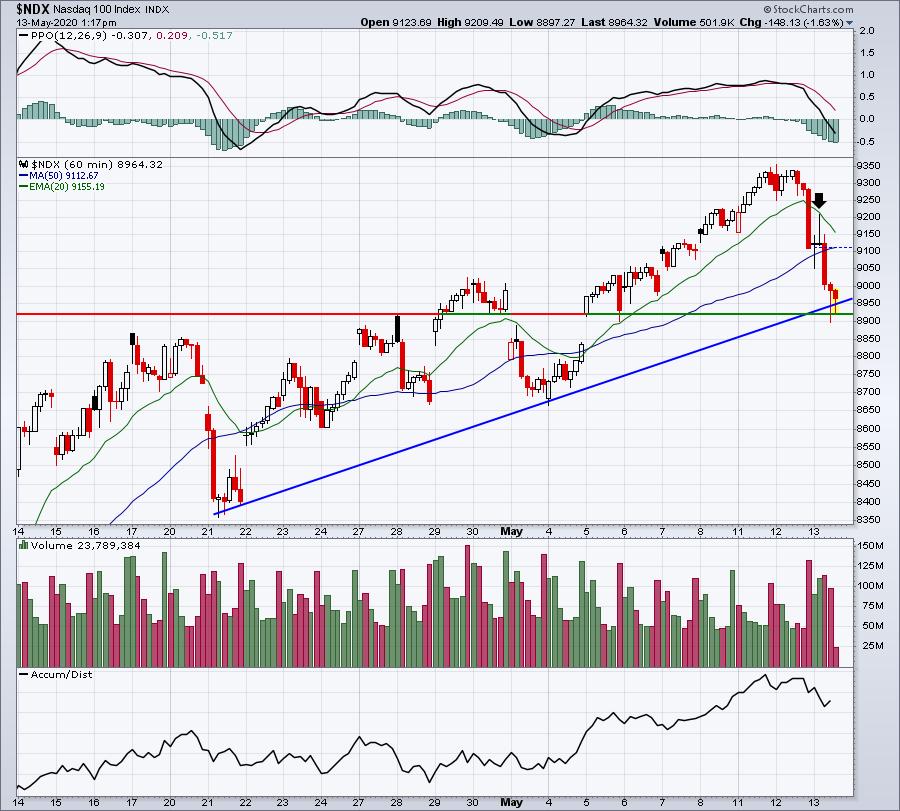
But now the question becomes....does gap and trendline support hold? If not, there's a very good chance we could see more selling to reach max pain on the QQQ (ETF that tracks the NDX). Max pain on the QQQ currently resides near 210.25. At last check, the QQQ traded at 218.62. That would suggest another 4% downside if the above support doesn't hold.
Sector/Industry Focus
Here's how the weakness today is shaping up among sectors:
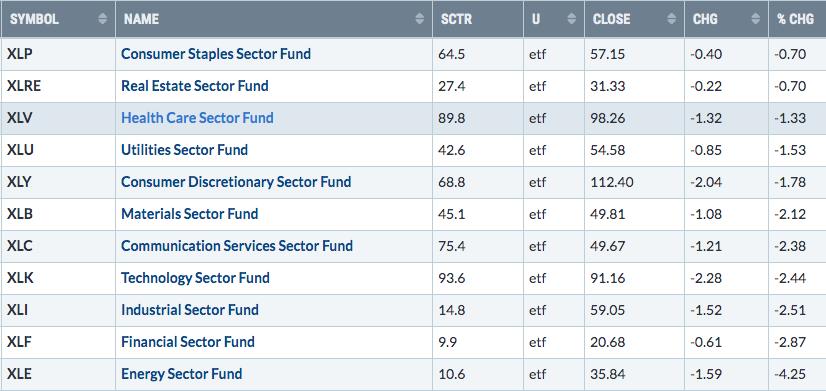
Energy, financials, and industrials are once again lagging, further underscoring the reason why we want to stay away. Health care (XLV), one of the best sectors in 2020, has held up fairly well, although health care providers ($DJUSHP) are lower by 3.28%.
Strong Earnings ChartList (SECL)
Currently, the stock market isn't concerned with great earnings. The more immediate concern is options expiration. So I'm not looking to add anything other than perhaps very short-term options-related trades. The SECL has 112 stocks on it and only 5 are up more than 1% today. It's just not worth trying to trade against the grain of the market.
Strong and Weak AD ChartLists
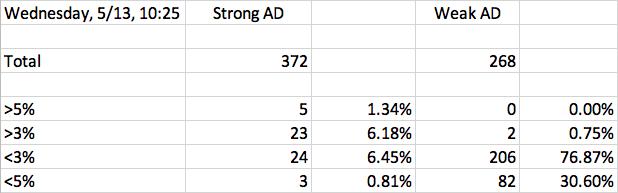
At 10:25am EST, I categorized all of the stocks in these two ChartLists as follows:
At 1:00pm EST, I did the same analysis:
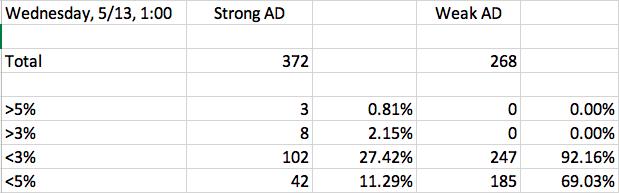
If this doesn't illustrate how Wall Street is approaching various areas of the stock market, then I don't know what does. As the market fell precipitously in late morning action/early afternoon action, the Strong AD ChartList saw 27% of its stocks drop more than 3%. The Weak AD ChartList, by contrast, had 92% (!!!) of its stocks dropping more than 3%. 44, or 16.42%, of the Weak AD ChartList fell more than 9%!!!!
We'll continue to stick with these two ChartLists and the theory behind them until the market proves to us otherwise.
Short Squeeze ChartList
I wouldn't work with this ChartList in the very near-term, at least not until after options play out. It'll be difficult for short squeezes to work well in this environment of stocks being manipulated lower by market makers.
Earnings Reports
Here are the key earnings reports for today and tomorrow, featuring stocks with market caps of more than $10 billion. I also include a few select companies with market caps below $10 billion. Finally, any portfolio stocks (or active trade alerts) that will be reporting results are highlighted in BOLD. If you decide to hold a stock into earnings, please understand the significant short-term risk that you are taking. Please be sure to check for earnings dates for any companies you own or are considering owning:
Wednesday, May 13:
CSCO, SNE, STE. Others less than $10 bil: FLO, CYBR, TSEM, JACK, VRTU
Thursday, May 14:
BAM, AMAT, PBR, NLOK, NICE. Others less than $10 bil. WIX, MLCO, FTCH, NCLH, VNET
Economic Reports
April PPI: -1.3% (actual) vs. -0.5% (estimate)
April Core PPI: -0.3% (actual) vs. -0.1% (estimate)
Happy trading!
Tom