
EB Daily Market Report - Thursday, May 14, 2020
Early Edition
I'll be out much of today, so I wanted to get this DMR out early.
Executive Market Summary
- Futures were weak and we've just seen our major indices lose roughly 1% at the opening bell, with the NASDAQ leading on a relative basis
- Initial action also shows that Wall Street is favoring consumer staples (XLP), health care (XLV) and technology (XLK) on a relative basis
- Energy (XLE) is lagging, along with materials (XLB) and financials (XLF)
- Commodities, overall, are higher with both crude oil ($WTIC) and gold ($GOLD) gaining ground in early trading
- The 10 year treasury yield ($TNX) is down 3 basis points to 2.62%, adding to the woes in financials
- Asia was weak overnight and Europe's losses are in the 2% to 3% range, which will likely add to the bearishness today in U.S. stocks
Market Outlook
At some point, we're going to see a selloff in software ($DJUSSW). It's hard to predict when, but it's becoming a very crowded trade with most software companies ignoring everything going on around them:
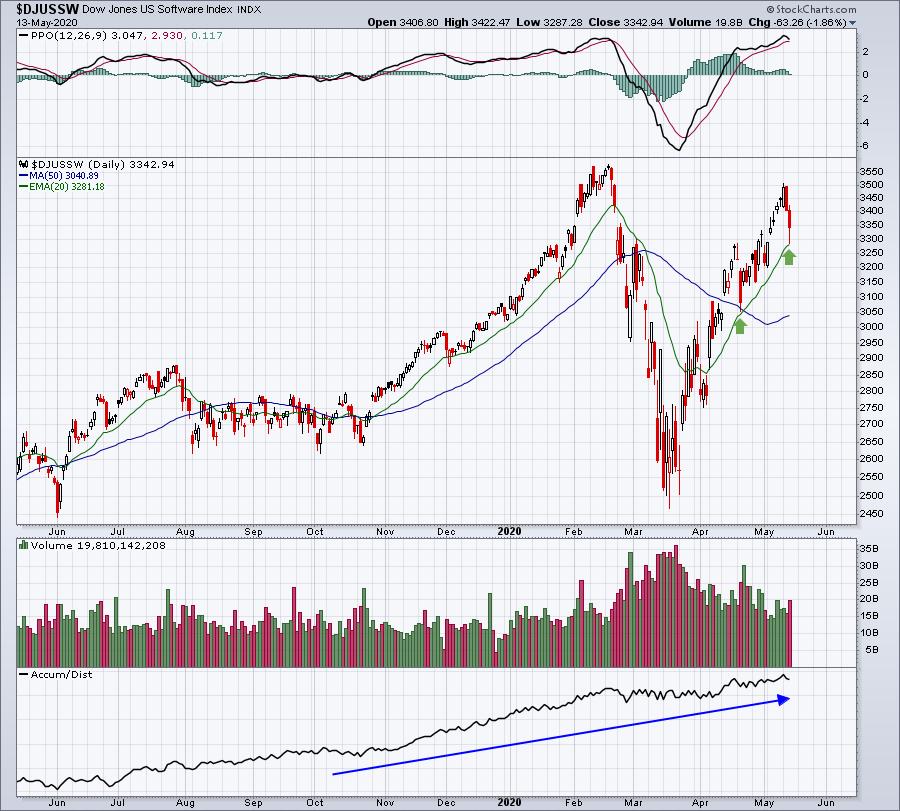
20 day EMA tests are generally solid support, so be much more cautious if you see the DJUSSW close beneath that moving average.
Sector/Industry Focus
Here's how the sector action finished yesterday:
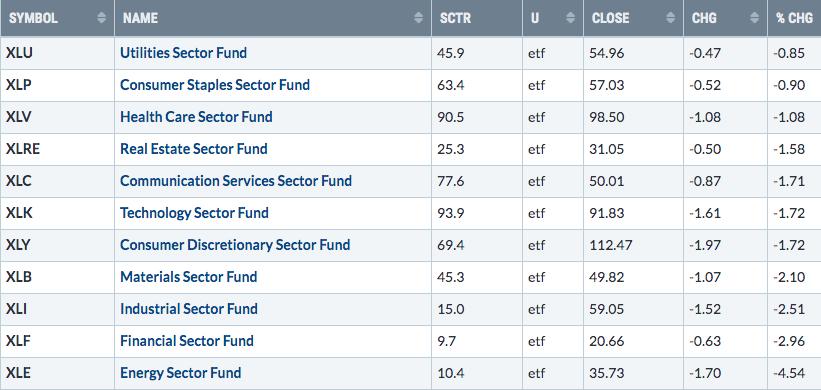
Health care (XLV) and technology (XLK) both held up fairly well and check out their SCTR scores. They're easily the two highest.
ChartLists
I reviewed hundreds of charts on our Strong Earnings ChartList, Strong AD ChartList, Weak AD ChartList, and Short Squeeze Chart List. I wanted to pinpoint the types of companies that I'd consider trading. Before I show you a few charts, I wanted to reiterate the way the Strong AD and Weak AD ChartLists behaved yesterday. In Wednesday's DMR, I showed performance in each of these ChartLists broken down into 4 categories - stocks gaining 5% or more, stocks gaining 3% or more, stocks losing 3% or more, and stocks losing 5% or more. I had a couple members write to me saying they were confused as to my tables, which was understandable since I didn't specify "stocks gaining" or "stocks losing" on my table. I knew what it meant and I've been working with it so long that I didn't think to further clarify my table. So let me recap what transpired on Wednesday, adding a couple more categories and with more descriptive titles:
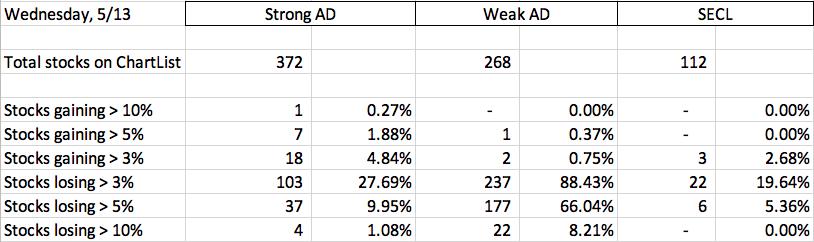
This table shows us that our odds of successfully trading healthy stocks on the long side is much, much better than trying to catch bottoms on unhealthy stocks (Weak AD ChartList). 88% of the 268 Weak AD Charts lost more than 3% yesterday, while only 27% did so on the Strong AD ChartList. That's a huge disparity. Wall Street continues to rotate out of companies that will be hurt by this pandemic, while moving into those companies that will benefit. That's what all of this work is telling us quite clearly.
Therefore, on the long side, stick with healthy companies on our Strong AD and Strong Earnings ChartLists. There'll be days when these two ChartLists will underperform, but I expect we'll see far more days where they outperform. Also, stick with clearly identifiable stops close to buy points on ANY stock that you trade in this increasingly volatile market. Remember, many of the stocks on these two lists, particularly the Strong AD ChartList, tend to recover from early morning weakness (that's the definition of strong accumulation/distribution). Here are a couple examples:
VRSK (Strong Earnings CL):
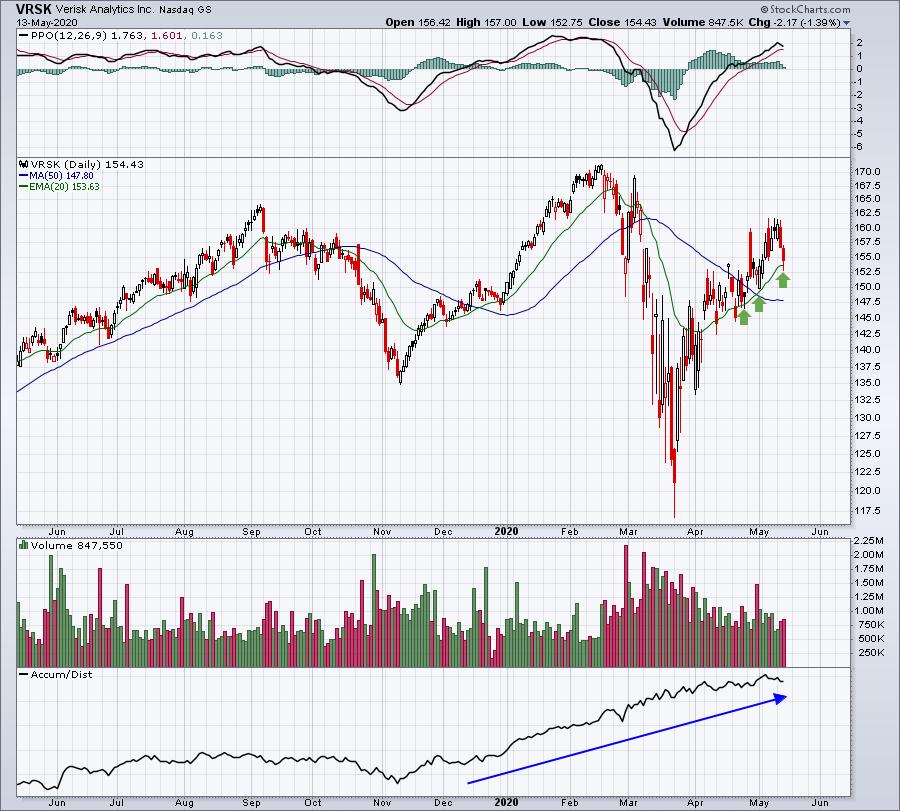
We're testing the 20 day EMA, so early weakness could be an opportunity here. The AD line has been exceptionally strong.
DGX (Strong Earnings CL):
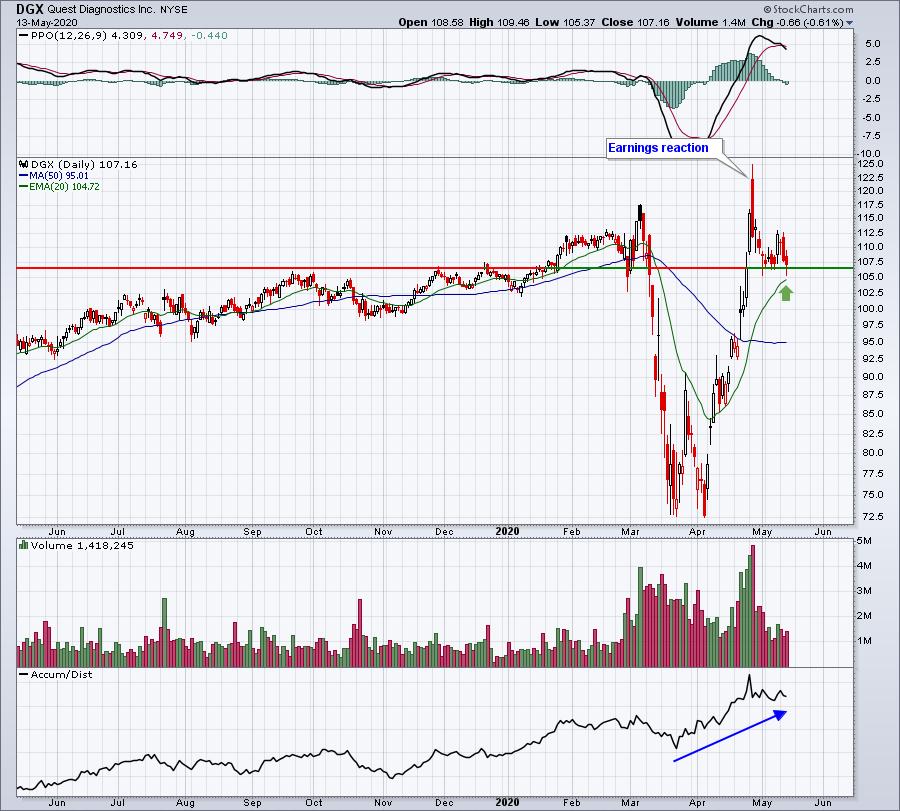
Buy on rumor, sell on news. That's what happened here. DGX was expected to have strong results based on its pre-earnings advance. They reported great results and the saw a big gap higher. Then the selling kicked in. It's now approaching decent price support and its 20 day EMA. A rebound soon is what I'd expect.
NET (Strong AD CL):
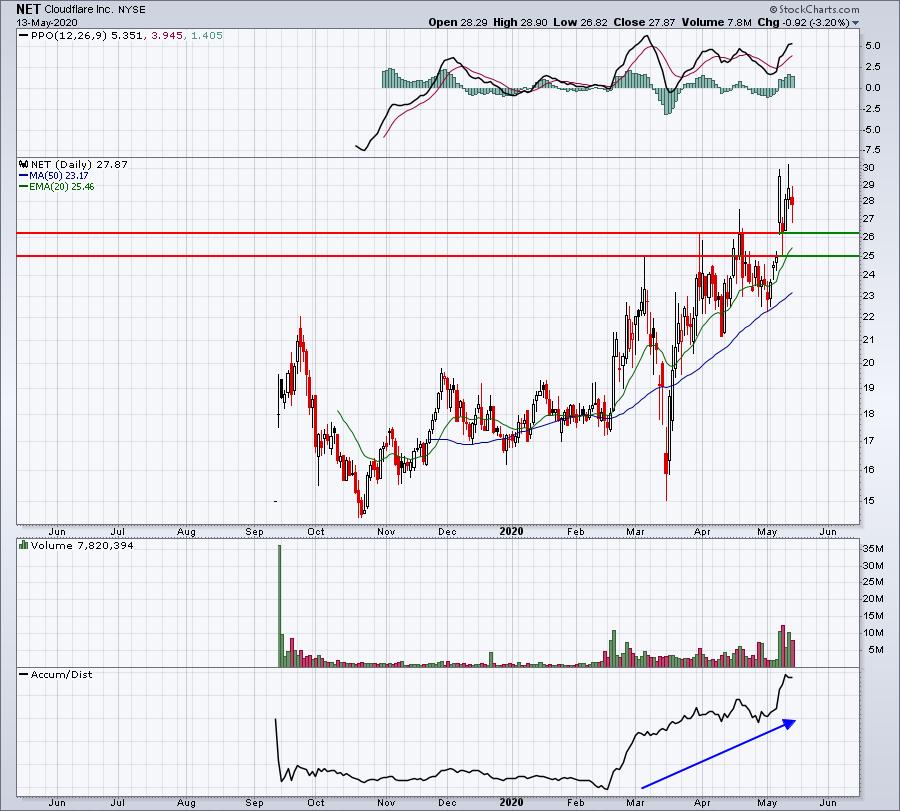
NET has been an absolute monster with increasing volume and a soaring AD line. It's volatile, so clearly not for everyone, but if you've got the stomach for it, I like NET on weakness.
Earnings Reports
Here are the key earnings reports for today and tomorrow, featuring stocks with market caps of more than $10 billion. I also include a few select companies with market caps below $10 billion. Finally, any portfolio stocks (or active trade alerts) that will be reporting results are highlighted in BOLD. If you decide to hold a stock into earnings, please understand the significant short-term risk that you are taking. Please be sure to check for earnings dates for any companies you own or are considering owning:
Thursday, May 14:
BAM, AMAT, PBR, NLOK, NICE. Others less than $10 bil. WIX, MLCO, FTCH, NCLH, VNET
Friday, May 15:
JD, VFC
Economic Reports
Initial jobless claims: 2.98 mil (actual) vs. 2.5 mil (estimate)
Happy trading!
Tom