
EB Daily Market Report - May 21, 2020
WAR Room - Friday, May 22nd, 10:00am ET
We are moving our final WAR Room meeting from Saturday to Friday this week to allow us, and all of you, time to relax and enjoy the extended Memorial Day holiday weekend here in the U.S. The topic on Friday will be "Scanning Our ChartLists". Invite your family and friends to join us as we'll make this one open to the public. Room instructions will be posted on our website, but also sent out via Friday's EB Digest article. So invite everyone you know to join our free EB Digest newsletter (sign up is on our home page) and they'll receive room instructions for Friday as well.
These WAR room sessions were designed to provide us all something constructive to do while we were under stay-at-home orders. In addition to the health scare, which is ongoing, it was also a time to bring our EarningsBeats.com community together to battle the fear associated with the stock market decline. While we at EarningsBeats.com can't do much about the pandemic, except to pray for everyone's health and safety, there's a bunch we can do to help everyone throughout a period of intense financial fear and panic. We hope that we've helped in that regard.
Prior to the pandemic, we did occasionally host Friday webinars and we've had guests join us for those events from time to time as well. We'll no doubt have a Friday webinar periodically throughout the summer and we'll keep you posted in advance for dates and times.
Executive Market Summary
- Futures are currently lower, albeit fractionally, with the DIA (ETF that tracks Dow Jones) down 0.08% as of 8:45am ET
- Initial jobless claims were down from last week, but still higher than expected
- Gold ($GOLD) is down $11 per ounce to $1741, while crude oil ($WTIC) is staging another rally, up 2.96%
- The 10 year treasury yield ($TNX) is lower by another basis point to 0.67%, unable to hold above its 50 day SMA from Monday's surge higher
- Retailers will be in focus after earnings reports from Best Buy (BBY), BJ's Wholesale Club (BJ), and TJX Companies (TJX) this morning; L Brands (LB) reported after the close on Wednesday
Market Outlook
I know small caps ($SML) have lagged on a relative basis, and I'd love to see that change later this year, but the group does appear to be uptrending. Should that trend continue, the following is a chart that you might want to follow:
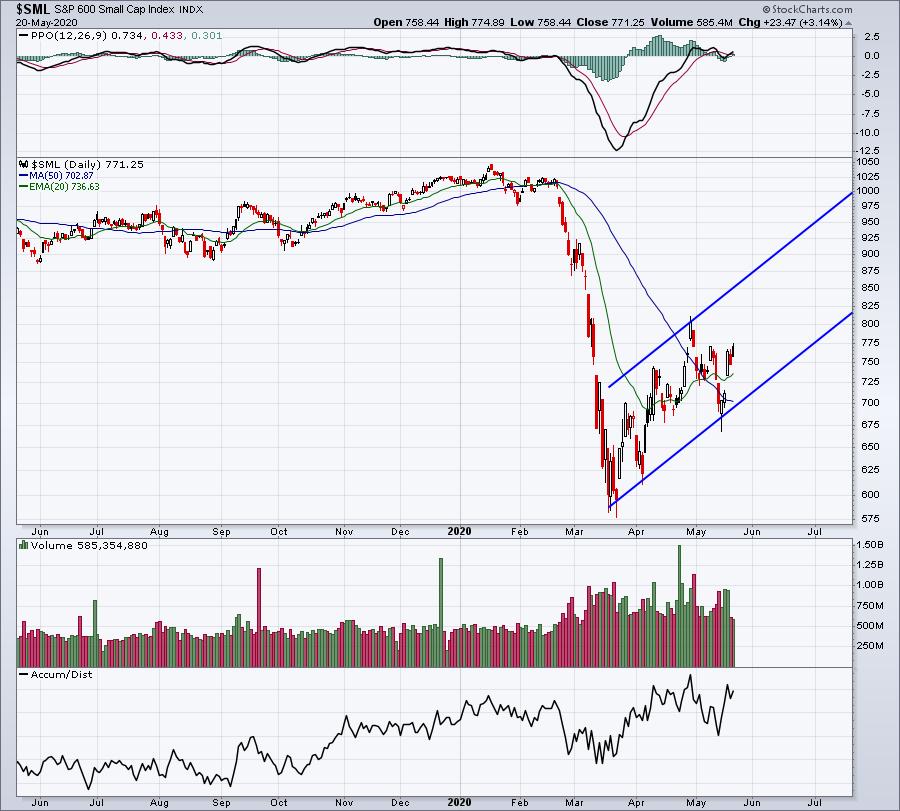
We could be in a channel that provides exceptional setup opportunities throughout the second half of 2020. Look under ChartLists below for a quick glance at some of the best performing small cap stocks on our Strong Earnings ChartList (SECL).
Sector/Industry Focus
Health care (XLV) was the worst performing sector on a relative basis yesterday. Don't confuse poor relative strength with meaningful consolidation. The XLV led this rally off the March 23rd lows and is entitled to a breather once in awhile. When we see a breakout on an absolute basis, that's when we'll also likely see relative strength return:
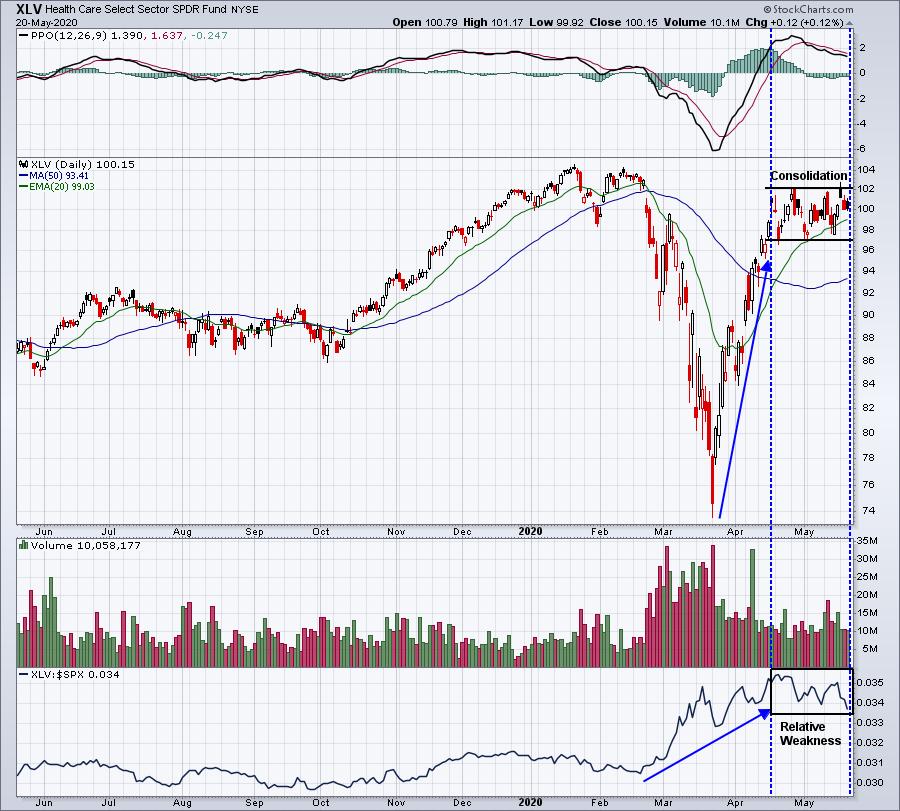
As a short-term trader, it gets frustrating sometimes if you own health care stocks, the market rallies, and you don't participate. That happens frequently during periods of consolidation. Most unsuccessful traders struggle because they always wait to chase a rally. In the case of health care, I think it makes sense to accumulate stocks in this sector that are pulling back during this phase of consolidation.
ChartLists
The two themes above are small caps ($SML) and health care (XLV). So what if we look at Strong Earnings ChartList stocks that represent both and have pulled back, perhaps with a SCTR score between 70-95? Here's the group that fits this mold:
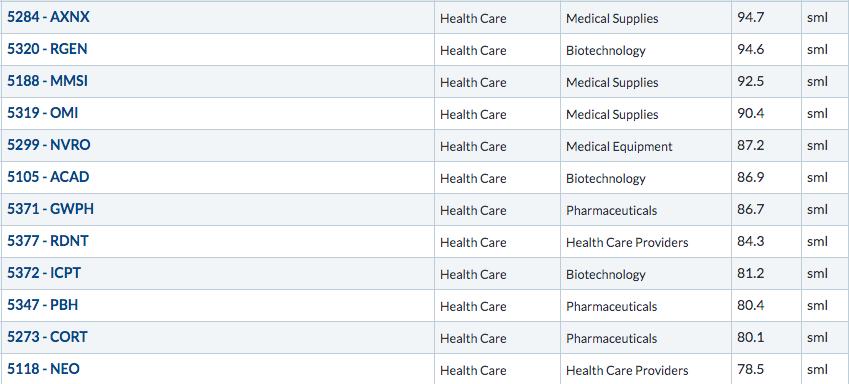
I like the stocks on this list, but here are the stocks to perhaps focus on TODAY:
MMSI:
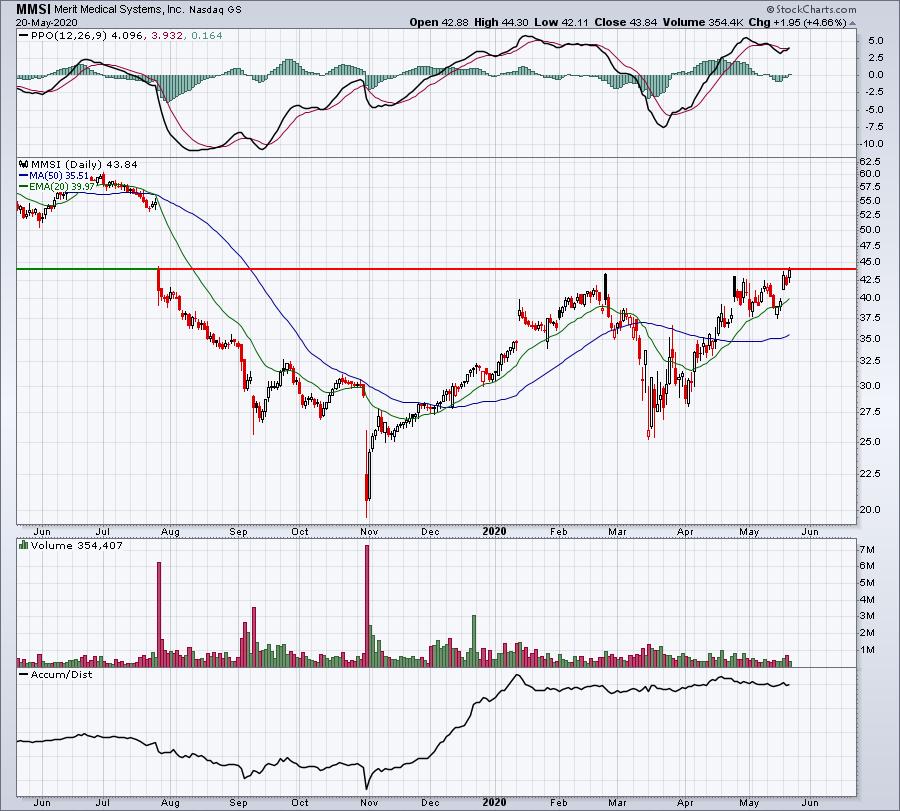
This is a MAJOR level of price resistance. If MMSI breaks out, it could FLY. But.....if you see a failed breakout attempt (long tail to the upside above resistance with a close beneath), I'd make sure I took a small loss and exited quickly.
OMI:
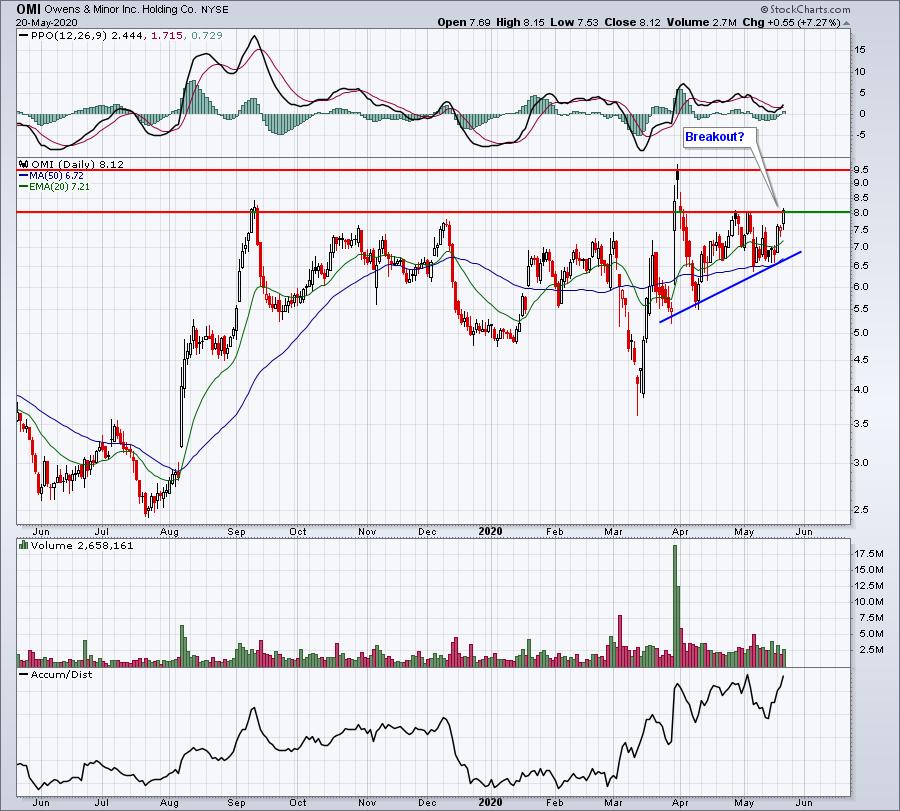
Recent closing price resistance was at 8.03. Yesterday, we managed to close above it at 8.12. I wouldn't be surprised to see technical buyers jump on board here and take OMI to 9.48 resistance, March 31st's opening price.
ACAD:
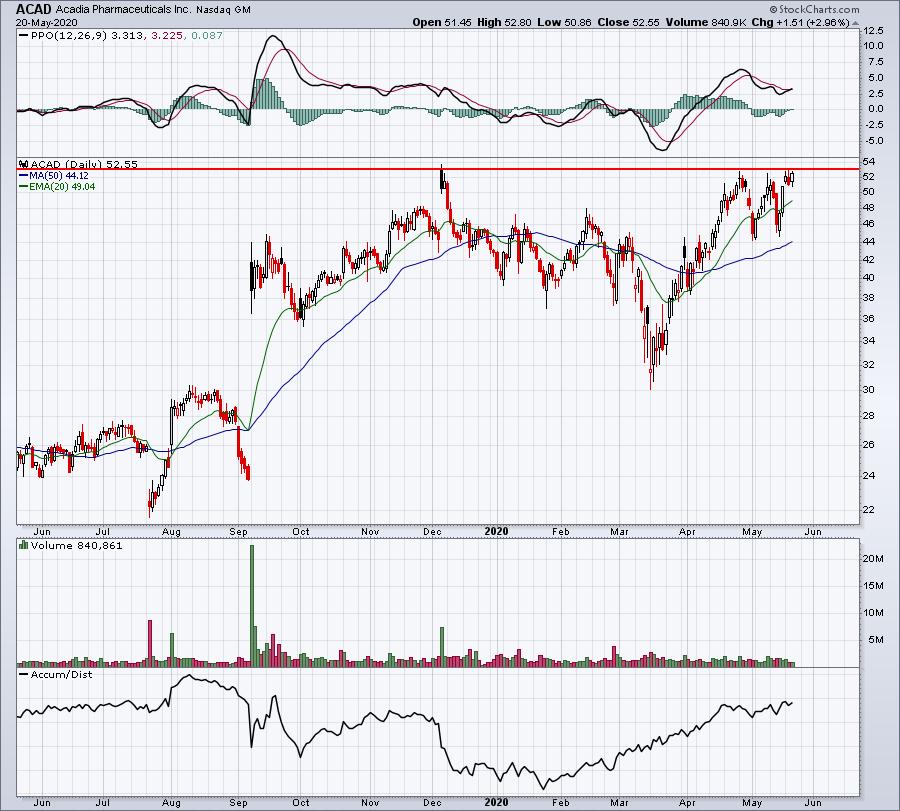
I think key price resistance is pretty clear here. 52.98 was the opening price on December 5, 2019. We haven't been able to close above that level since, although Tuesday's intraday high reached 53.13. Another move above 53.13 would be an interesting opportunity to potentially catch a breakout. An opening price above 52.98 would give me more confidence on this trade. Like MMSI, however, be careful on a failed breakout attempt. It could result in one more 20 day EMA test for market makers to gather more shares.
ICPT:
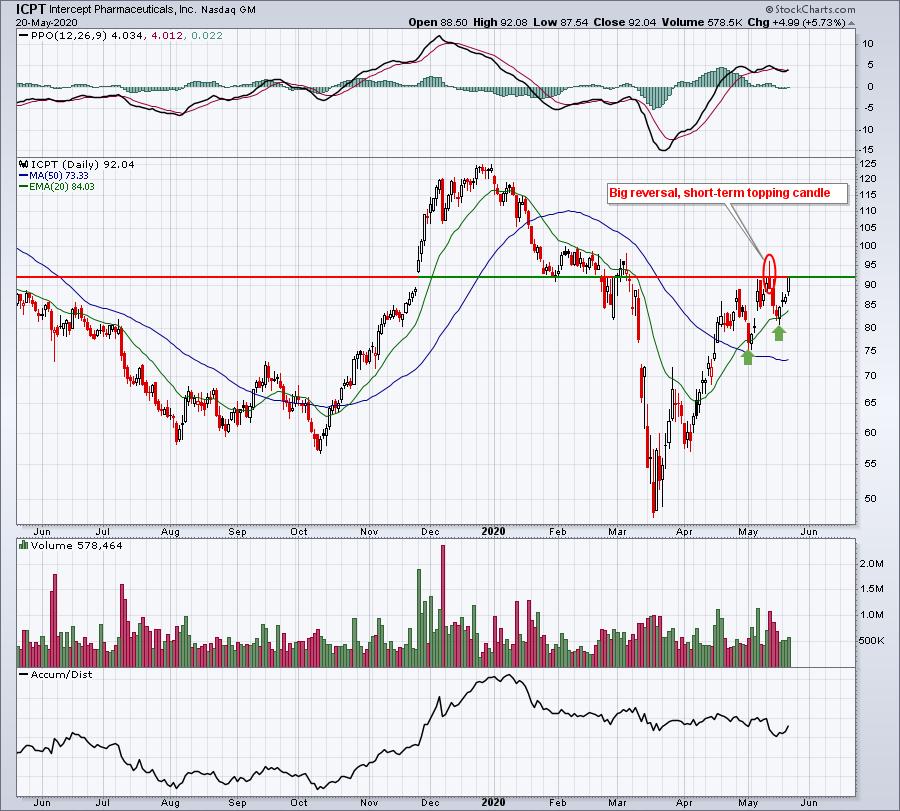
Do you see the failed attempt and reversal on May 12th? Those are the type of candles that can spell doom in the very short-term. Note the subsequent drop, and now here we are again, looking at a potential breakout. Also note that the rising 20 day EMA has been providing excellent support on pullbacks.
Earnings Reports
Here are the key earnings reports for today and tomorrow, featuring stocks with market caps of more than $10 billion. I also include a few select companies with market caps below $10 billion. Finally, any portfolio stocks (or active trade alerts) that will be reporting results are highlighted in BOLD. If you decide to hold a stock into earnings, please understand the significant short-term risk that you are taking. Please be sure to check for earnings dates for any companies you own or are considering owning:
Thursday, May 21:
NVDA, MDT, INTU, TJX, ROST, A, HRL, SPLK, PANW, BBY, HPE, DECK, BJ, PRSP, RAMP, ELF
Friday, May 22:
BABA, PDD, DE, CAE, FL
Economic Reports
Initial jobless claims: 2.44 mil (actual) vs. 2.38 mil (estimate)
May Philadelphia Fed Survey: -43.1 (actual) vs. -41.0 (estimate)
May PMI composite: 30.2 (estimate)
April existing home sales: 4,325,000 (estimate)
April leading indicators: -5.9% (estimate)
Happy trading!
Tom