
EB Daily Market Report - Friday, May 22, 2020
Executive Market Summary
- Futures were down fractionally this morning and action throughout the day has been choppy, though a few indices have turned positive, including the NASDAQ
- Real estate (XLRE, +1.63%) and energy (XLE, -1.16%) are trading opposite one another today and are the only two sectors gaining or losing 1% or more
- Media agencies ($DJUSAV, +3.24%) are benefiting from a solid earnings report from LiveRamp (RAMP)
- NVIDIA's (NVDA) strong report is no doubt aiding the tech-laden NASDAQ 100 ($NDX)
- After a solid recent rally, crude oil ($WTIC) is down 2.4%, pressuring the energy sector
Market Outlook
When the S&P 500 rises, one price relative chart that I always review periodically is the XLY:XLP. It tells us, as prices rise, if traders are willing to bet more on companies that sell the things we WANT as opposed to the things we NEED. Consumer discretionary (XLY) is the sector housing companies that provide the things we want. If the XLY trends up vs. the XLP (consumer staples), that's a sign that Wall Street is in a RISK ON mode. That typically drives markets higher during secular bull markets. Currently, this ratio is soaring higher to complement the S&P 500's rebound:
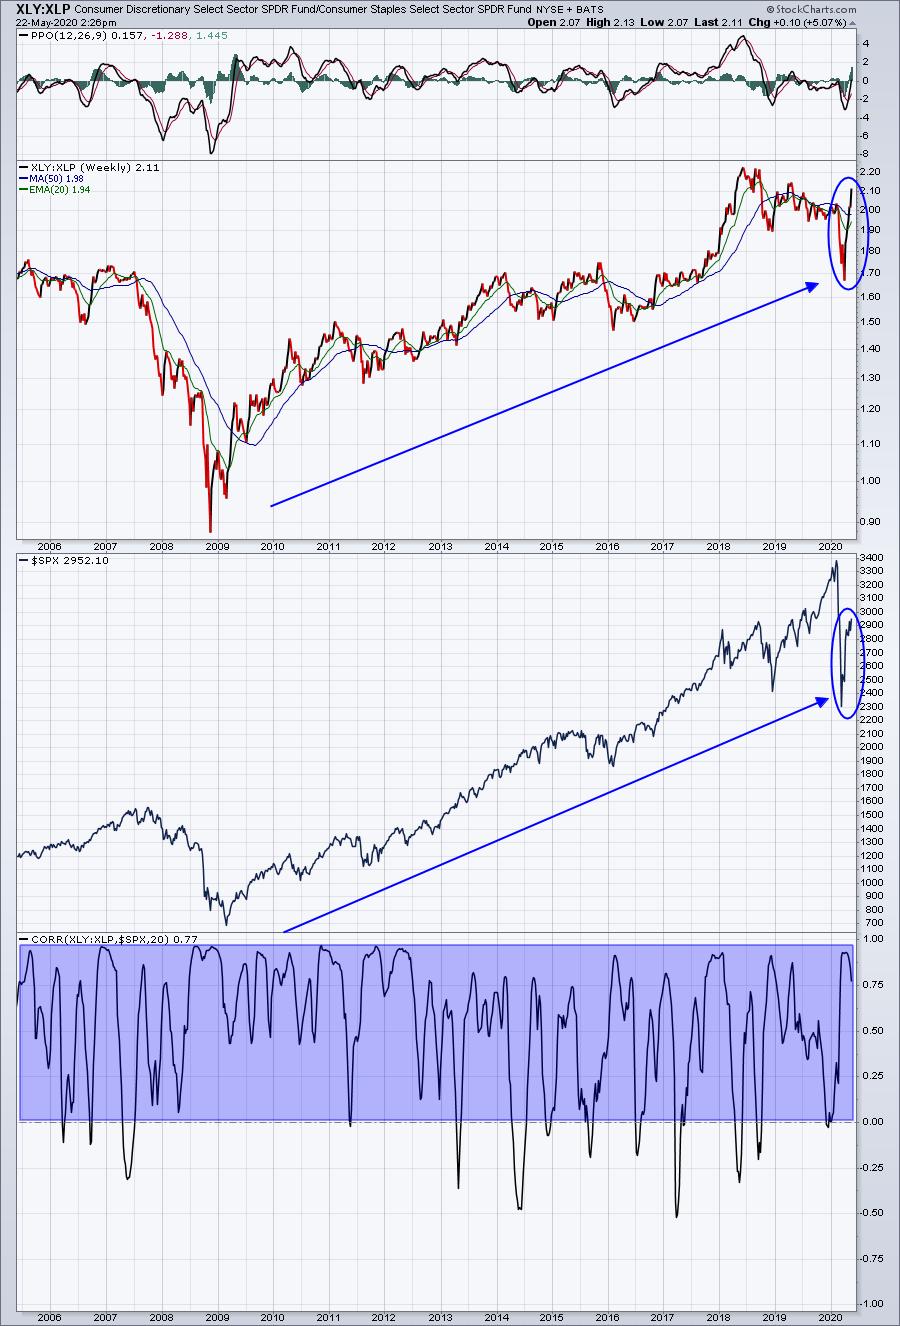
The blue-shaded area highlights the (mostly) positive correlation between the XLY:XLP and the direction of the S&P 500. It's generally quite bullish for both to be rising simultaneously.
Sector/Industry Focus
The Dow Jones Clothing & Accessories Index ($DJUSCF) is trying to breakout, but the bears could argue the group remains in a bearish wedge. Obviously, the breakout would play more into the bullish argument, so let's keep an eye on this chart to see which side wins. I'd bet on the bulls:
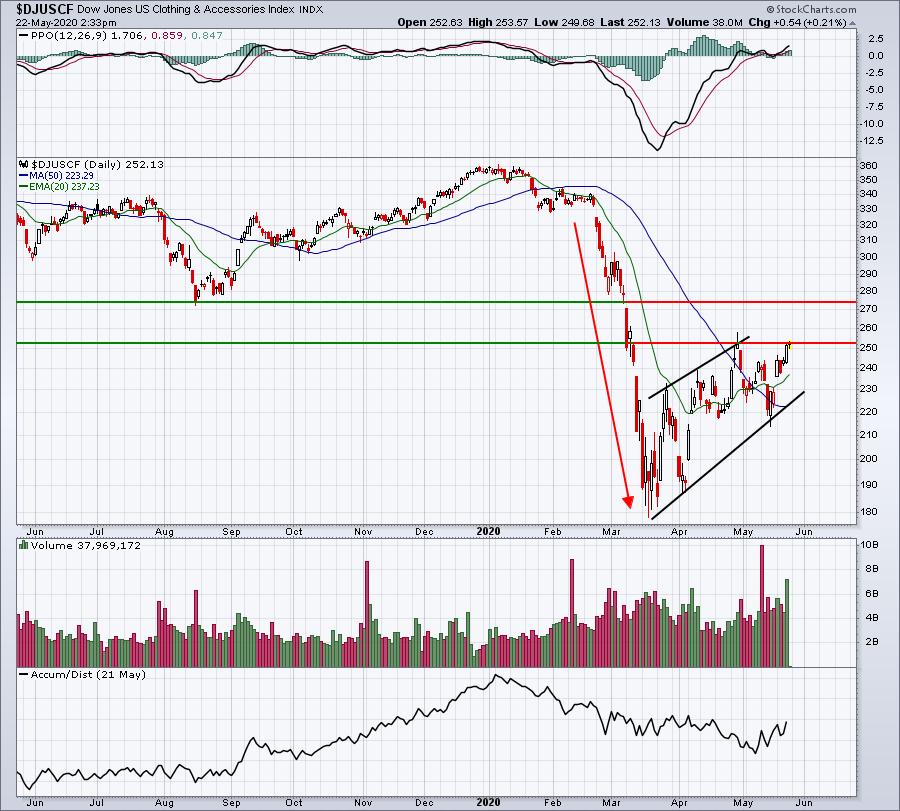
The bearish argument requires a breakdown of the wedge pattern to confirm. Meanwhile, the series of higher highs and higher lows looks like an uptrend to me and a definitive break above the late-April high adds to the bullish argument.
ChartLists
In this morning's WAR Room session, I highlighted how I use several different scans against our three primary ChartLists - the Strong Earnings ChartList (SECL), the Strong AD ChartList (SADCL), and the Weak AD ChartList (WADCL). While I didn't really uncover any great looking trading candidates today from these lists, we do continue to see stocks occasionally breaking out from our Short Squeeze ChartList, so don't forget about that one. The only trades I would consider here would be breakouts. In many instances, these charts are broken, so I wouldn't be looking to buy on pullbacks. Instead, watch for the breakouts and increasing volume. Here's one that's definitely looking promising:
TWTR:
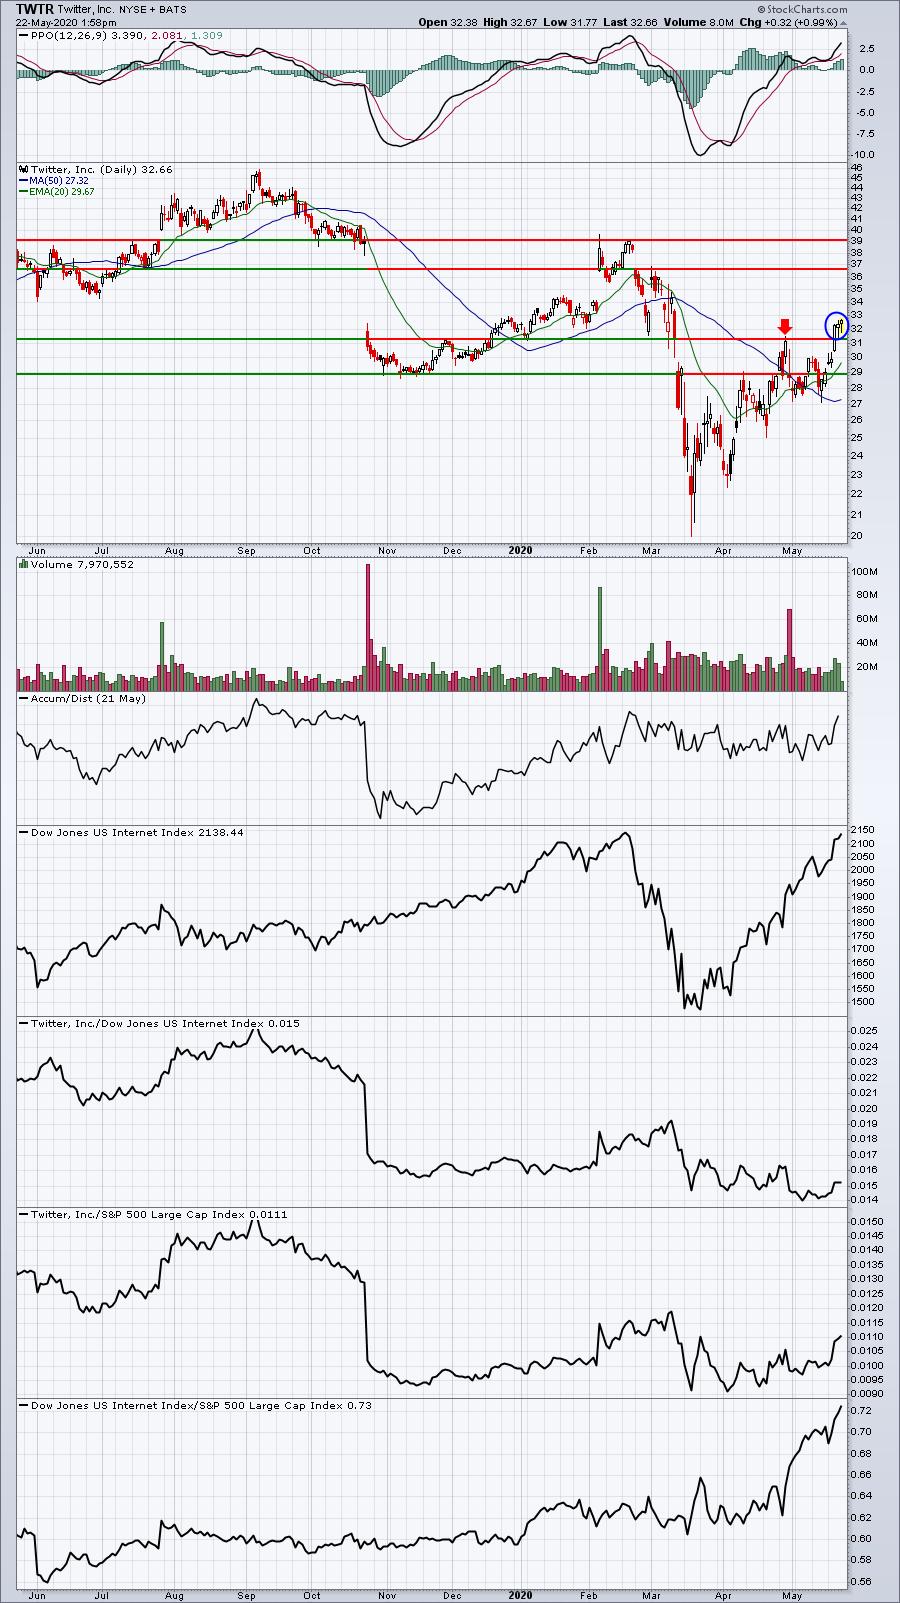
TWTR is in the red-hot internet space ($DJUSNS) and it's just broken above key gap resistance where the last rally attempt in late-April failed (red arrow). It looks like TWTR has a decent chance to continue trending upwards until next resistance closer to 36.75. Shorts are likely beginning to feel a bit more pressure.
Earnings Reports
Here are the key earnings reports for today and tomorrow, featuring stocks with market caps of more than $10 billion. I also include a few select companies with market caps below $10 billion. Finally, any portfolio stocks (or active trade alerts) that will be reporting results are highlighted in BOLD. If you decide to hold a stock into earnings, please understand the significant short-term risk that you are taking. Please be sure to check for earnings dates for any companies you own or are considering owning:
Friday, May 22:
BABA, PDD, DE, CAE, FL
Tuesday, May 26:
BNS, AZO, KEYS, HEI, BAH, PLAN
Economic Reports
None
Happy trading!
Tom