
EB Daily Market Report - Wednesday, May 27, 2020
Executive Market Summary
- Futures were strong out of the gate, but that strength was more concentrated in the Dow Jones and S&P 500
- Financials (XLF, +3.00%) and industrials (XLI, +2.21%) are leaders today
- Technology (XLK, -1.60%), health care (XLV, -1.12%), and communication services (XLC, -1.08%) lag
- The U.S. Dollar Index ($USD) has reached a key area of support - more on that below
- Crude oil ($WTIC) is tumbling today, down 5.24% to $32.54 per barrel
- The 10 year treasury yield ($TNX) has fallen to 0.67% as traders seek out the safety of treasuries
- Asian markets were mixed overnight, while European markets are mostly higher
Market Outlook
It makes good sense to keep an eye on the U.S. Dollar Index ($USD). The direction of the USD has a very direct impact on the relative strength among energy (XLE) and materials (XLB) stocks. Both the XLE and XLB have underperformed the benchmark S&P 500 for 9 years during a period of a rising USD as you can see below:
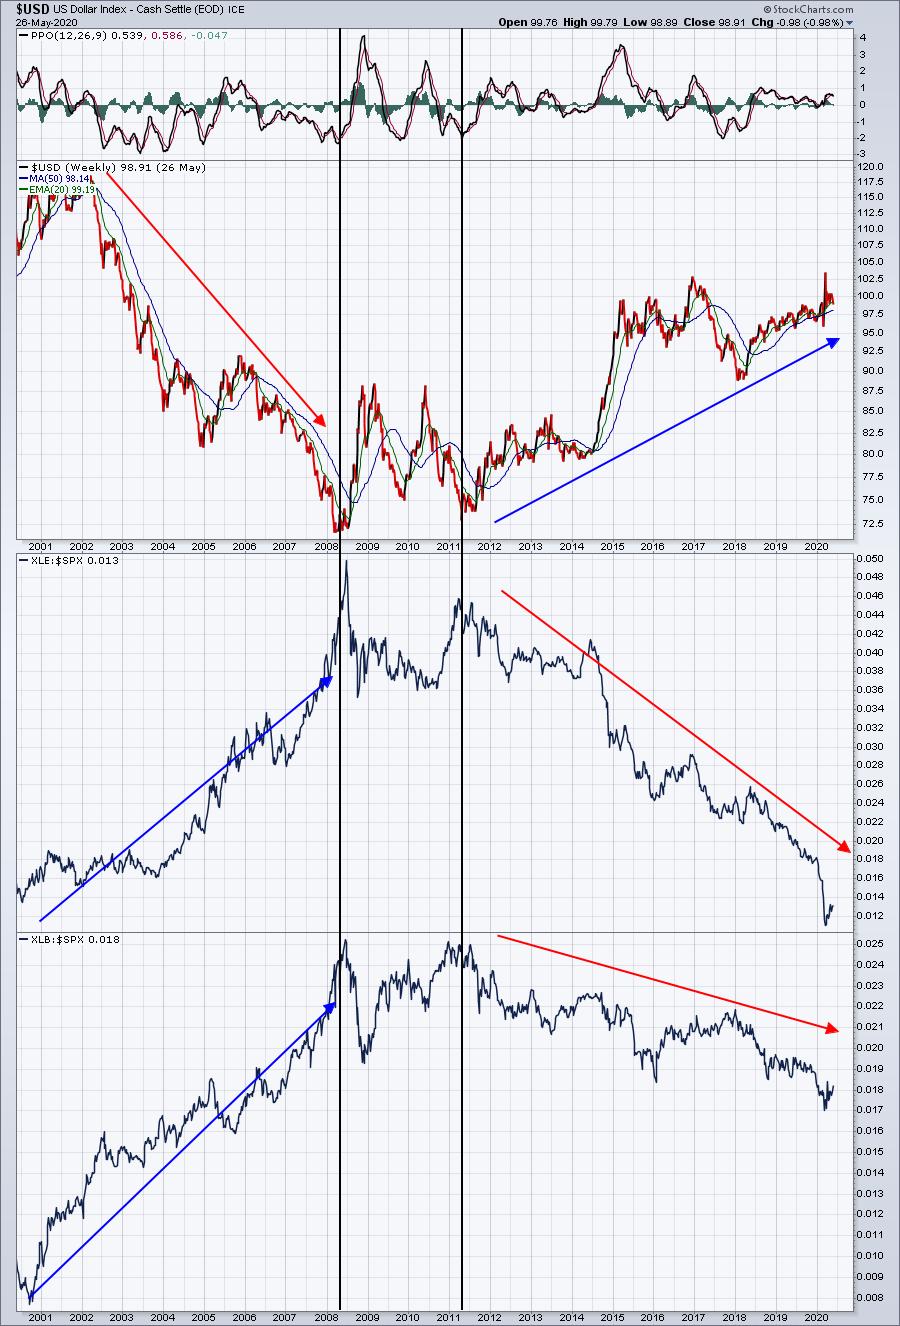
But from 2001 to 2008, the USD was falling and it had the opposite effect on the XLB:SPX and XLE:SPX. Both groups outperformed. I wouldn't be overly concerned about the USD's current uptrend, unless we see a break of trendline support closer to 95. However, in the very near-term, we could see a short-term breakdown, which could lead to summer outperformance by the XLE and XLB. Here's a daily chart of the USD to give you a better short-term picture:
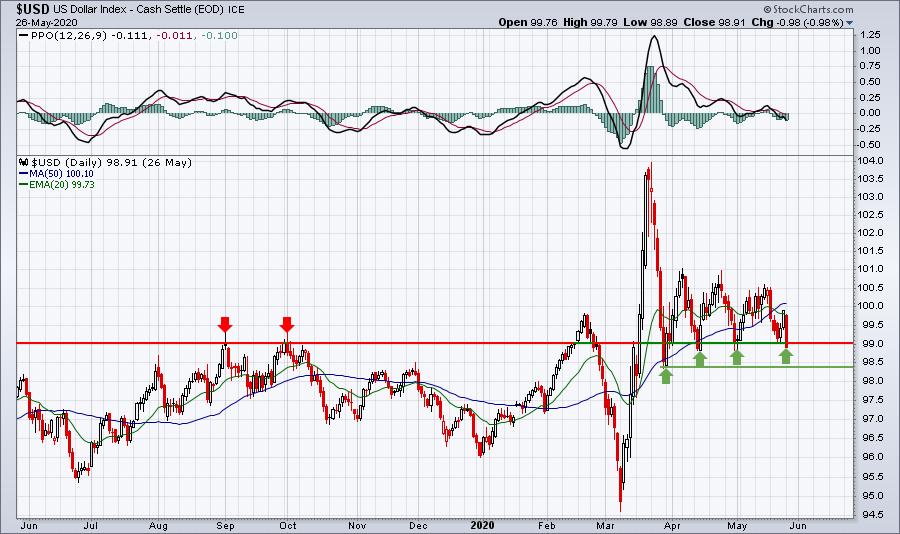
I could argue short-term support down to roughly 98.40, but if that were to be lost, I don't see much support until the March low of 95 is tested. Remember, that's the approximate level where the long-term uptrend would intersect.
Sector/Industry Focus
Since gapping higher yesterday morning, the NASDAQ 100 ($NDX) has been under intense selling pressure. I believe it will provide a number of opportunities, but how deep the selling goes is the big mystery. We've seen a TON of outperformance in this group, so we have to be prepared from time-to-time for outright selling. Now seems to be one of those times:
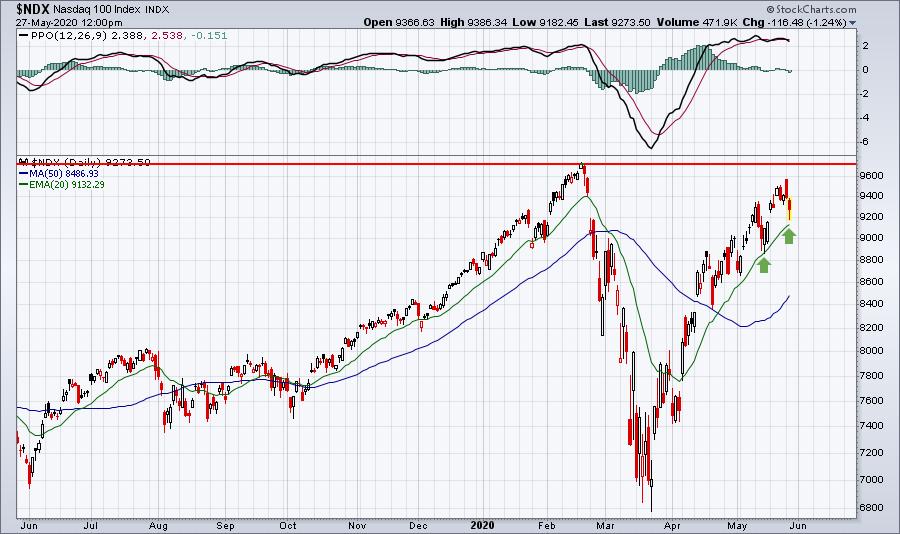
The slope of the current uptrend cannot last forever. We WILL consolidate at some point. At yesterday's open, the NDX hit 9570. The all-time high is 9736. Remarkably, and I don't know anyone that predicted this, the NDX was within 166 points, or less than 2%, from its all-time high. I would have to think that we'll pause as we approach this MASSIVE resistance level. Continue to respect that 20 day EMA to the downside - for now. If that were to break, then I believe a consolidation phase could begin, leading to a drop to perhaps as low as 8600-8800. I'm not predicting that, just trying to keep it real. We've come a long way off that March bottom. Ultimately, I believe strong earnings growth in a historically-low interest rate environment will send the NDX to 10,000 and well beyond. But let's take this one step at a time.
ChartLists
Below are several trade ideas to consider from our various ChartLists. We've also received numerous inquiries as to when the scanning addition to our website will take place. I'll announce it here and on my Trading Places LIVE shows when it's complete, but we're hoping to have it up on our website by the weekend.
GPS:
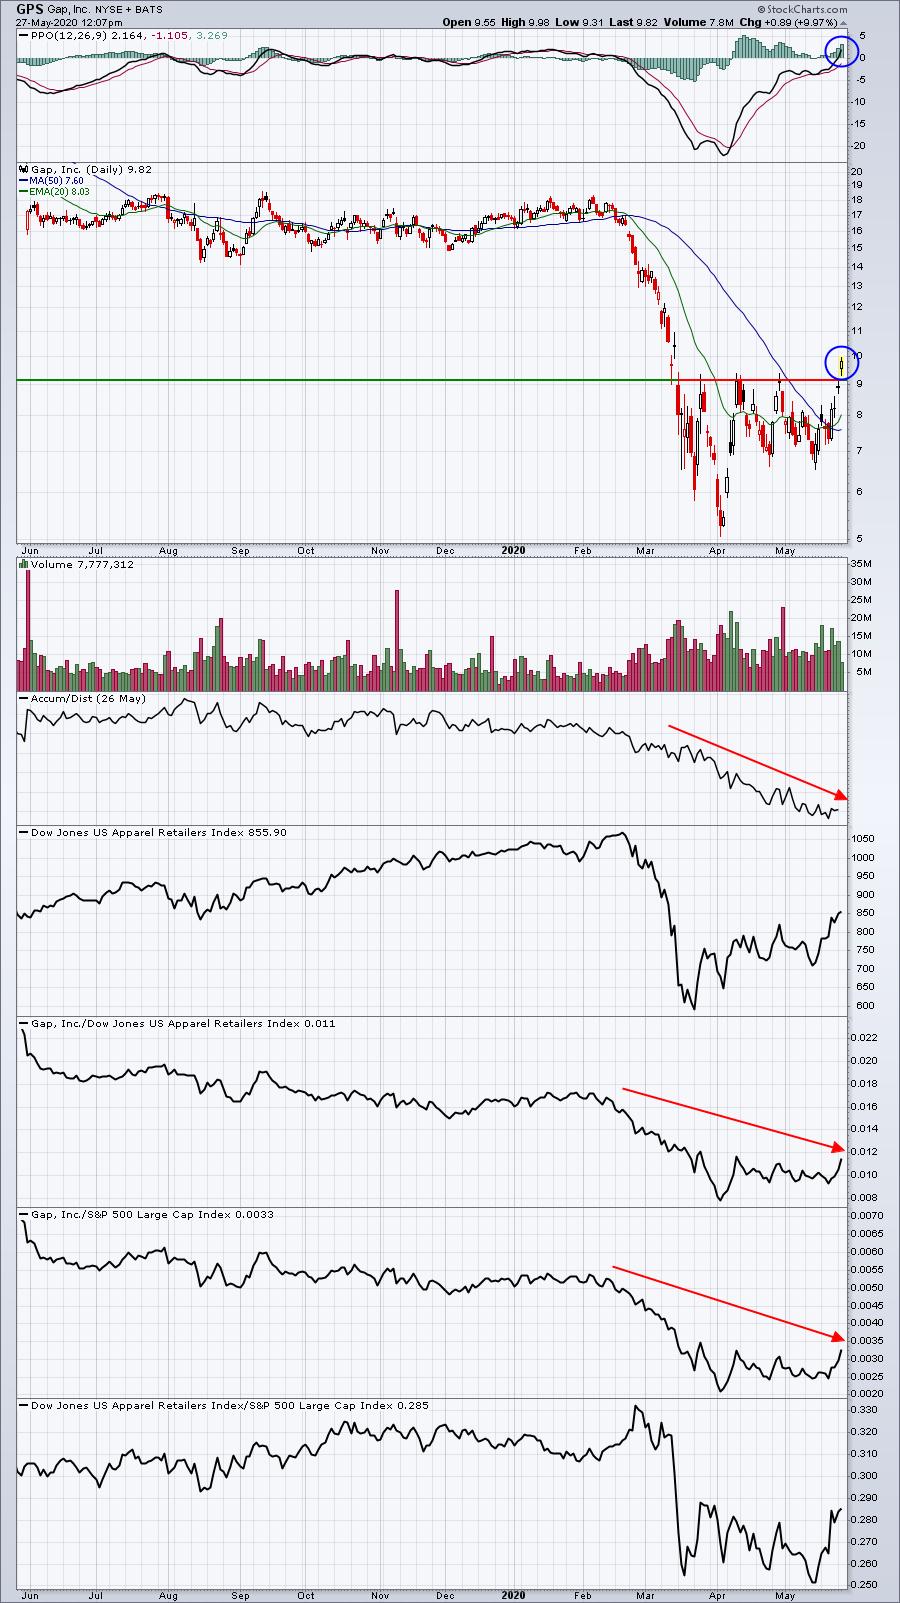
Clearly, GPS is strengthening. Volume is solid as it makes a very significant breakout. This illustrates why I personally have chosen to avoid selling stocks short. I believe we're in a secular bull market, and that type of environment tends to lift nearly ALL stocks. I find it much more profitable to look for long candidates. A breakout like this one on GPS is definitely buyable. Just consider using a stop in the event this breakout attempt fails. A better opportunity in my view is something like this:
NFLX:
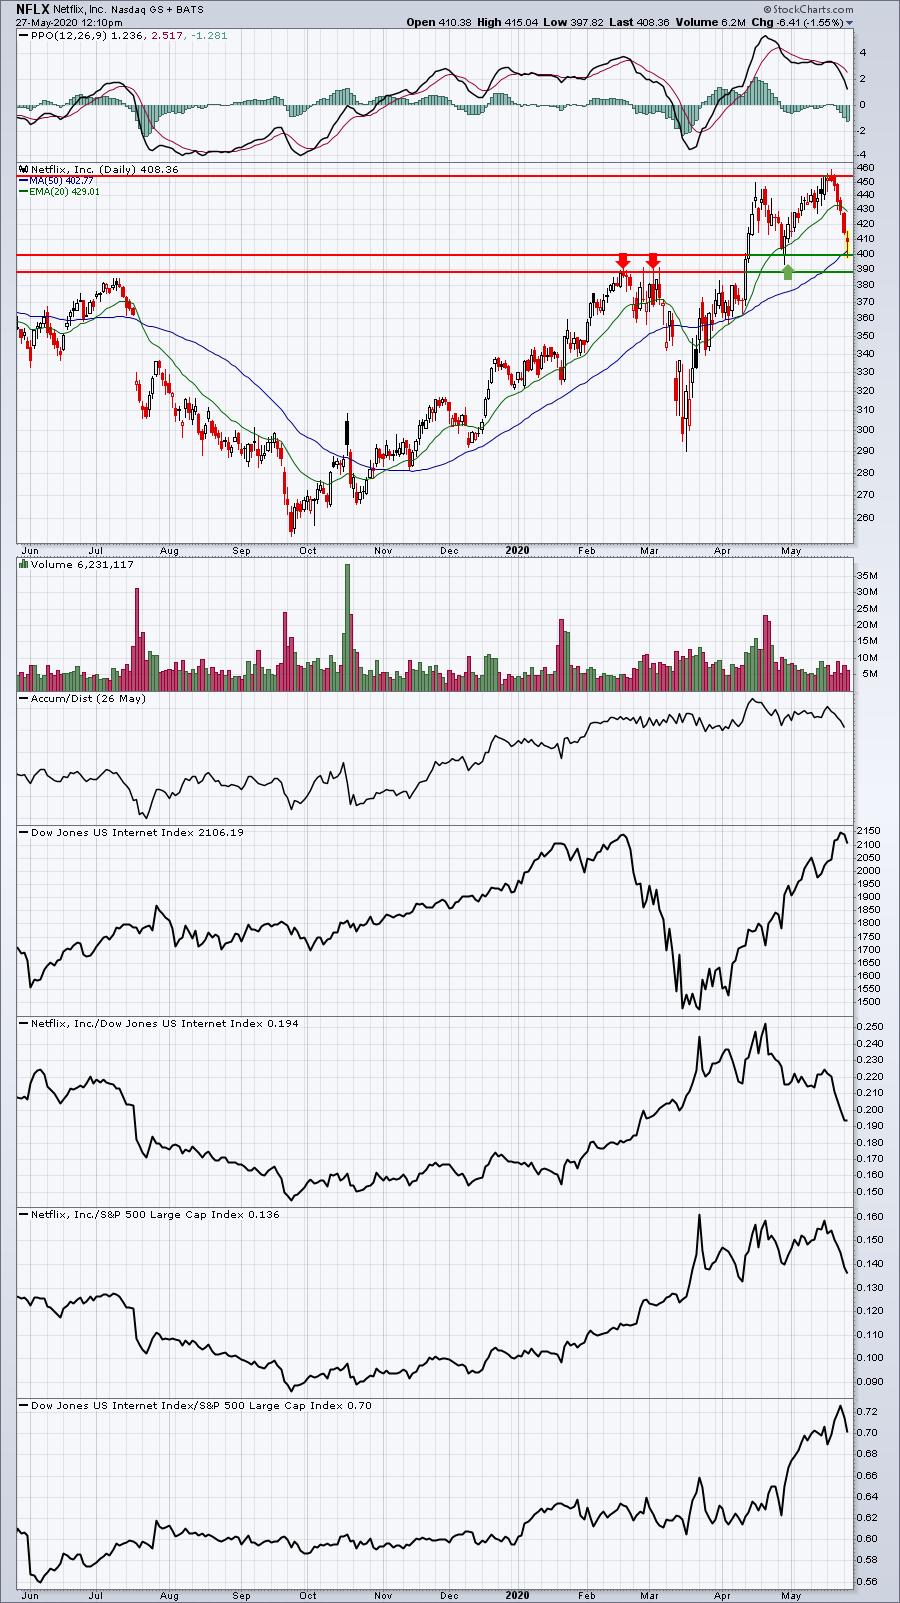
NFLX has been a much better performer throughout this pandemic and it's on our Strong AD ChartList. My trading style, and it doesn't have to be like yours, is to consider stocks at key breakouts OR on key pullbacks as they near price support. NFLX could be reversing at initial price support close to 400. I'd even be okay with NFLX testing the 390 area. I believe the reward to risk at the current level is solid given current market conditions. I also believe this a nice opportunity for another recent high flyer:
DXCM:
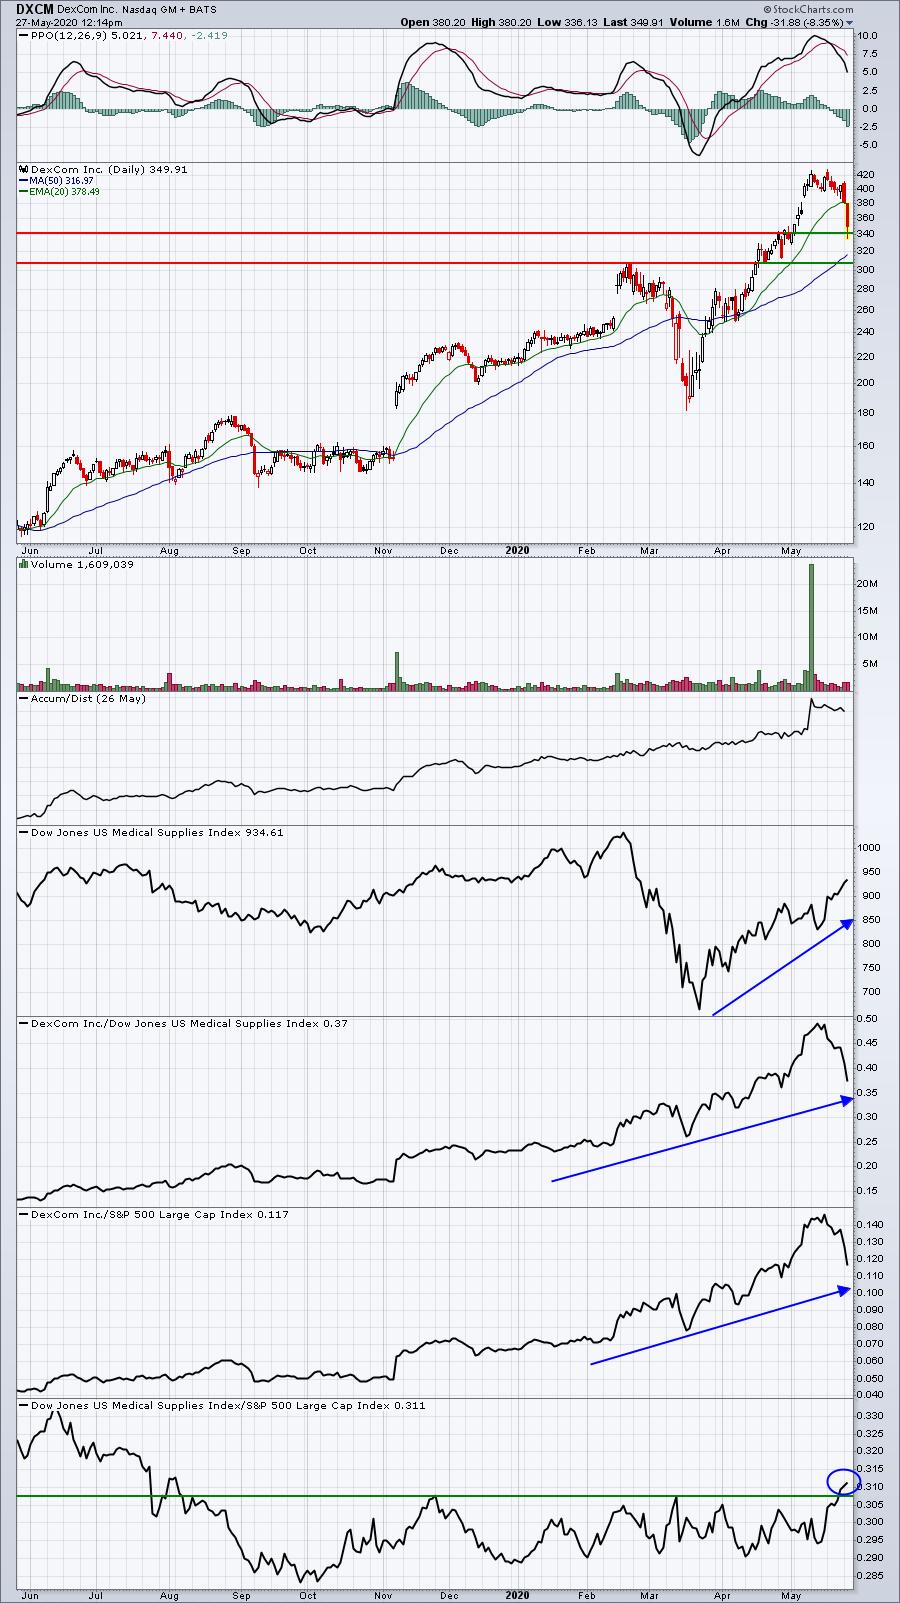
I don't know what the short-term holds, but I do know a couple things from this chart. First, in the bottom panel, the medical supplies industry ($DJUSMS) has broken to a 10 month high relative to the S&P 500. DXCM has been one of the leading medical supplies companies. This selloff has taken it down to the initial level of price support at 340. We might even see a test of 300 support if NASDAQ stocks continue their selloff, but this would be an area to at least consider an initial entry. DXCM is a member of our Strong Earnings, Strong AD, Short Squeeze ChartLists.
As an aside, DXCM is also part of our Aggressive Portfolio. Many of the stocks in our portfolios have sold off the past two days and are providing excellent trading opportunities. I expect that these stocks will lead any NASDAQ recovery.
Earnings Reports
Here are the key earnings reports for today and tomorrow, featuring stocks with market caps of more than $10 billion. I also include a few select companies with market caps below $10 billion. Finally, any portfolio stocks (or active trade alerts) that will be reporting results are highlighted in BOLD. If you decide to hold a stock into earnings, please understand the significant short-term risk that you are taking. Please be sure to check for earnings dates for any companies you own or are considering owning:
Wednesday, May 27:
RY, ADSK, WDAY, BMO, HPQ, VIPS, NTAP, RL, NTNX, TOL
Thursday, May 28:
CRM, COST, TD, VMW, DG, DELL, VEEV, CM, OKTA, DLTR BURL, TCOM, ULTA, ZS, OLLI, WSM, TECD, PSTG, MOMO, DXC, JWN, SHOO, ADVM, CSIQ
Economic Reports
Beige book due out at 2:00pm EST
Happy trading!
Tom