
EB Daily Market Report - Thursday, May 28, 2020
Executive Market Summary
- Futures were mixed with early weakness in NASDAQ shares
- The NASDAQ has bounced back strongly, however, just as it did on Wednesday
- Utilities (XLU) is leading the action higher, followed by 2020 stalwarts, health care (XLV) and technology (XLK)
- Energy (XLE) and financials (XLF) are in negative territory
- Many of the leading industry groups off the March 23rd low are showing strength today
- Medical equipment ($DJUSAM), toys ($DJUSTY), and software ($DJUSSW) are all up over 2%
- The 10 year treasury yield ($TNX) continues bouncing back and forth, today higher by 2 basis points to 0.70%
Market Outlook
I've maintained that I'm not a fan of gold ($GOLD) longer-term and we're seeing tremendous underperformance by gold as fear dissipates. A rising Volatility Index ($VIX) has historically been a good signal to buy gold, but when the VIX falls, gold is typically ignored. The following chart illustrates this:
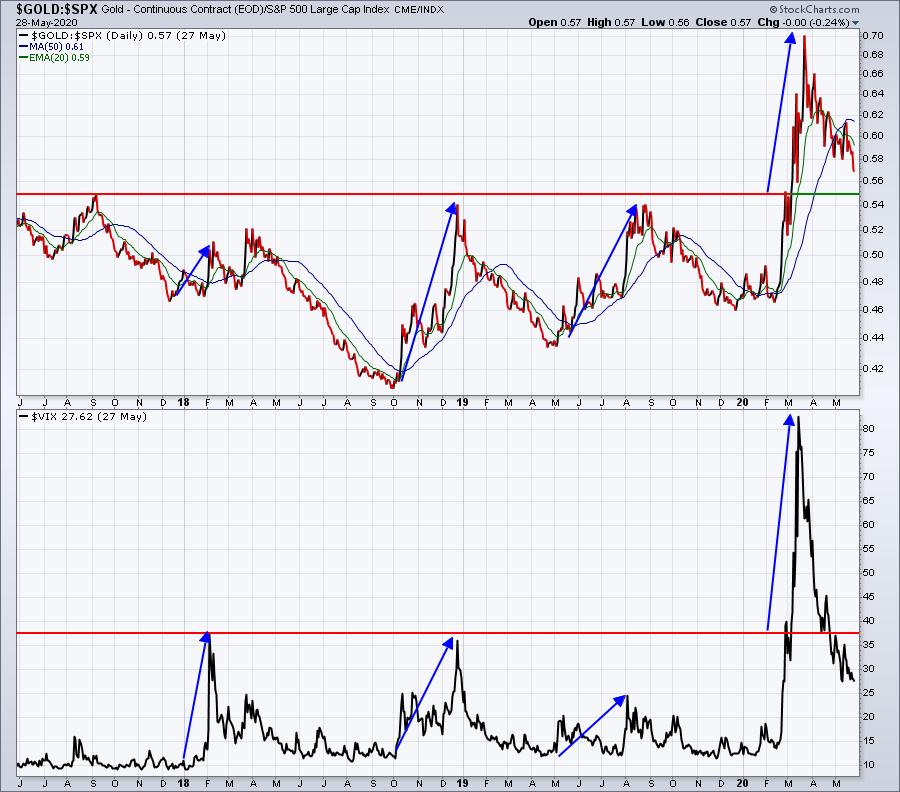
Investing in gold at this time comes down to one thing. Do you believe the worst is behind us in terms of this pandemic? If so, you probably don't want to own gold. If you want to use it as a hedge "just in case", that's fine, but it'll work against your overall stock market performance if the secular bull market resumes and we see new all-time highs ahead - which I believe we will.
Sector/Industry Focus
Recreational products ($DJUSRP) are up more than 1% today and breaking above the February 20th closing high. It's just one more solid-looking industry group chart poised to move higher:
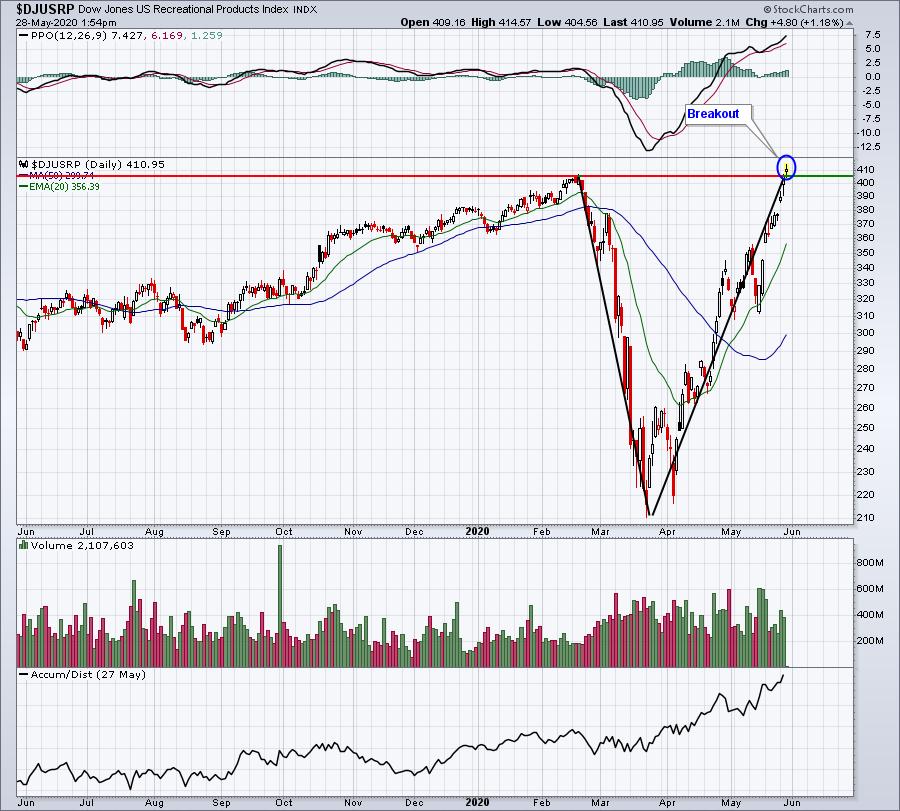
I know many "experts" on CNBC were saying that a "V" bottom could not happen. Where are those experts now? That looks like a V bottom to me. Wall Street is telling us that our economy will recover much faster than many believe and the "even lower" interest rates will likely result in a melt up in stock prices because earnings are so much more valuable in a low interest rate environment.
Making bad calls on CNBC and being invited back repeatedly is their standard, which helps to explain why I never watch it. They might be interested in educating their viewers, but that interest will always take a back seat to ratings and the almighty dollar.
ChartLists
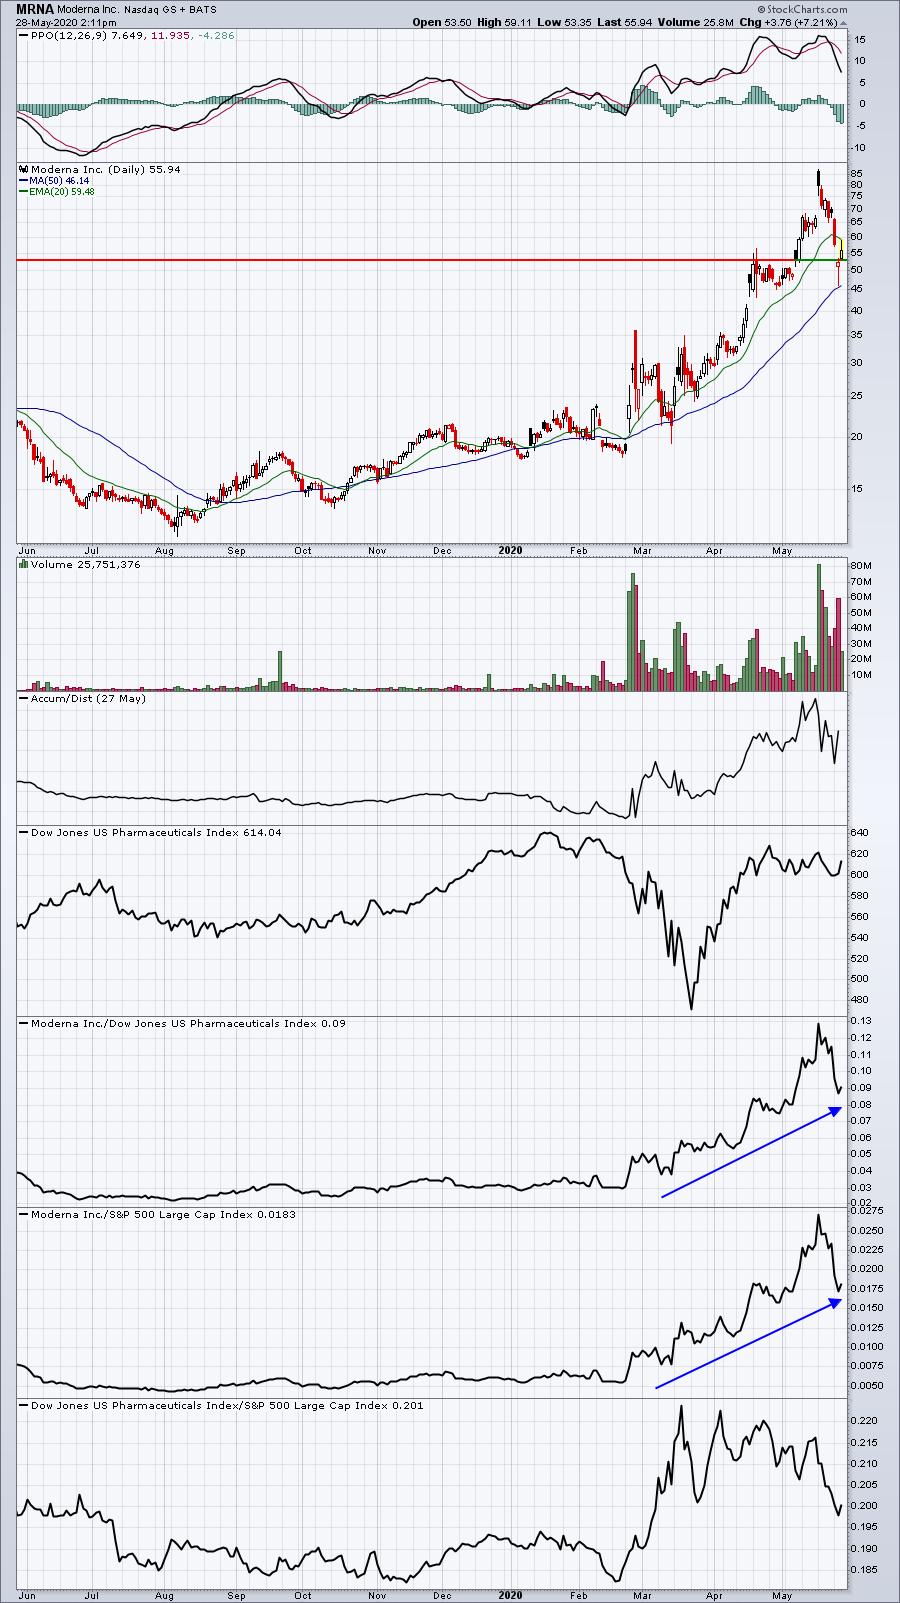
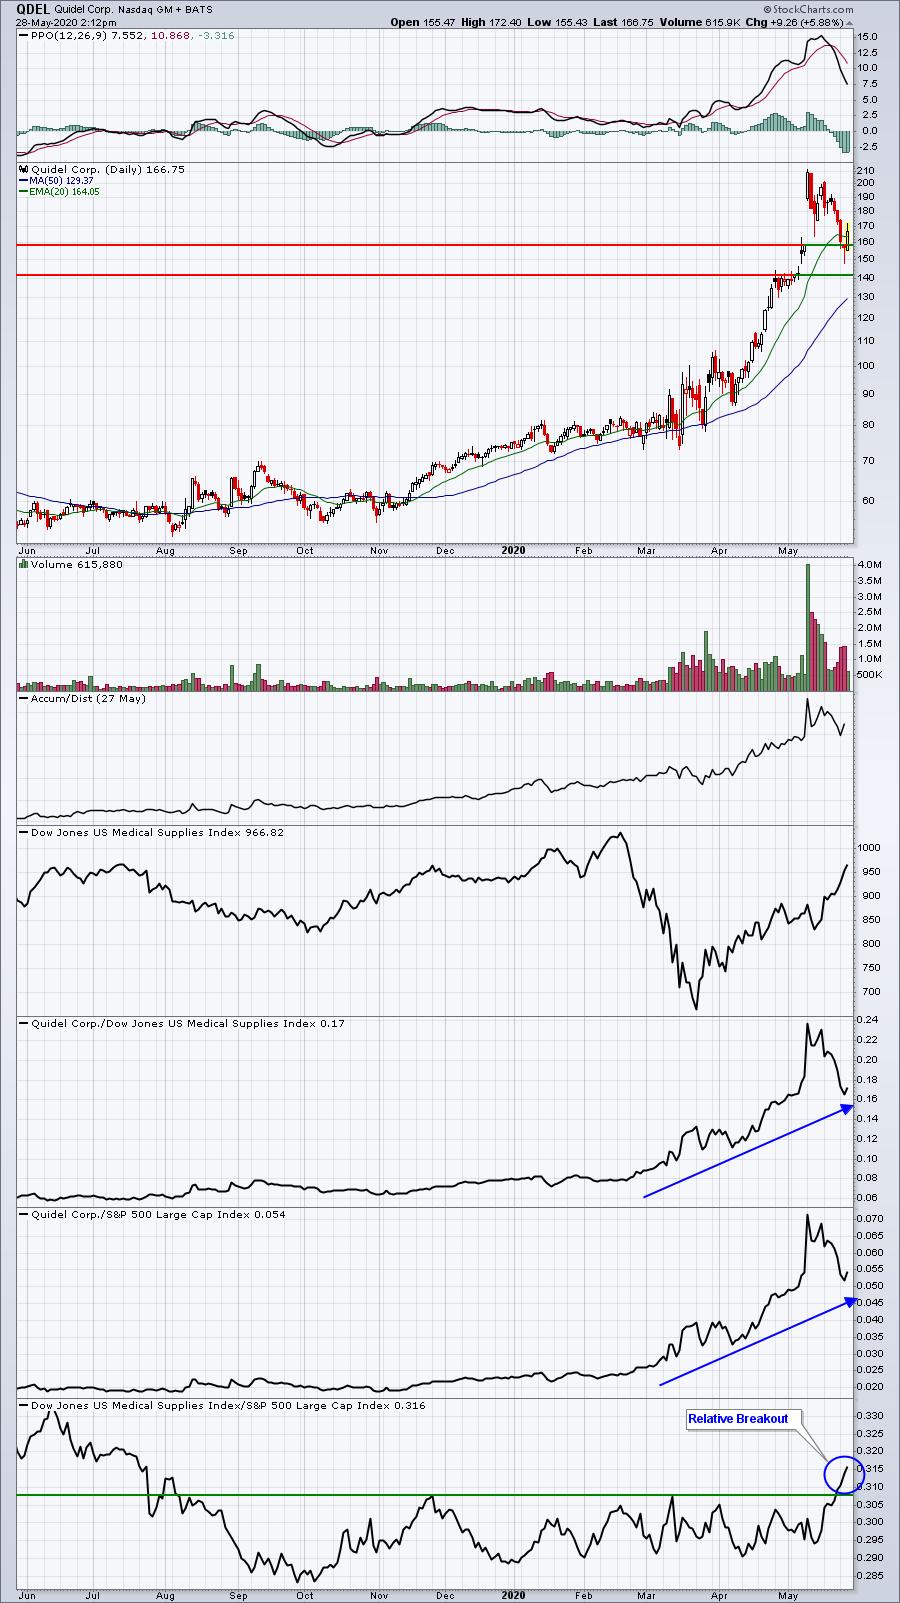
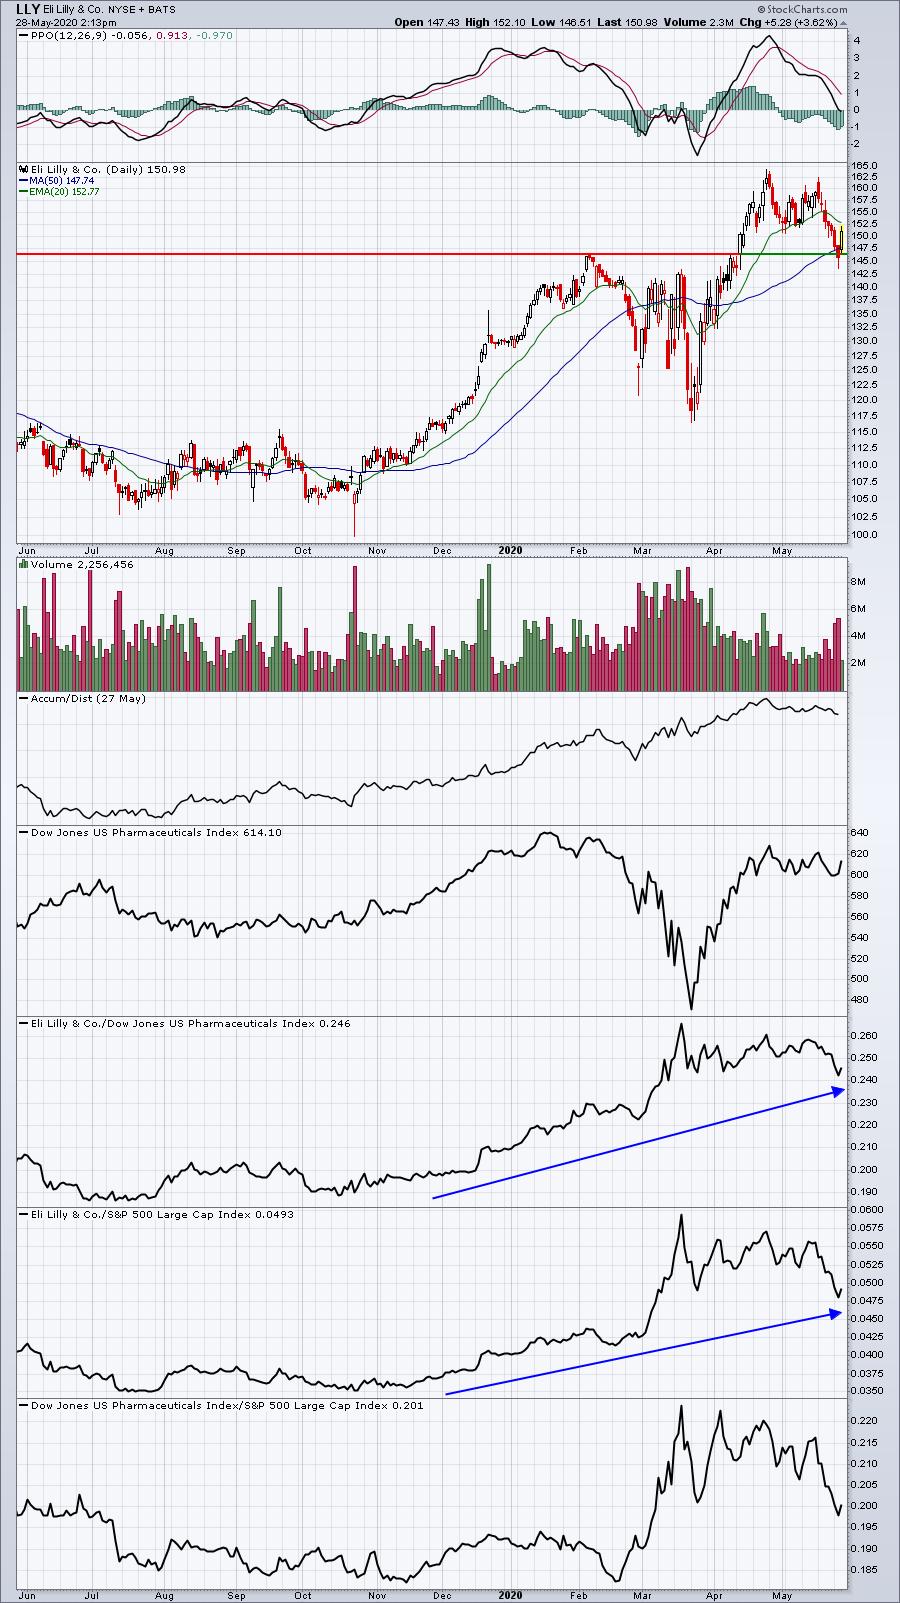
I ran my Downtrend Reversal scan, which identifies stocks that have seen at least 3 days of lower daily highs, but are seeing a higher daily high today. It "could" be the start of an uptrend. From the Strong AD ChartList, here are 4 possible candidates using this scan:
MRNA:
QDEL:
LLY:
EVBG:
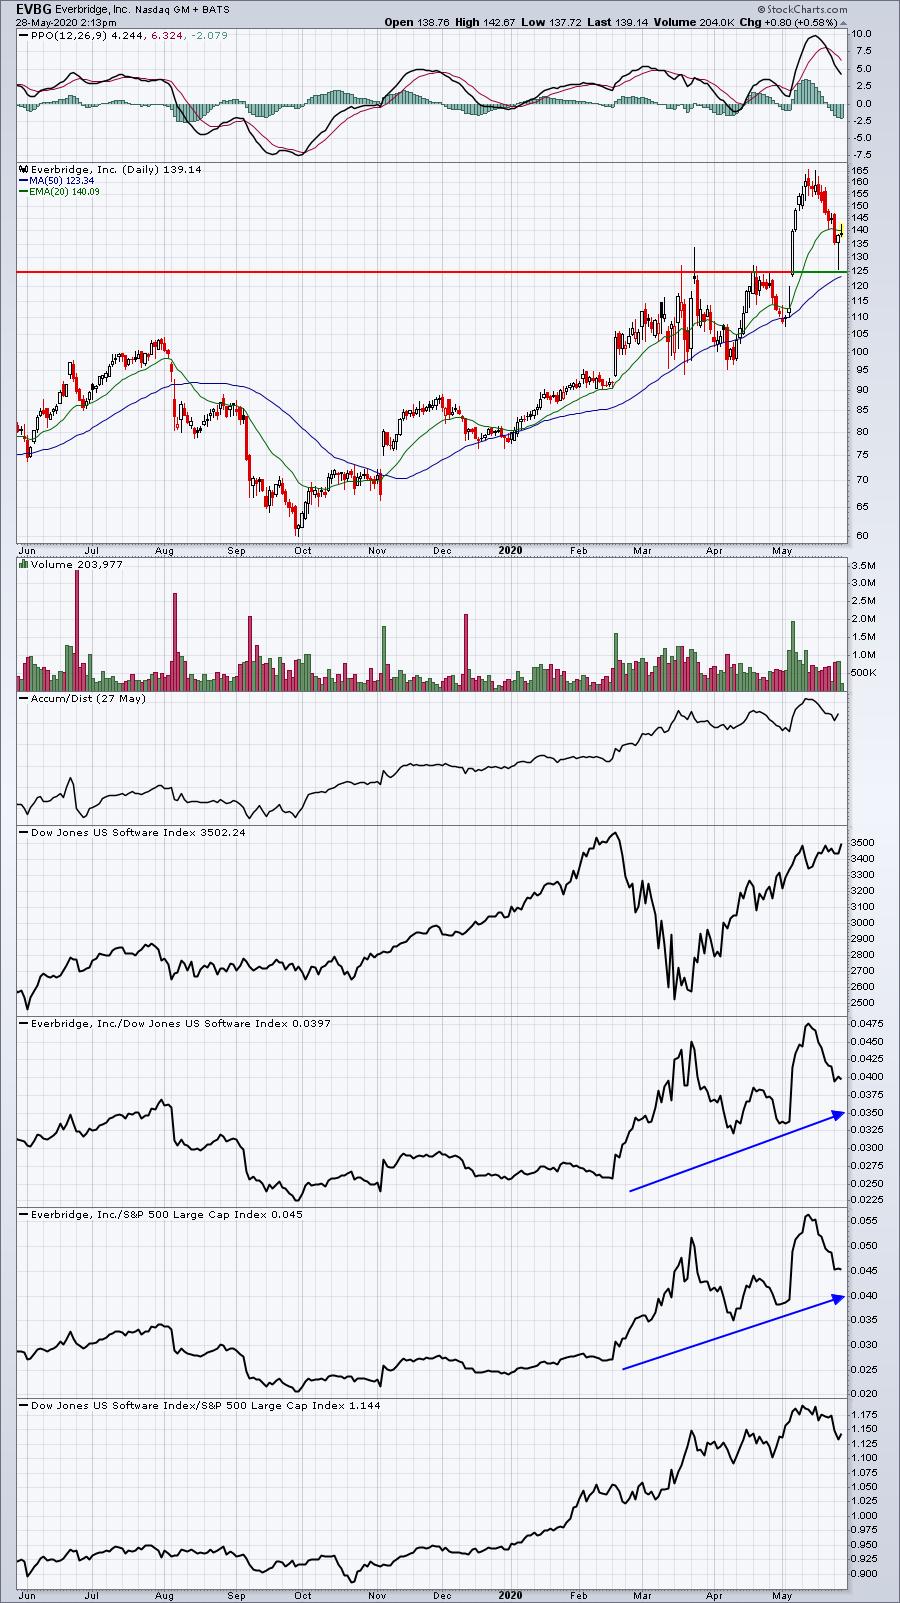
Of these four charts, a couple points I'd like to make. First, these are all aggressive trades, but MRNA is especially aggressive. It's one of the leading biotech firms working on a COVID-19 vaccine and hype has resulted in a significant uptrend. I certainly like it better after pulling back from 85 to 45, but if you trade this one, you have to be willing to take the risk of overnight developments. There are a lot of gap ups and gap downs on that chart.
Next, there were 22 scan results. The key takeaway here is that plenty of stocks are in downtrends at various time points and they can reverse on different days. My personal trading strategy is to buy excellent companies - that are displaying bullish technical characteristics like rising relative strength - after pullbacks. I believe the reward to risk is set up much better and I have higher confidence in my these types of setups.
Earnings Reports
Here are the key earnings reports for today and tomorrow, featuring stocks with market caps of more than $10 billion. I also include a few select companies with market caps below $10 billion. Finally, any portfolio stocks (or active trade alerts) that will be reporting results are highlighted in BOLD. If you decide to hold a stock into earnings, please understand the significant short-term risk that you are taking. Please be sure to check for earnings dates for any companies you own or are considering owning:
Thursday, May 28:
CRM, COST, TD, VMW, DG, DELL, VEEV, CM, OKTA, DLTR BURL, TCOM, ULTA, ZS, OLLI, WSM, TECD, PSTG, MOMO, DXC, JWN, SHOO, ADVM, CSIQ
Friday, May 29:
CGC, BIG
Economic Reports
April durable goods: -17.2% (actual) vs. -18.2% (estimate)
April durable goods ex-transports: -7.4% (actual) vs. -14.0% (estimate)
Q2 GDP (2nd estimate): -5.0% (actual) vs. -4.8% (estimate)
Initial jobless claims: 2.12 mil (actual) vs. 2.10 mil (estimate)
April pending home sales: -21.8% (actual) vs. -15.0% (estimate)
Happy trading!
Tom