
EB Daily Market Report - Monday, June 1, 2020
Special Event
We will be having a special event at 4:30pm ET today, discussing our Short Squeeze ChartList and how we can profit from strategies involving heavily shorted stocks. A link to the room will be provided on our website later this afternoon. I hope you can join us!
Executive Market Summary
- Futures opened lower on Sunday, but quickly improved; our major indices opened relatively flat
- The NASDAQ has taken a leadership role over the Dow Jones and S&P 500
- Small and mid cap stocks are the leaders today
- Real estate (XLRE) and energy (XLE) are leading 10 of 11 sectors higher
- Healthcare (XLV) is the only sector in negative territory today
- Most retailers are lagging; airlines lead industrials, but both truckers and railroads are lower
- Gap, Inc. (GPS) is not following the retail narrative and is the 2nd best S&P 500 stock today, trailing only Coty, Inc. (COTY)
- The 10 year treasury yield ($TNX) is up 3 basis points to 0.67%; crude oil is down fractionally
Market Outlook
One indicator that can sometimes help us to spot trouble ahead is the correlation coefficient. I like to compare the benchmark S&P 500 ($SPX) to the Volatility Index ($VIX). There is generally an inverse relationship between these two, meaning that when the S&P 500 rises, the VIX typically falls. And when the S&P 500 falls, the VIX usually rises. Therefore, my expectation would be for the correlation coefficient for these two indices to be at or close to -1. Here's a look at this chart and relationship currently:
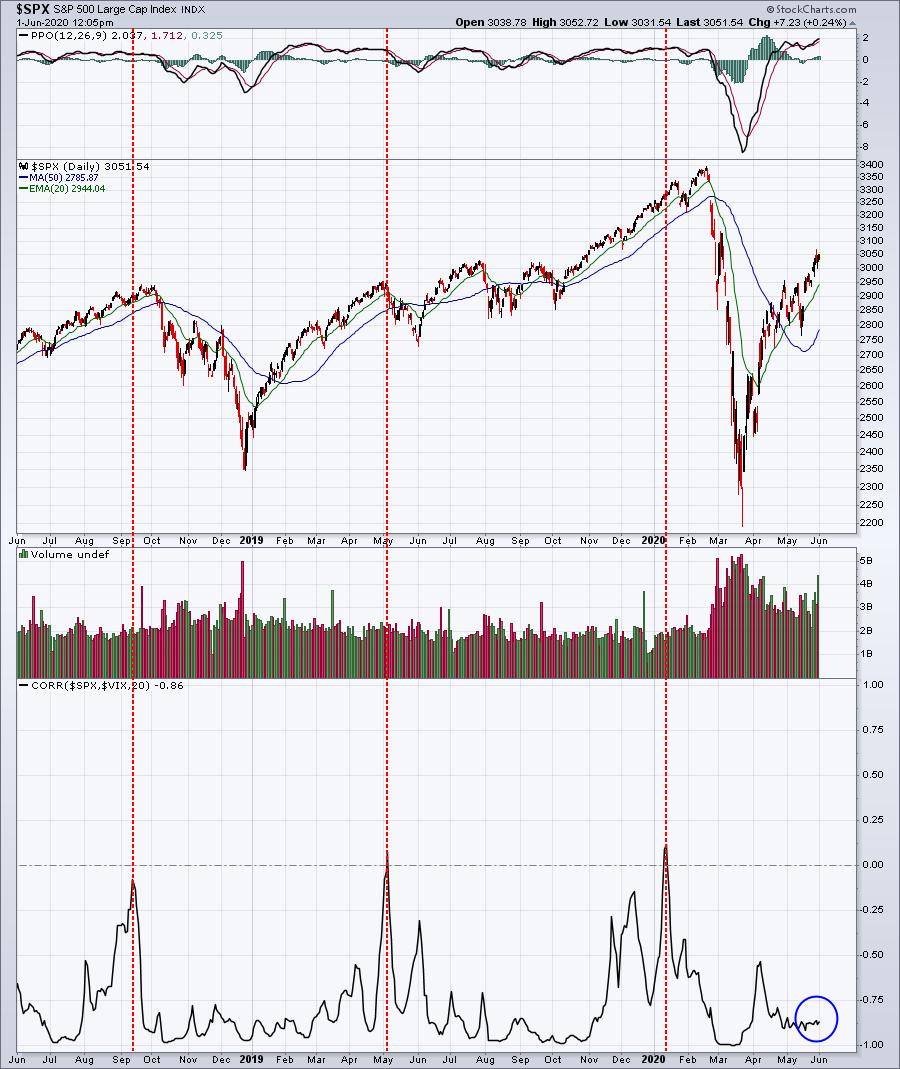
When the S&P 500 rises and the VIX rises simultaneously, it suggests we should grow more cautious. I'd consider building more cash, trading smaller positions, and being very strict with your stops. It does not guarantee us weakness ahead. It simply tells us that the stock market is growing more nervous despite the rise in stock prices. It's unusual and a development worth noting.
As we look at this current relationship, we see the correlation coefficient residing fairly close to that max inverse relationship of -1. In other words, the relationship between the SPX and VIX is healthy and providing us no hint of trouble brewing.
Sector/Industry Focus
I looked at our Industry Group Relative Strength ChartList and reviewed the charts of the 10 best performing industries over the past week. They were mostly the worst performers of 2020 that simply saw a relative rebound last week. For instance, airlines ($DJUSAR) were the worst performing group of 2020 and they were #1 last week in terms of relative performance. Do I trust that group to continue to show relative strength? No. Therefore, I'd watch their rising 20 day EMA. If that were to fail to hold as support, I'd exit very quickly. But I'm beginning to like the aerospace ($DJUSAS) - also on last week's Top 10 industry groups - a bit more. Here's the chart on the DJUSAS:
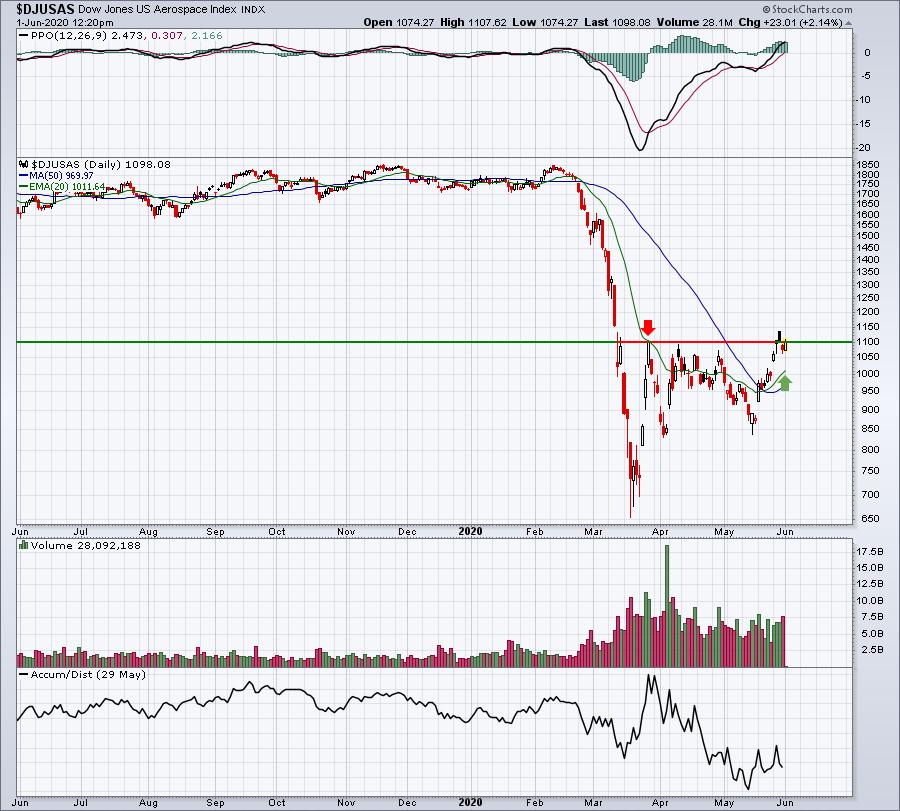
Being able to clear the initial price reaction high is important. Once that occurs, I tend to keep a close eye on the rising 20 day EMA as I've found that moving average to be the most reliable moving average support to an upwardly trending stock or index.
ChartLists
Our scanning page has been set up at EarningsBeats.com, so please check it out when you can. You can copy the scan syntax for various scans into your StockCharts.com account and now run those scans against select ChartLists. For instance, today I ran our Downtrend Reversal (Pullback Scan). I copied and pasted the syntax from our EB.com site, then added the Strong Earnings ChartList from my account. This scan returned one stock, Spotify (SPOT). Here was the syntax:

I'm still missing one thing though. I haven't selected a ChartList to run this scan against. So I add the Strong Earnings ChartList (SECL) and this is how it looks:

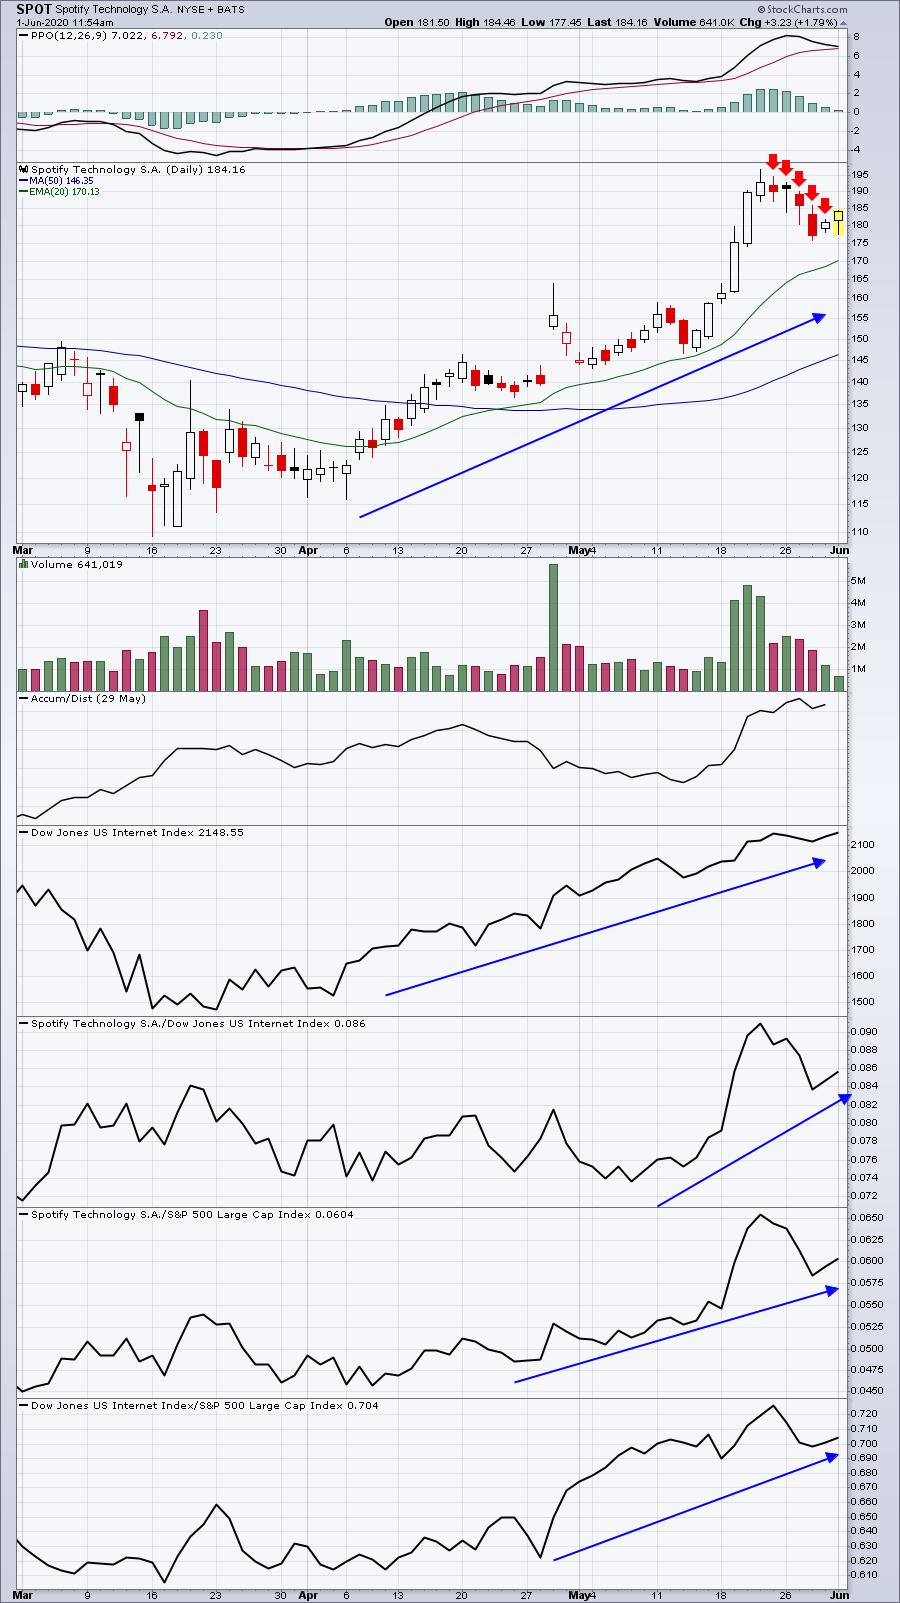
As I mentioned, the scan results came back with just one stock - Spotify (SPOT):
By going through this process, you know the following:
(1) SPOT beat Wall Street consensus estimates as to both revenues and EPS in its latest quarterly earnings report. It wouldn't be on this SECL if it didn't.
(2) SPOT has been pulling back. The 5 red arrows show that SPOT printed 5 consecutive days of lower highs, meeting the criteria of this scan.
(3) SPOT is part of the red-hot internet space ($DJUSNS). Internet stocks have cooled off over recent days, leading to the pullback in SPOT.
(4) SPOT has been a strong relative performer among internets, and internets have been strong relative to the S&P 500.
These are the types of stocks where I want to put my money to work.
Earnings Reports
Here are the key earnings reports for today and tomorrow, featuring stocks with market caps of more than $10 billion. I also include a few select companies with market caps below $10 billion. Finally, any portfolio stocks (or active trade alerts) that will be reporting results are highlighted in BOLD. If you decide to hold a stock into earnings, please understand the significant short-term risk that you are taking. Please be sure to check for earnings dates for any companies you own or are considering owning:
Monday, June 1:
ATHM, ENS
Tuesday, June 2:
ZM, CRWD, DCI, HQY, DKS, CBRL, AMBA
Economic Reports
May PMI manufacturing index: 39.8 (actual) vs. 39.8 (estimate)
May ISM manufacturing index: 43.1 (actual) vs. 42.7 (estimate)
April construction spending: -2.9% (actual) vs. -5.5% (estimate)
Happy trading!
Tom