
EB Daily Market Report - Tuesday, June 2, 2020
Webinar Recording
The webinar recording of last night's event regarding our Short Squeeze ChartList is now available for your review. You can find it on our webinars page. Simply CLICK HERE to access the recording, along with many other recent event recordings.
SECL Updated
Our Strong Earnings ChartList (SECL) has been updated through Monday's quarterly earnings reports. Visit our ChartLists page to click on the SECL link, enter the password provided, and then download the ChartList into your StockCharts.com account (requires an Extra level of membership or above). If you don't have a StockCharts.com account, you can still view the charts, you just won't be able to download/save them. There are now 289 charts, so that will be a lot of charts to look at one-by-one. Downloading the ChartList literally takes just a few seconds.
Executive Market Summary
- Futures were slightly higher and we've seen U.S. equities open a bit higher; leadership is found in the Dow Jones
- Energy (XLE, +2.05%) and materials (XLB, +1.77%) are the best performing sectors, while 2020 sector leaders are struggling to keep pace
- Crude oil ($WTIC) has moved above $36 per barrel, rising nearly 2% today
- The 10 year treasury yield ($TNX) is relatively flat on the session
- European markets, many of which were closed on Monday, are higher today on hopes of reopening
- Zoom Video Communications (ZM), one of the online collaboration stocks benefiting from stay-at-home orders, reports its quarterly results after the bell today
Market Outlook
I tend to pay much more attention to the higher-growth NASDAQ and the multinational S&P 500 indices, rather than the Dow Jones, which only looks at 30 companies, albeit massive conglomerates. But I won't deny that the Dow Jones has become much more bullish over the past 1-2 weeks:
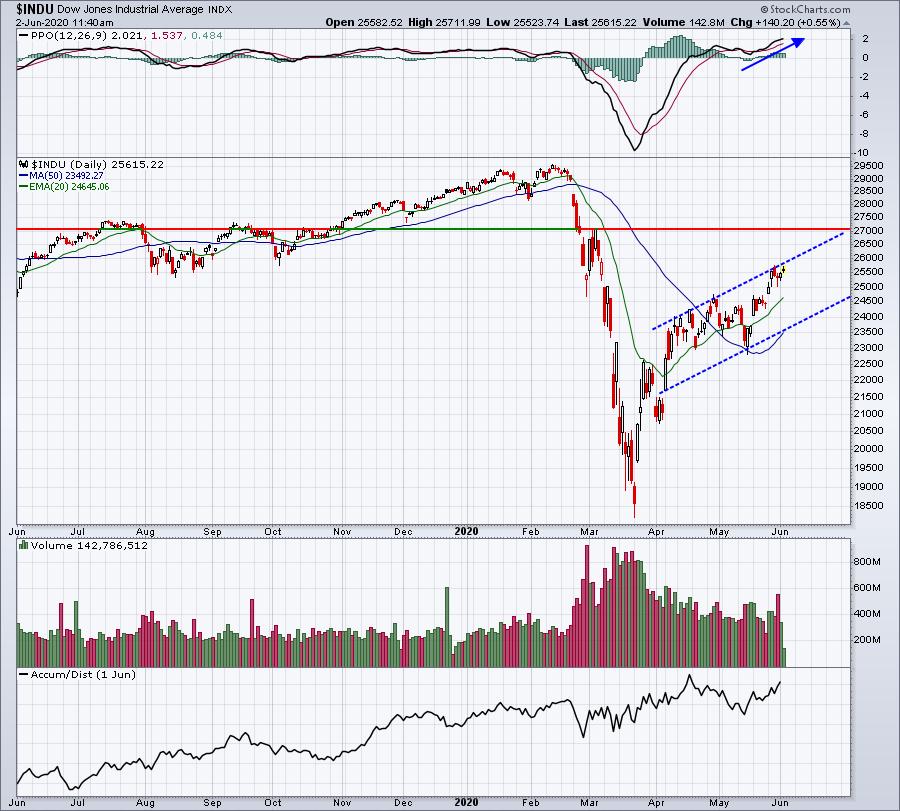
It certainly appears to me that the Dow Jones is in a channel that's likely to carry it to 27000 to test the reaction high from early-March. I don't expect the Dow Jones to outperform either the S&P 500 or the NASDAQ, but I do expect to see higher prices here as we move into the summer months.
Sector/Industry Focus
I've wanted to see the energy ETF (XLE) break above key resistance and it's trying to accomplish it today, though there's still overhead gap resistance to deal with in the very near-term:
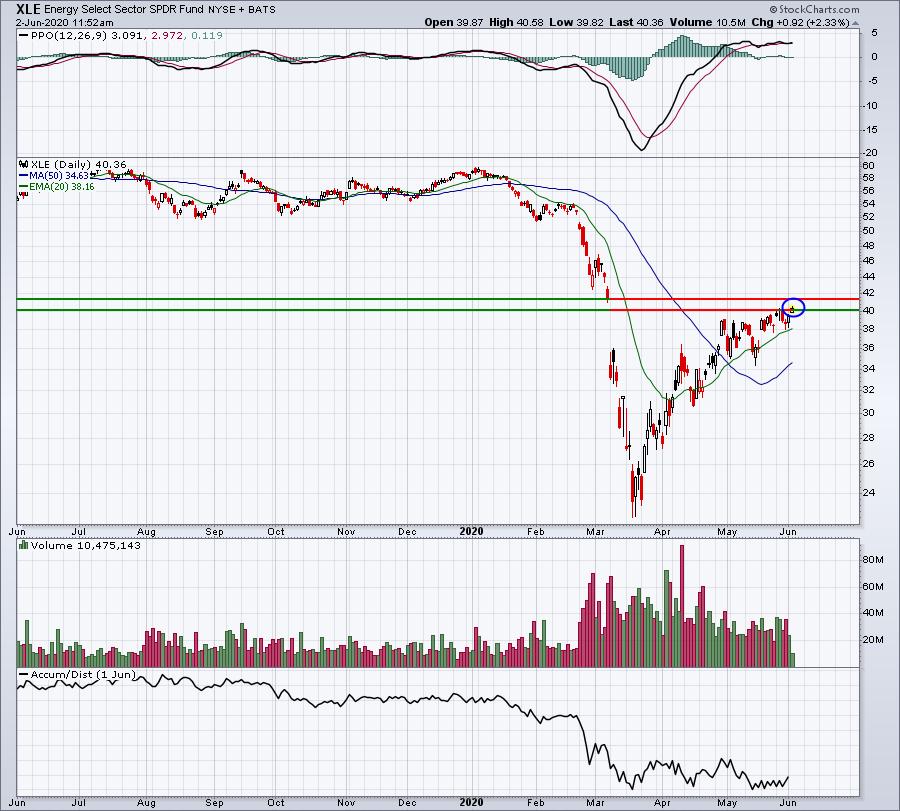
The more indices, the more sectors, that break out, the more technically bullish the overall market becomes. While I'm certainly not a fan of energy stocks overall because the U.S. Dollar Index ($USD) remains in a multi-year uptrend, in my opinion, those in favor of energy stocks can definitely trade the group, or individual stocks, from time to time. One energy stock that looks quite attractive to me is Hess Corp (HES), which is breaking out today:
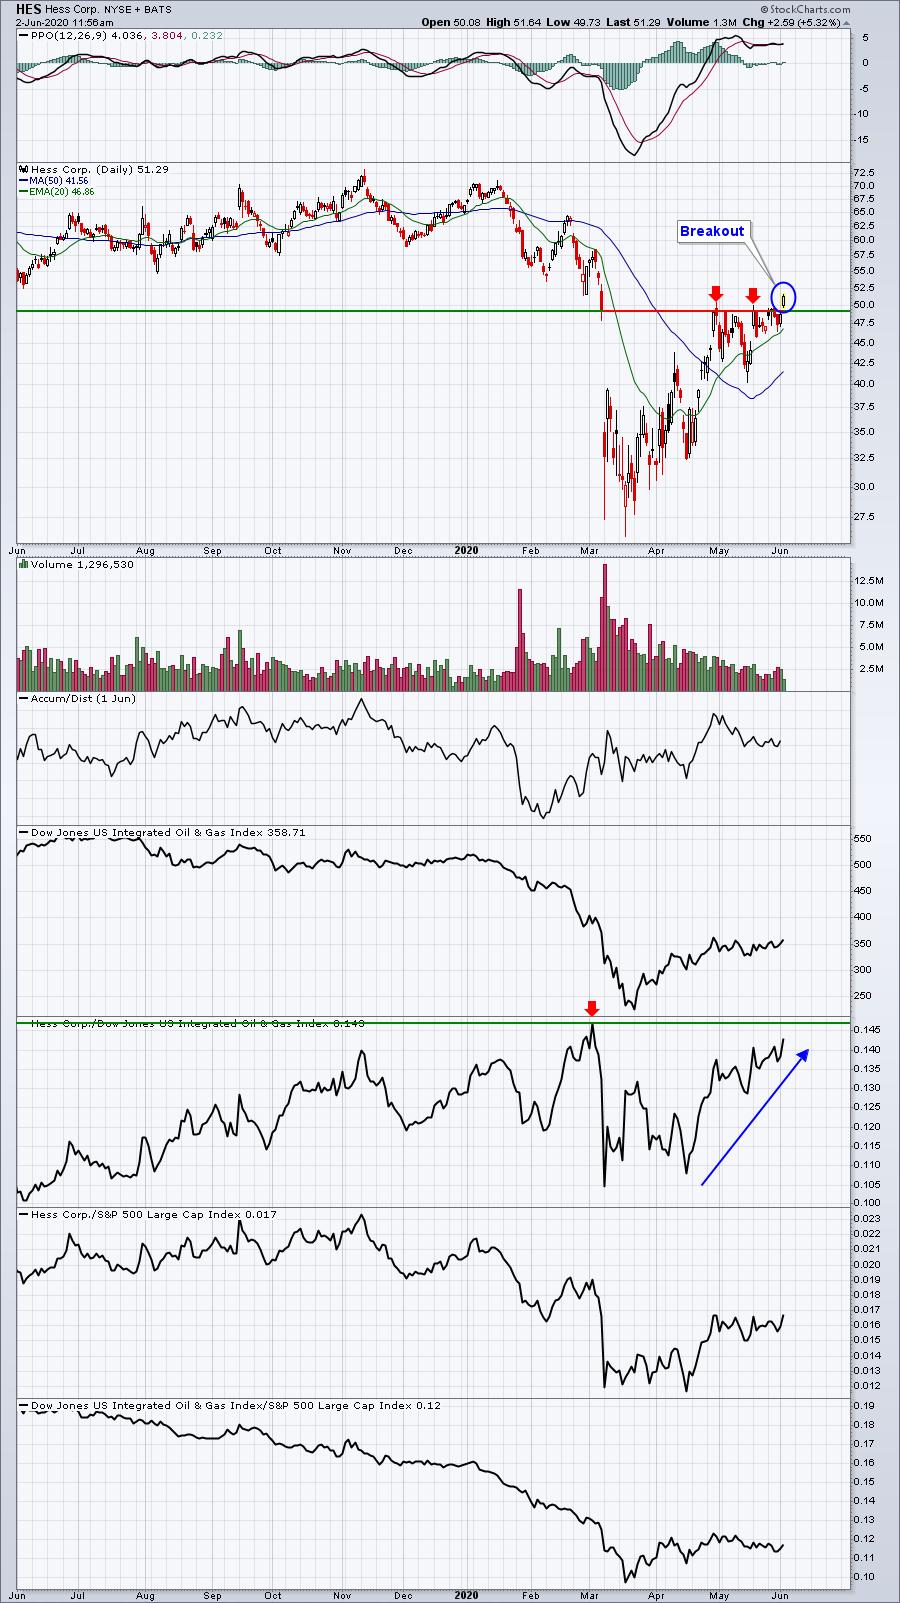
HES has been gaining strength vs. its peers and isn't far from breaking to a relative 52 week high. I like the clear price breakout as well. But any time I trade a stock that's not in favor or within group that's not in favor, I absolutely make sure I keep my stop in play. A close back below 49 would be one warning sign, but a close below the rising 20 day EMA would definitely take me out of HES.
ChartLists
I ran a high volume scan (greater than 0.7 times average daily volume as of noon ET) against the Short Squeeze ChartList and then further filtered it to stocks with SCTR scores of at least 90 and 5 stocks were returned as follows:
MRNA, AMRS, RH, ADT, LOVE
Here's my quick analysis of these 5:
MRNA - featured recently when it finally printed a higher daily high on Wednesday of last week. That reversed the short-term fortunes of MRNA as it quickly rebounded more than 20%. Today's opening gap below the 20 day EMA now sets the stock up for perhaps a symmetrical triangle. Key price and moving average support resides between 45 and 50.
AMRS - massive gain yesterday likely fueled, at least in part, by short sellers running for cover. The breakout occurred near 4.80 and today AMRS is trading down to test that 4.80 level:
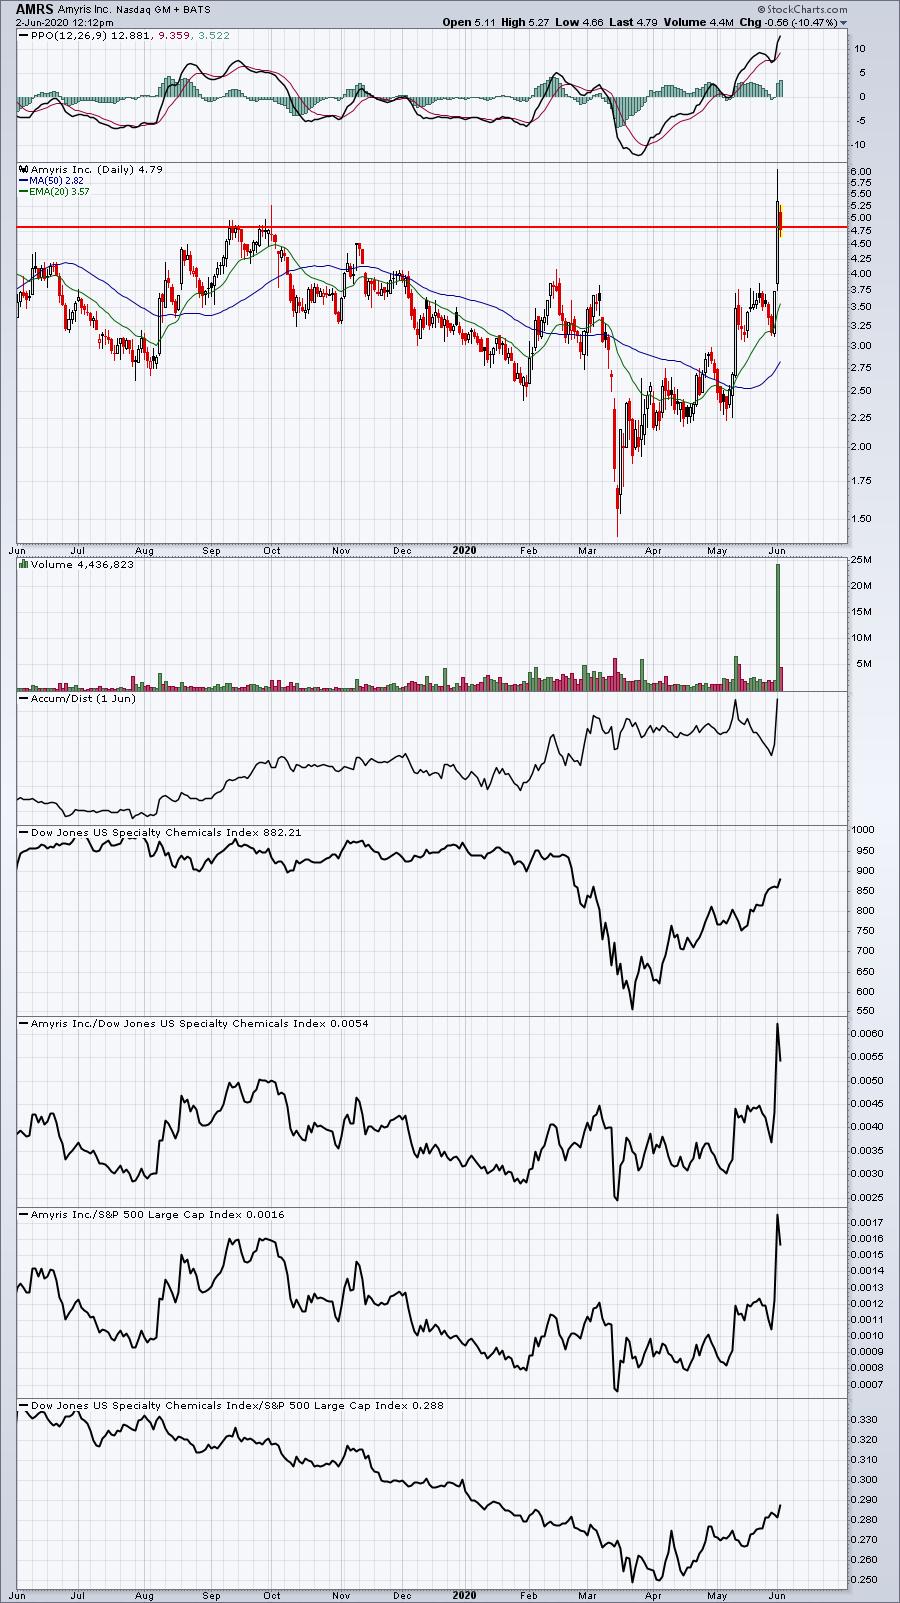
It's a very aggressive trade, but one that could pay off on a reversal later today. I'd be careful if today's earlier low was cleared to the downside.
RH - has been exploding since clearing price resistance near 166. Today it's jumping another 12.99% on very heavy volume. Shorts are in trouble on this one as RH speeds towards key price resistance at 255.
ADT - gapped higher on Monday, clearing key February price resistance near 7.25. I see the next stop on ADT to be 8.73. I would expect to see short-term support at 7.60.
LOVE - this one is interesting. The recent strength and above average volume certainly smells like short covering. But there's the threat today of a reversing bearish engulfing candle and a negative divergence is present. This suggests the risk to the downside has increased dramatically. If LOVE can reverse today and close back near its high, that would be incredibly bullish. But failure to do so increased the odds of further selling here, possibly all the way down to 12.50 to test mid-May lows:
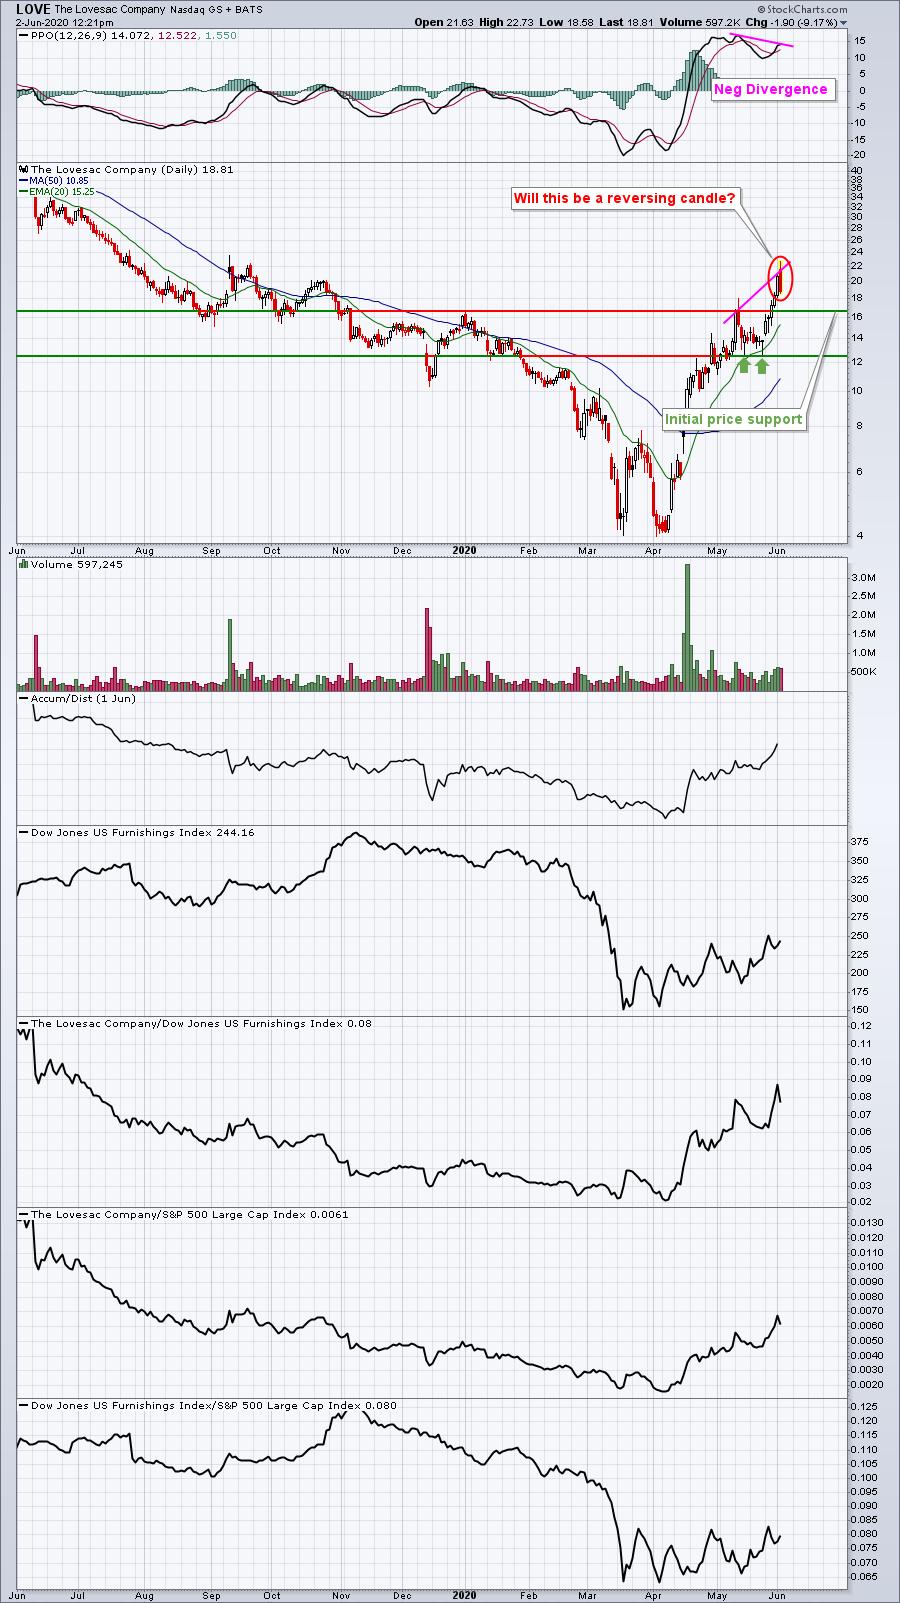
LOVE has definitely improved technically the past several weeks and I actually like the chart. But I don't want to ignore the short-term warning signs, especially if the stock finishes weak this afternoon.
Earnings Reports
Here are the key earnings reports for today and tomorrow, featuring stocks with market caps of more than $10 billion. I also include a few select companies with market caps below $10 billion. Finally, any portfolio stocks (or active trade alerts) that will be reporting results are highlighted in BOLD. If you decide to hold a stock into earnings, please understand the significant short-term risk that you are taking. Please be sure to check for earnings dates for any companies you own or are considering owning:
Tuesday, June 2:
ZM, CRWD, DCI, HQY, DKS, CBRL, AMBA
Wednesday, June 3:
CPB, GWRE, ESTC, SMAR, CLDR, GOOS, AEO, ZUO
Economic Reports
None
Happy trading!
Tom