
EB Daily Market Report - Wednesday, June 3, 2020
Executive Market Summary
- Futures were strong again and buyers remain out in force
- The Dow Jones has powered through another psychological level at 26,000 just a little more than a week after clearing 25,000
- All of our major indices are higher, though there's clear relative weakness on the NASDAQ as the NASDAQ 100 nearly reaches its all-time high close of 9718, set back in February
- Helping to fuel today's rally is a solid move higher in the 10 year treasury yield ($TNX), up 7 basis points to 0.75%
- Better-than-expected economic news, especially job losses well below expectations, is aiding the rotation to stocks from bonds
- Higher treasury yields are sending investors strongly back towards financials and industrials; expect this trend to continue as both sectors were beaten up badly on a relative basis
- Gold ($GOLD) is down 1.75% and is nearly $1700 per ounce; crude oil is also down 0.90%
- Zoom Video Conferencing (ZM, +5.72%) blew past revenue and earnings estimates
Market Outlook
Don't look now, but the NASDAQ 100 ($NDX) is bumping up against all-time high resistance. Yep, you heard it right. ALL-TIME HIGH resistance! 2 1/2 months after one of the steepest and most dramatic selloffs of our lifetime, this index of large cap, growth companies is threatening a major breakout in one of the best comeback stories ever. Check out the extent of this rally:
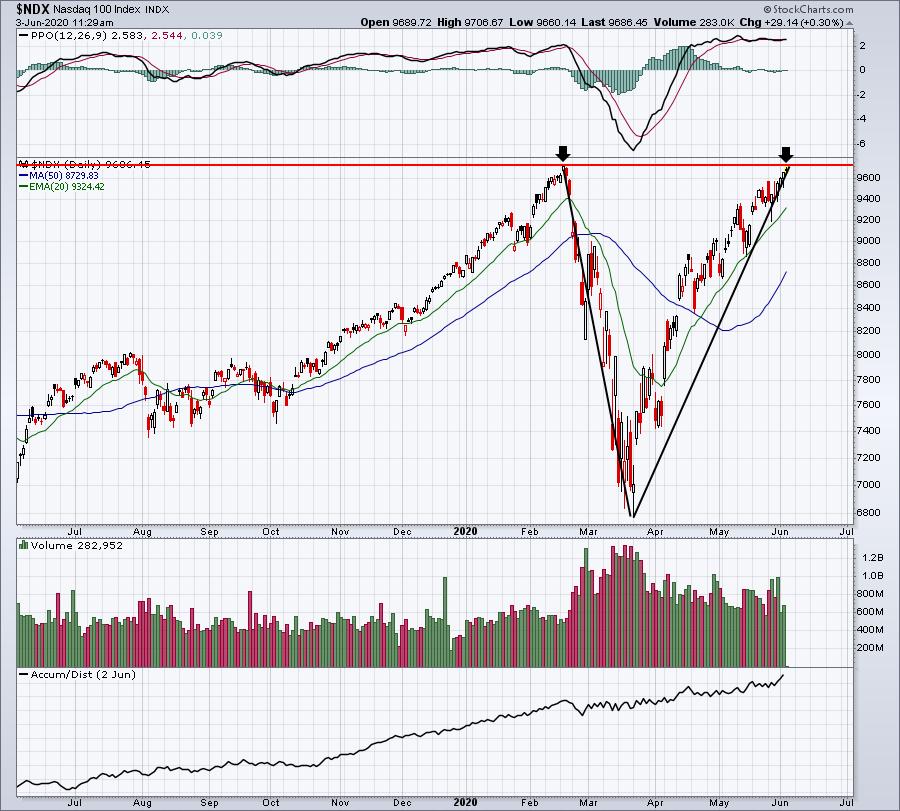
I actually read an article two days ago where the author was still calling for a "U" bottom. Ummm, hello?
If the NASDAQ is going to underperform for a period, now will likely be the time. Sellers at major resistance on the NDX could likely pile into the Dow Jones, S&P 500, mid cap ($MID), and small cap ($SML) stocks. I believe that's what has started to happen. I still love the high growth NASDAQ names, but a period of relative selling or consolidation wouldn't be a bad thing for this market at all. In fact, as a secular bull market believer, I'd welcome it with open arms.
Sector/Industry Focus
Health care (XLV) is definitely lagging and not participating in this latest bull market push higher. But that's okay. While it would be nice if it were true, stocks don't make money for us every day. If you choose to leave health care stocks for a period of time, it's understandable. Right now, other areas of the market are seeing a lot more love. Just be prepared to step back in when leadership there returns.
One problem with the XLV is that medical supplies ($DJUSMS) is the only industry group in health care where slowing momentum (negative divergence) isn't a problem. I have written a lot of bullish comments on biotechs ($DJUSBT), and I remain staunchly in the bulls' camp on this group, but we can't ignore short-term momentum concerns. So for the short-term bearish case, let's look at a daily chart:
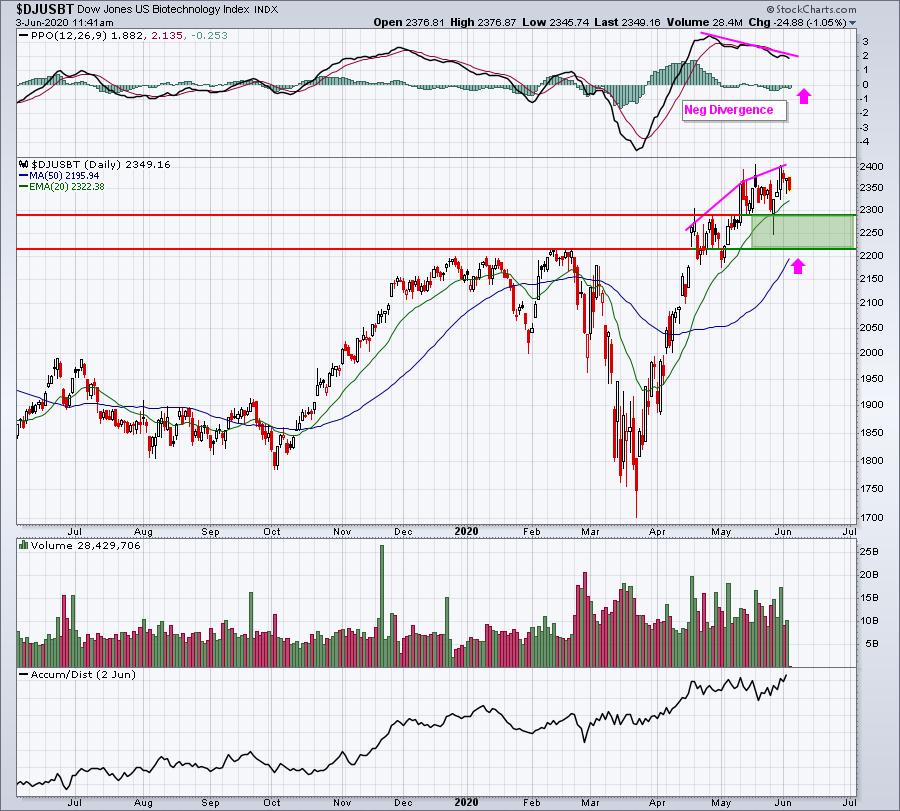
Now maybe the biotechs blast off from here, but if they don't, I wouldn't grow overly bearish. Just understand that they've had a tremendous run, there are short-term momentum issues and a pullback would set up awesome reward to risk trades. So short-term traders, be careful here.
How about turning our attention to the weekly chart now?
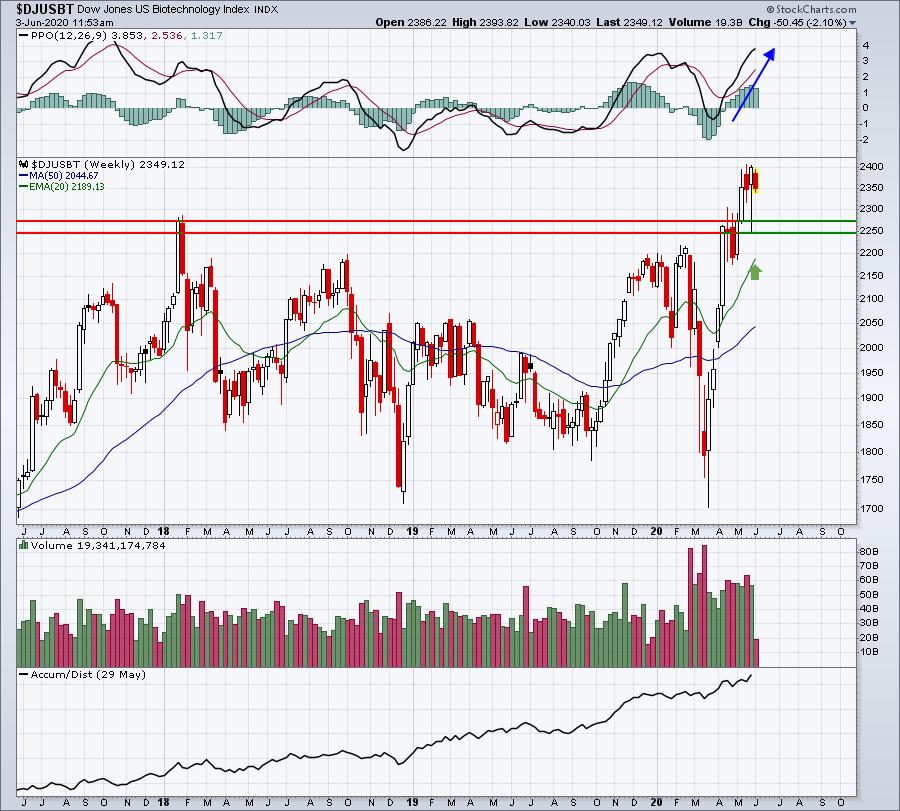
Biotechs have a very strong weekly chart. The weekly PPO shows no signs of slowing momentum. If anything, the weekly momentum is bullish and accelerating. Therefore, I'd argue that any short-term weakness due to slowing momentum on the daily chart plays perfectly into the hands of building positions in biotechs based on longer-term strength.
ChartLists
I would no longer view the Weak AD ChartList bearishly. Given the recent surge in the Dow Jones, mid caps ($MID), small caps ($SML), etc., I believe the entire market is now beginning to participate in the resumption of the secular bull market. What I would do, however, is consider the Weak AD stocks that are not only rising and breaking out, but also showing relative strength.
First, let me show you the type of chart I'd avoid:
PLAY:
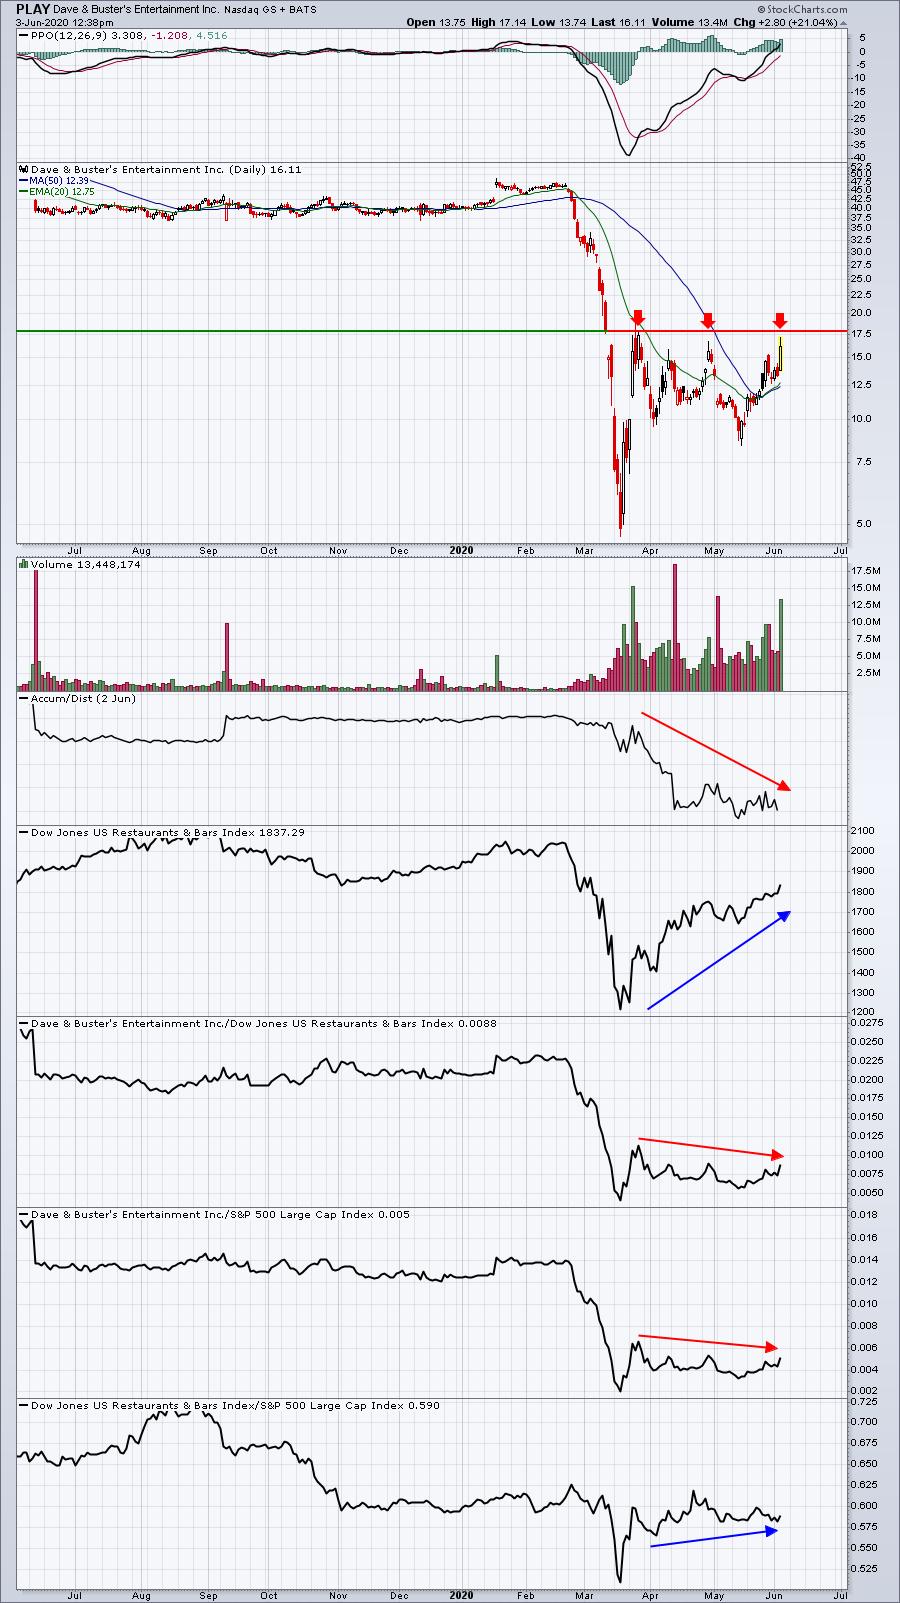
Restaurants & bars ($DJUSRU) have been showing better absolute and relative strength of late, but despite that, PLAY has yet to breakout and its relative weakness vs. both its peers and the benchmark S&P 500 is worrisome. PLAY is the best performer today in the Weak AD ChartList, but I still feel there's more work left to be done here.
Instead, I would look first at the entire Weak AD ChartList and sort it by SCTR score. The SCTR is a measure of relative strength. Here are the SCTR scores currently above 70 on this ChartList:
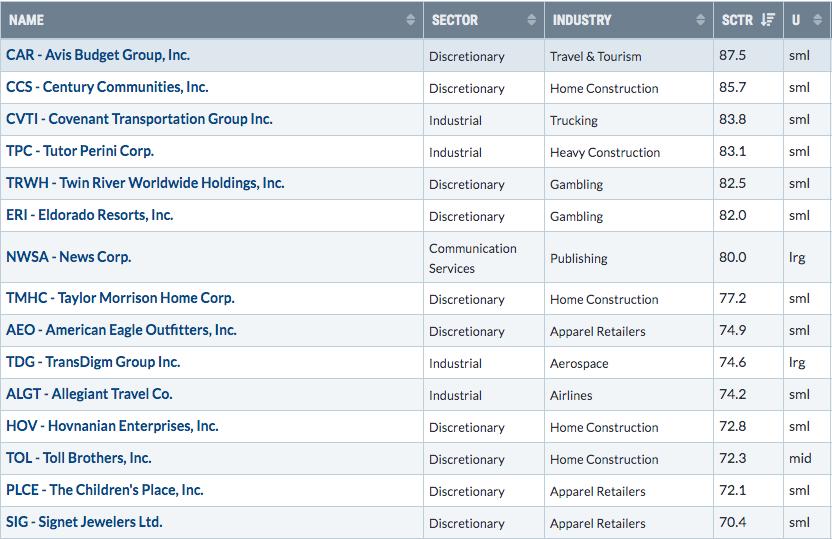
Most of these are small cap stocks. Also noteworthy is the fact that the majority of these stocks fall into the consumer discretionary area. That's interesting because the stock market now believes those stocks are not in nearly as bad shape as they thought they were going to be. Therefore, money is quickly pouring back into them.
ERI:
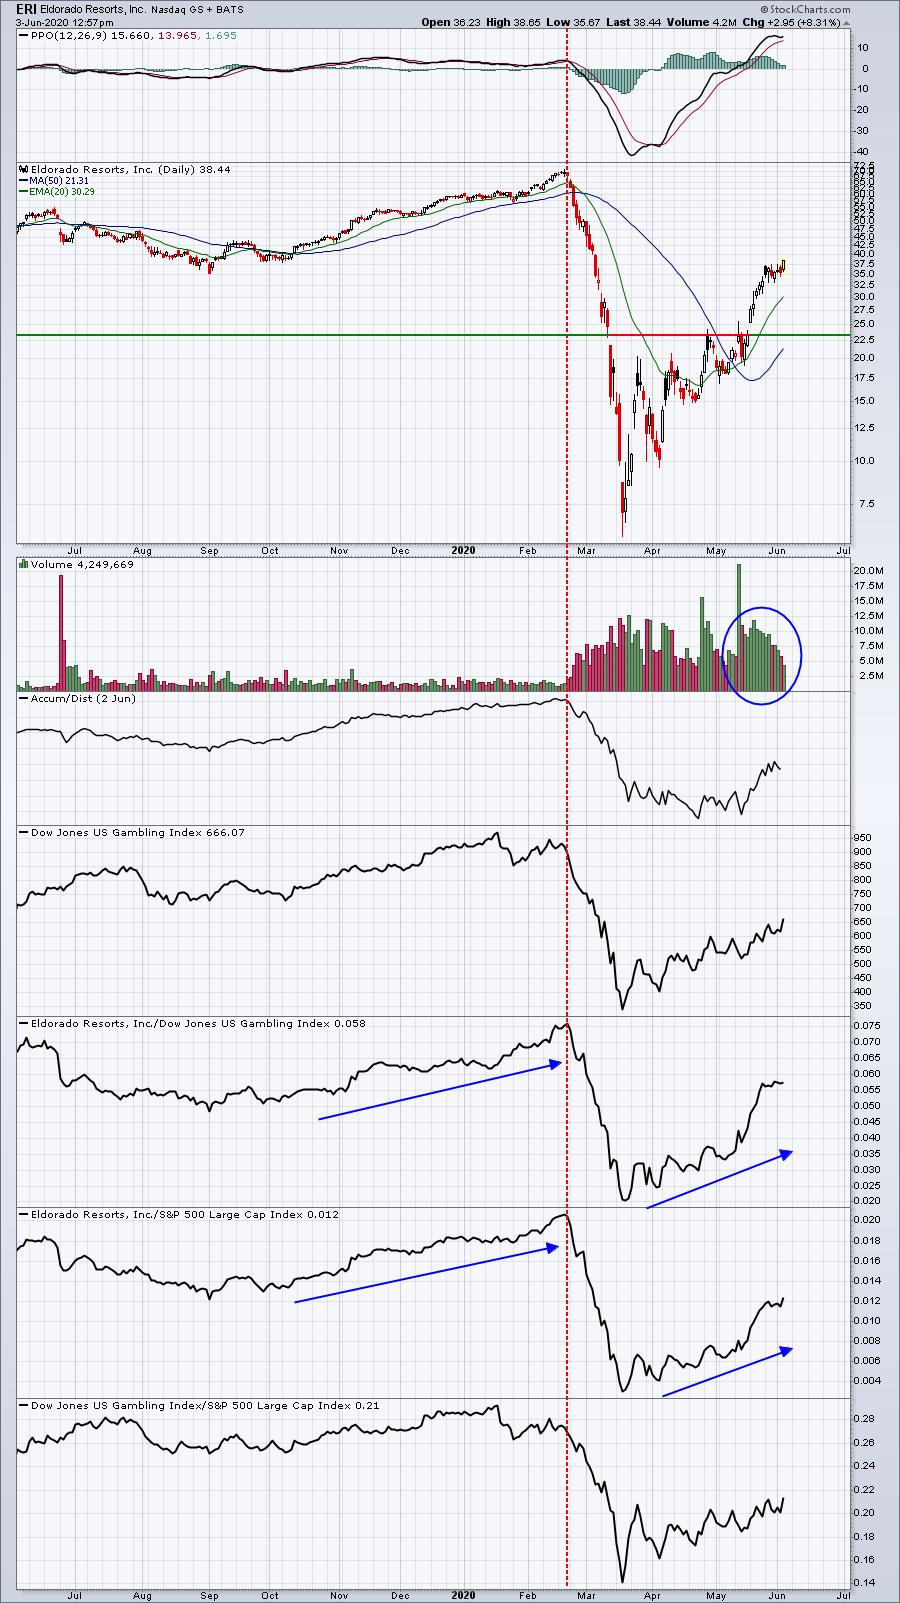
ERI was a relative leader in the strong gambling area in February. The pandemic completely changed how the market perceived this company and this industry group, though. Now that the market is growing more optimistic with state economies reopening, ERI has once again returned to a leadership role in a rapidly-improving industry.
TMHC:
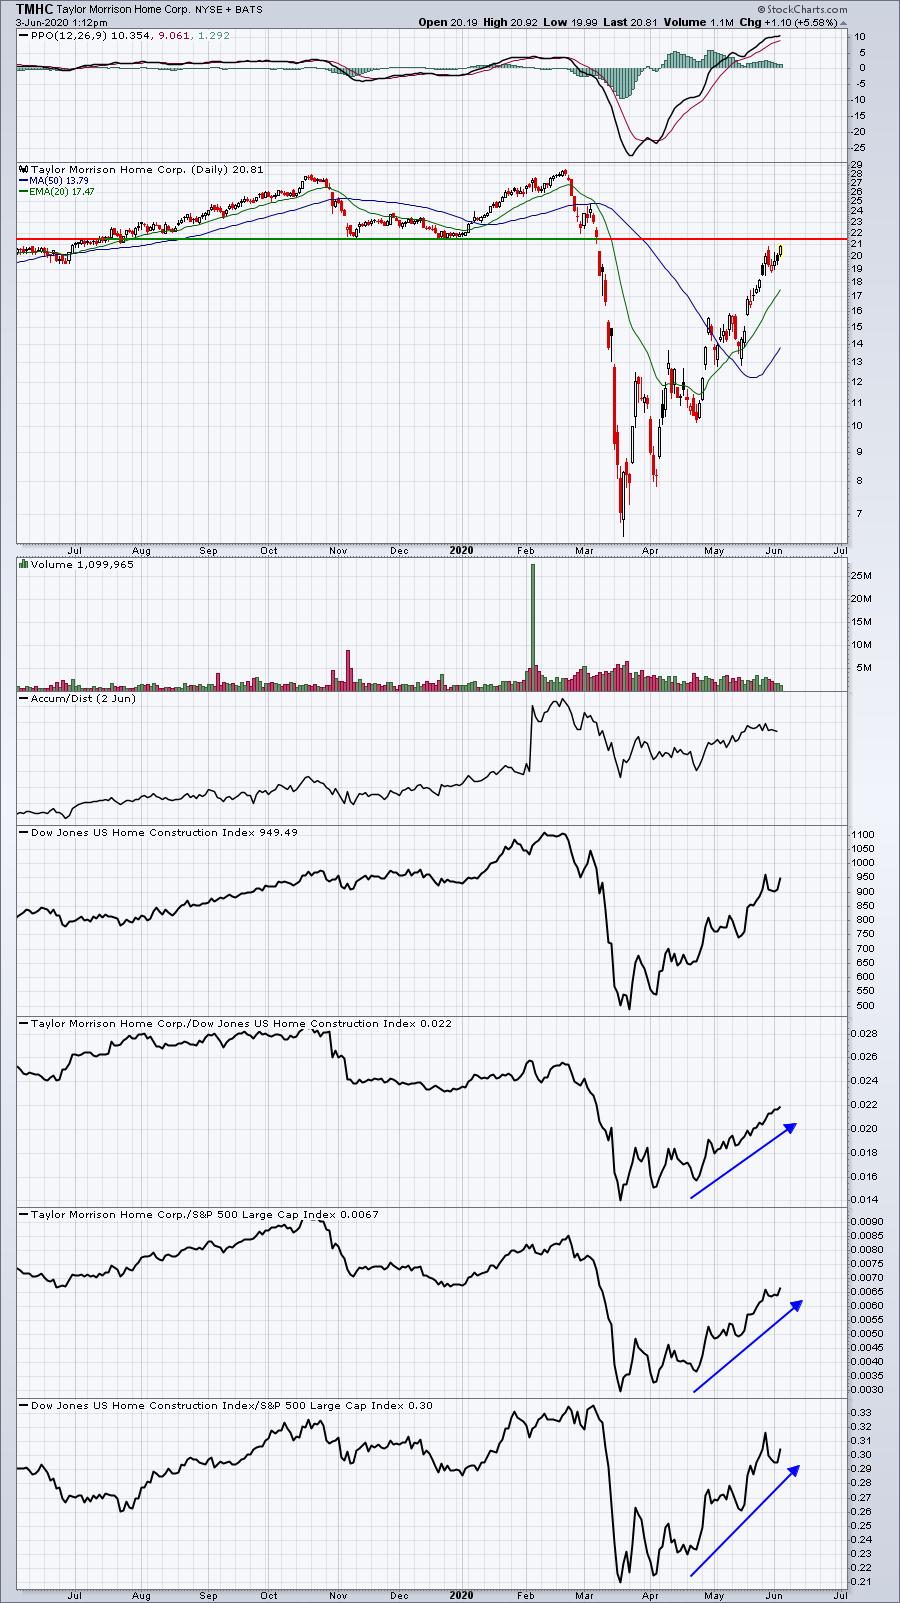
TMHC is facing some overhead price and gap resistance, but ever since home construction ($DJUSHB) began rising on an absolute and relative basis, TMHC has been helping to lead the charge. So once again, this is a stock that is showing leadership within a strengthening industry.
These are the types of stocks on the Weak AD ChartList that would interest me.
Earnings Reports
Here are the key earnings reports for today and tomorrow, featuring stocks with market caps of more than $10 billion. I also include a few select companies with market caps below $10 billion. Finally, any portfolio stocks (or active trade alerts) that will be reporting results are highlighted in BOLD. If you decide to hold a stock into earnings, please understand the significant short-term risk that you are taking. Please be sure to check for earnings dates for any companies you own or are considering owning:
Wednesday, June 3:
CPB, GWRE, ESTC, SMAR, CLDR, GOOS, AEO, ZUO
Thursday, June 4:
AVGO, DOCU, WORK, COO, MDB, SJM, CIEN, MTN, TTC, SAIC, RH, GPS, NAV, SCWX
Economic Reports
May ADP employment report: -2.76 mil (actual) vs. -8.66 mil (estimate)
May PMI services: 37.5 (actual) vs. 36.9 (estimate)
April factory orders: -13.0% (actual) vs. -14.0% (estimate)
May ISM non-manufacturing: 45.4 (actual) vs. 44.0 (estimate)
Happy trading!
Tom