
EB Daily Market Report - Friday, June 5, 2020
Executive Market Summary
- Futures were very strong, especially on the Dow Jones
- The Dow Jones is leading today and is currently higher by nearly 1000 points
- The S&P 500 had resistance at 3130, right? Ummm, no more...the S&P 500 is now at 3200
- The NASDAQ, while lagging, is at an all-time high above 9800 at the time of this writing
- May nonfarm payrolls stunned everyone; instead of a huge hit to jobs, there were 2.5 million added
- May unemployment was still very high at 13.3%, but well below estimates looking for nearly 20.0%
- The 10 year treasury yield ($TNX) is surging higher, up 11 basis points to 0.93%
- The improving economic picture is crushing gold ($GOLD), which is down 3%, or $52, to $1675 per ounce
- Crude oil ($WTIC), on the other hand, is spiking to $39 per barrel, up 4.38%
- All 11 sectors are up, but the outperformers are energy (XLE, +6.42%), industrials (XLI, +4.56%), and financials (XLF, +4.35%)
- Recreational services ($DJUSRQ, +12.77%) and airlines ($DJUSAR, +11.00%) are soaring; REITs are also having a strong day
- Sentiment issues the market had yesterday have taken a back seat to the hugely positive payrolls report
Market Outlook
We have a raging bull market on our hands. The Dow Jones today is pushing through 27,000 - the third 1,000 point psychological barrier it's cleared in 8 trading sessions. We are clearly trading in upside down fashion. By that, I mean that many recent leaders are not participating in this advance, while laggards are surging higher. The stay at home beneficiary companies like Zoom (ZM), Peloton (PTON), Netflix (NFLX), etc. have really struggled in recent sessions and Slack (WORK) has been hammered today after delivering revenues and EPS that beat expectations. Weakness in those companies will provide great opportunities in my view. However, we cannot ignore the fact that the stock market is concentrating on state economies reopening and what that means to those companies that were completely beaten up in March and April. High short interest in many of those stocks is triggering a burst of short covering as well. Airlines ($DJUSAR) and recreational services ($DJUSRQ) are rocketing to the upside. Their futures have definitely become brighter as economies reopen, but I'm still not a big fan of betting on these types of companies longer-term. In the short-term, however, traders are in love with the previously unloved.
One strategy to consider if you're trading these companies with a new leash on life is to stick with them as long as they continue to print higher highs and higher lows. When that trend ends, one strategy would be to simply exit. If you believe the current trend will continue for quite awhile, and that this isn't a temporary move higher, then watch that rising 20 day EMA and give these stocks room to push higher, consolidate, then push higher again. That's what they've begun to do. As an example, look at Wynn Resorts (WYNN), a stock that I currently own. It's on our Short Squeeze ChartList and I've discussed it several times in recent weeks, suggesting that I wanted to see the breakout above 90. Well, it's broken out and now is moving higher each day. I plan to hold at least until the pattern of higher highs and higher lows is broken:
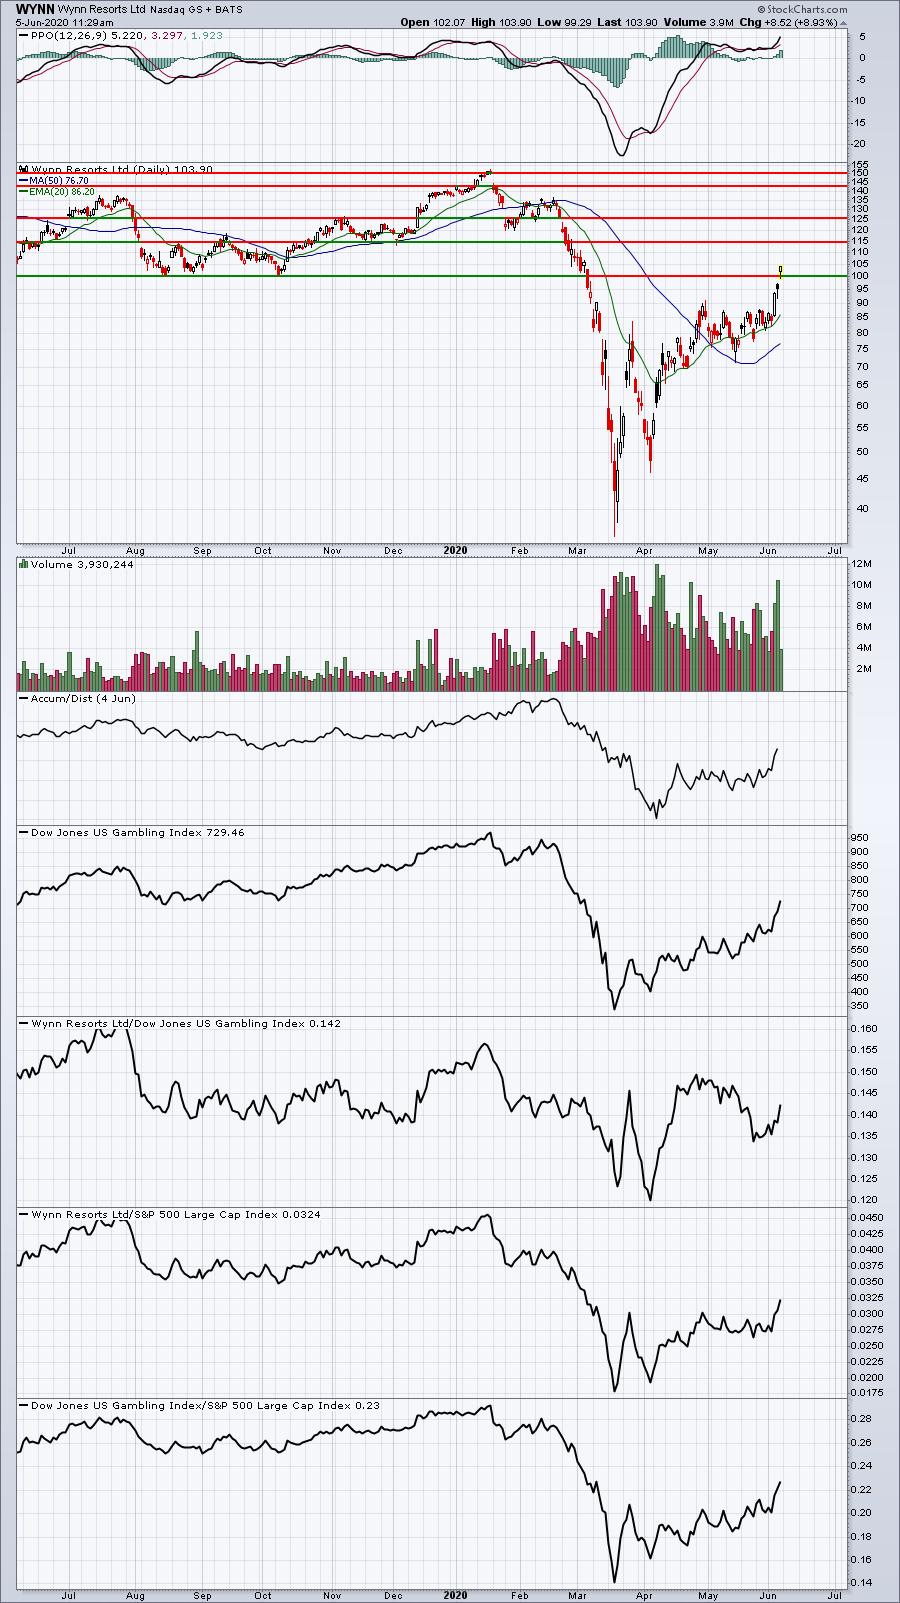
WYNN looks very solid after making its breakout above 90. A few days ago, I wrote about Eldorado Resorts (ERI), which also belongs to the gambling industry ($DJUSCA). To be quite honest, I like ERI better than WYNN, but I didn't catch the breakout there. On a relative basis, however, ERI has been the better performer.
As you consider your approach and strategy in this market, do not ignore relative strength. In my humble opinion, it's always better to trade relative leaders amongst its peers.
Sector/Industry Focus
One industry group that I believe has recently begun a trek higher is defense ($DJUSDN). This group is only up 3.6% today, but it's broken out and has much more room to the upside:
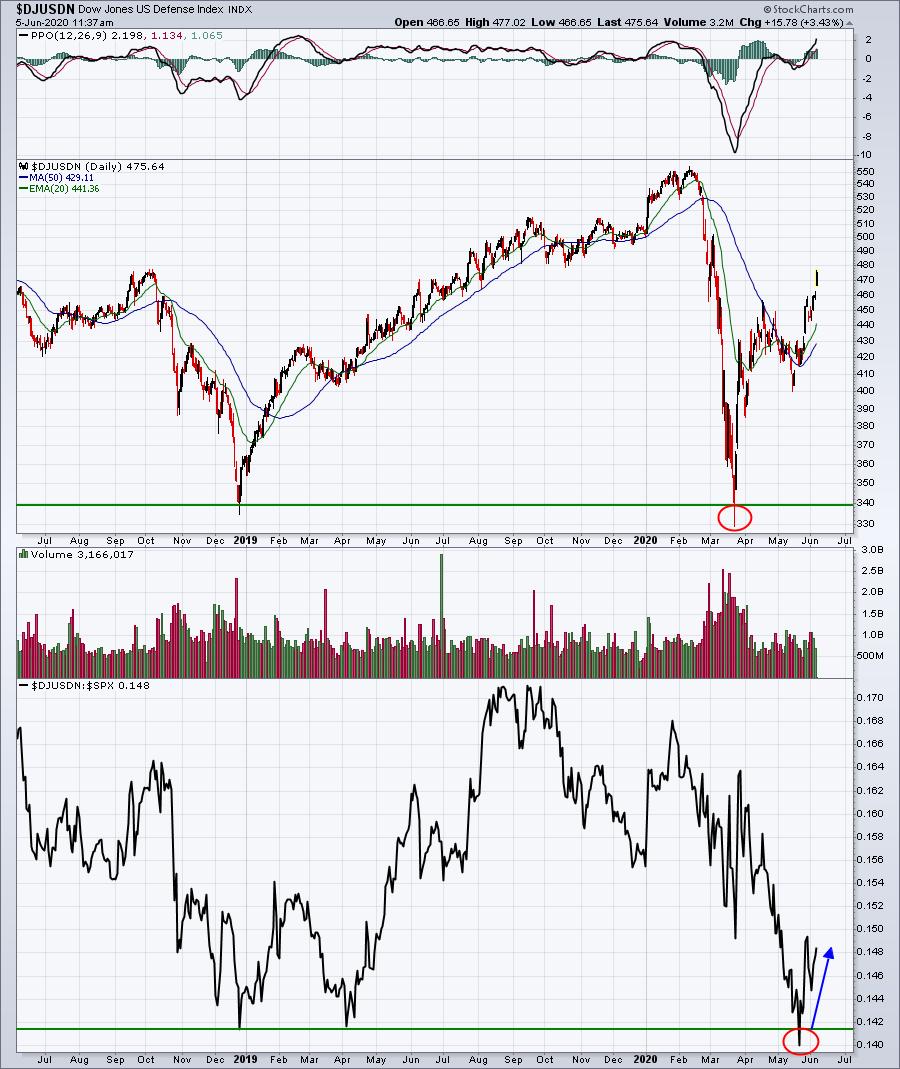
The breakout in the DJUSDN above the 460-470 was technically important and I believe will lead to further gains. Both absolute and relative support levels were broken during the pandemic, but now we're seeing an absolute price breakout, along with a surge in relative strength. I believe there's further to go here.
ChartLists
Given what I just discussed on the defense industry above, I wanted to see which defense stocks we have currently on our various ChartLists.
Strong Earnings ChartList (SECL):

Strong AD ChartList (SADCL):

Weak AD ChartList (WADCL):

Short Squeeze ChartList (SSCL):
None.
I looked at all the above defense stocks and wanted to comment on the following:
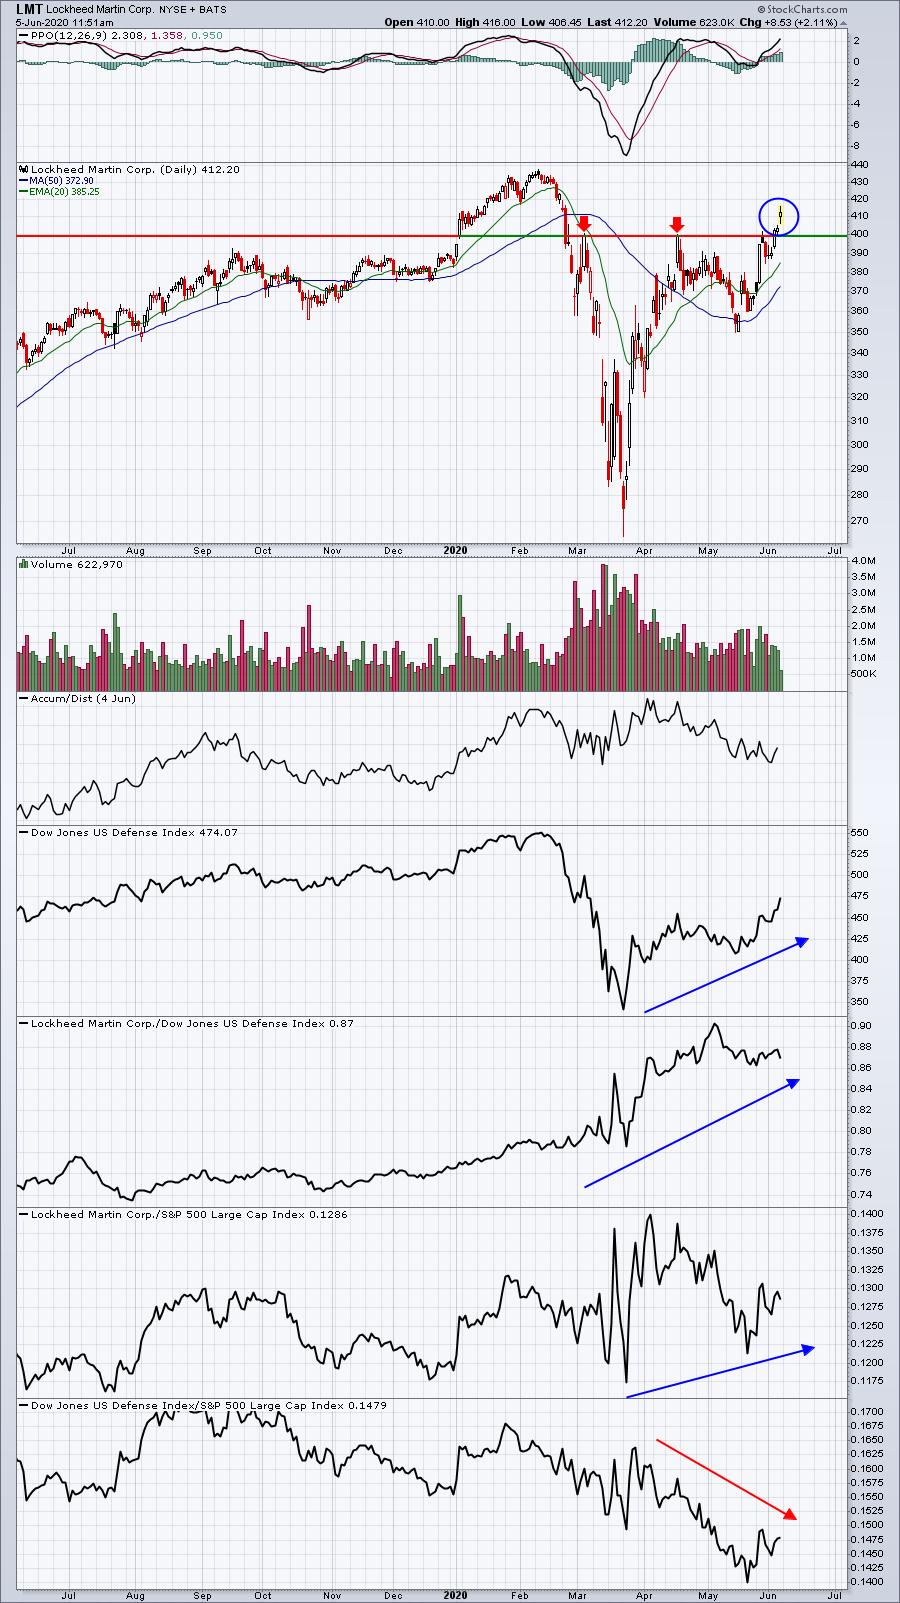
LMT:
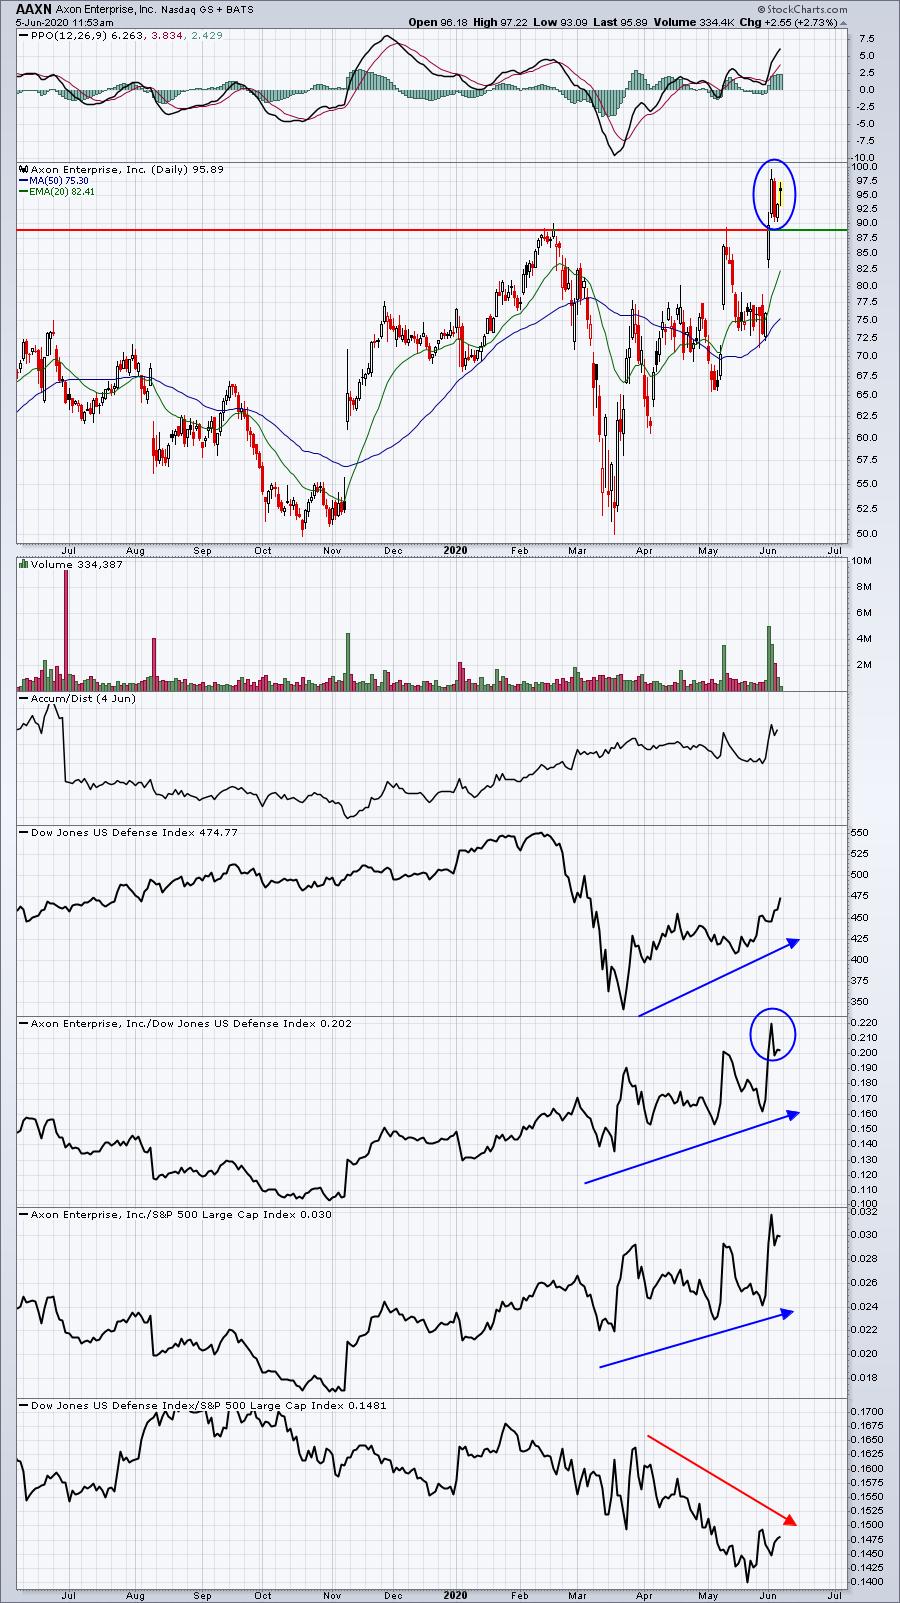
AAXN:
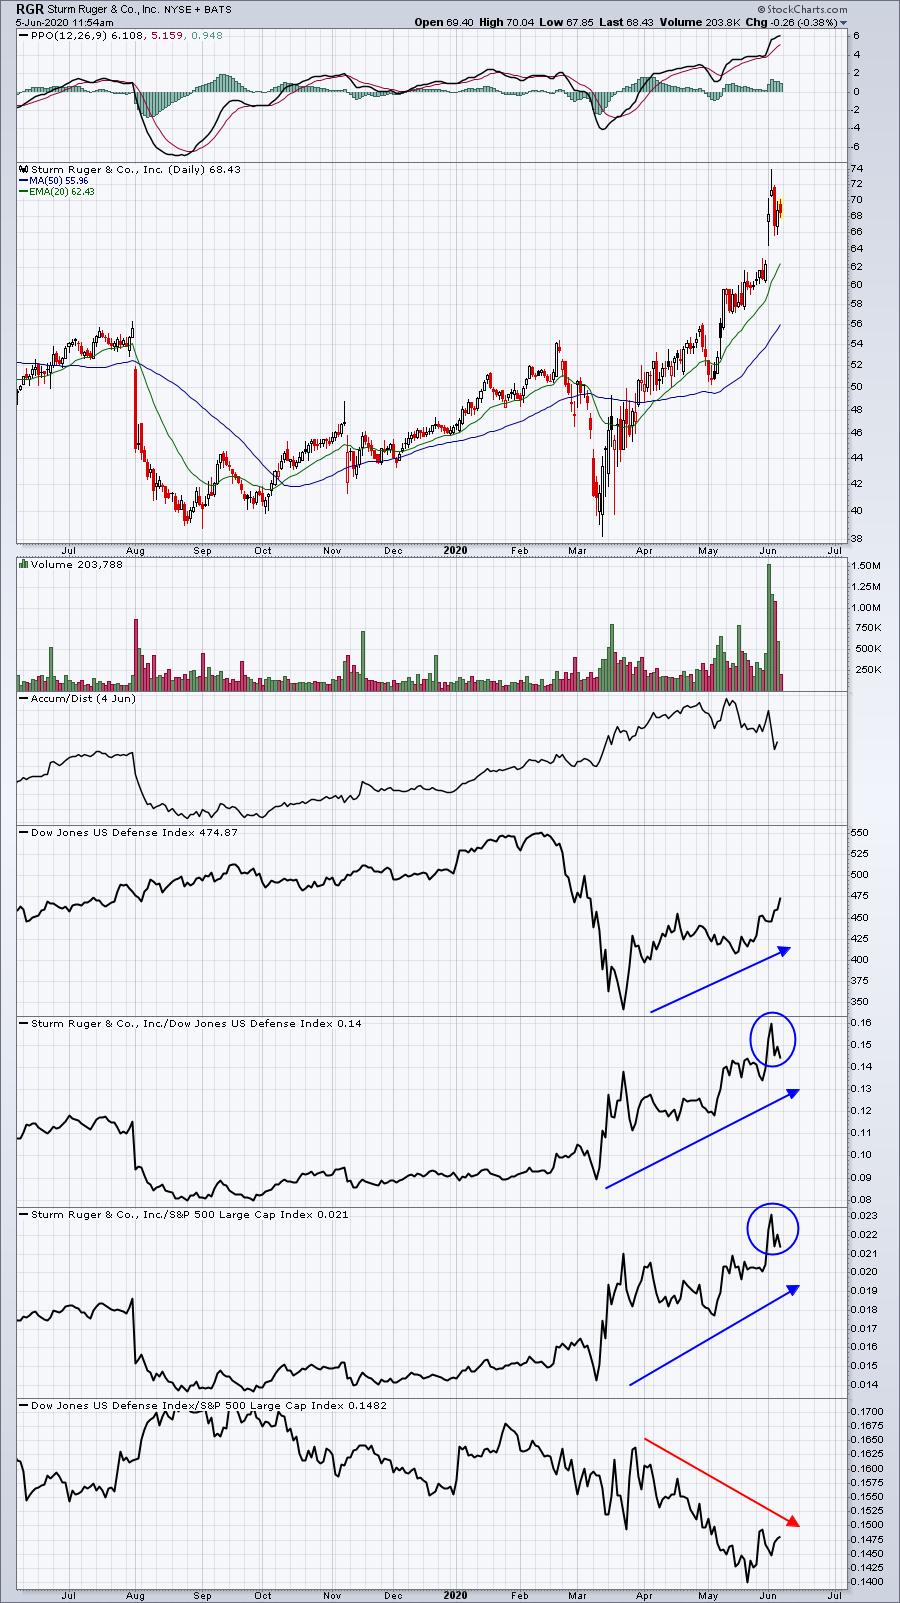
RGR:
CUB:
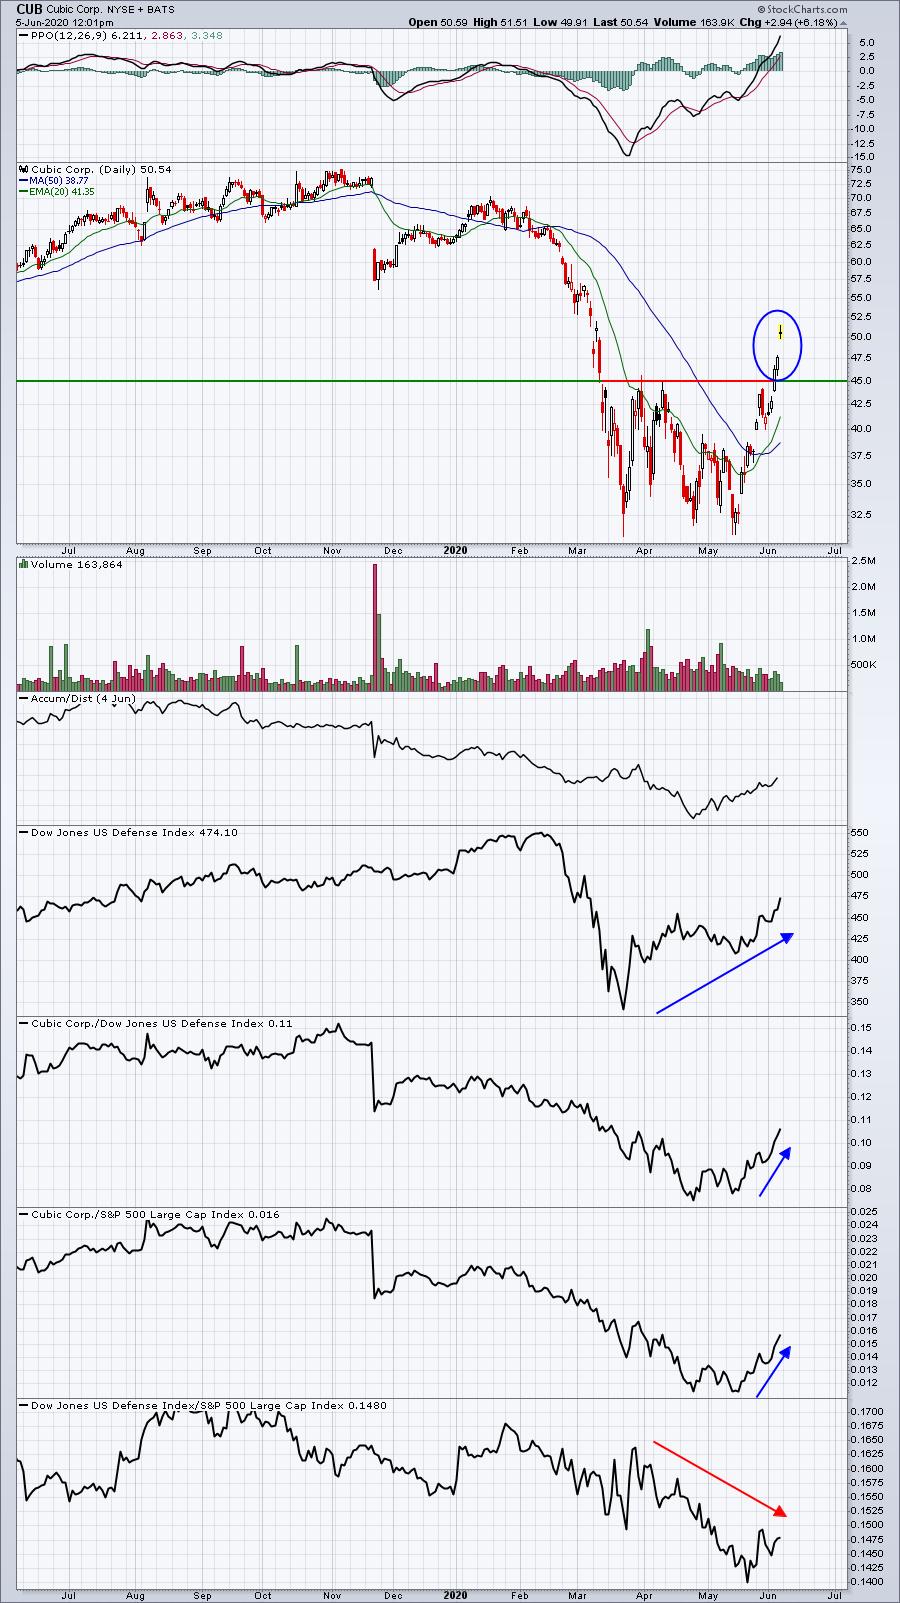
As I look at the four stocks above, there's one common thread among the first three. They are all leaders vs. their defense peers. The DJUSDN has been moving lower vs. the S&P 500, yet all three of these defense stocks have performed quite well on a relative basis to that benchmark. LMT provides perhaps a bit more safety simply because it's a large cap stock. But the two small cap stocks, AAXN and RGR, are showing both absolute and relative breakouts to 52 week highs. That's the type of leadership I want in my portfolio. So while I like all three, I might prefer the smaller stocks simply because they've been so strong on a relative basis. RGR had a huge move higher and is now consolidating, which will likely frustrate longs that are watching other defense stocks doing better today. But that will likely provide a solid opportunity in RGR, especially if it were to pull back closer to 66 where it's found support recently.
Then there's CUB. The recent mentality in the market is to buy the laggards. That's where CUB fits in. From its relative strength panels below its price chart, you can see that CUB didn't begin outperforming until the market made its recent shift to love the unloved. CUB fits that mold and could have much further to go if Wall Street sticks with these beaten-down stocks.
Hopefully that gives you a glimpse as to how I work my way through the market to find a group and a stock that I would consider trading.
Earnings Reports
Here are the key earnings reports for today and tomorrow, featuring stocks with market caps of more than $10 billion. I also include a few select companies with market caps below $10 billion. Finally, any portfolio stocks (or active trade alerts) that will be reporting results are highlighted in BOLD. If you decide to hold a stock into earnings, please understand the significant short-term risk that you are taking. Please be sure to check for earnings dates for any companies you own or are considering owning:
Friday, June 5:
None
Monday, June 8:
COUP, CASY, THO, SFIX
Economic Reports
May nonfarm payrolls: 2,509,000 (actual) vs. -7,725,000 (estimate)
May private payrolls: 3,094,000 (actual) vs. -6,500,000 (estimate)
May unemployment rate: 13.3% (actual) vs. 19.8% (estimate)
May average hourly earnings: -1.0% (actual) vs. +0.9% (estimate)
Happy trading!
Tom