
EB Daily Market Report - Tuesday, June 9, 2020
Executive Market Summary
- Futures were lower and we've seen an attempted rebound, but failure thus far
- Rotation is showing a shift back to the NASDAQ as more normal action takes place today
- Technology (XLK, +0.21%) and health care (XLV, -0.35%) are the two leading sectors
- Energy (XLE, -3.97%) and financials (XLF, -2.95%) are the laggards
- Crude oil prices ($WTIC) are down slightly, but the 7 basis point drop in the 10 year treasury yield ($TNX) to 0.82% is no doubt encouraging profit taking in financials....and in industrials (XLI, -2.46%)
- AMD and NVDA are helping to lead technology; computer hardware ($DJUSCR) also is lending a hand with AAPL higher by nearly 3%
- Strong AD ChartList stocks are overpowering the Weak AD ChartList stocks as we see rotation back to what was working throughout March, April, and May
Market Outlook
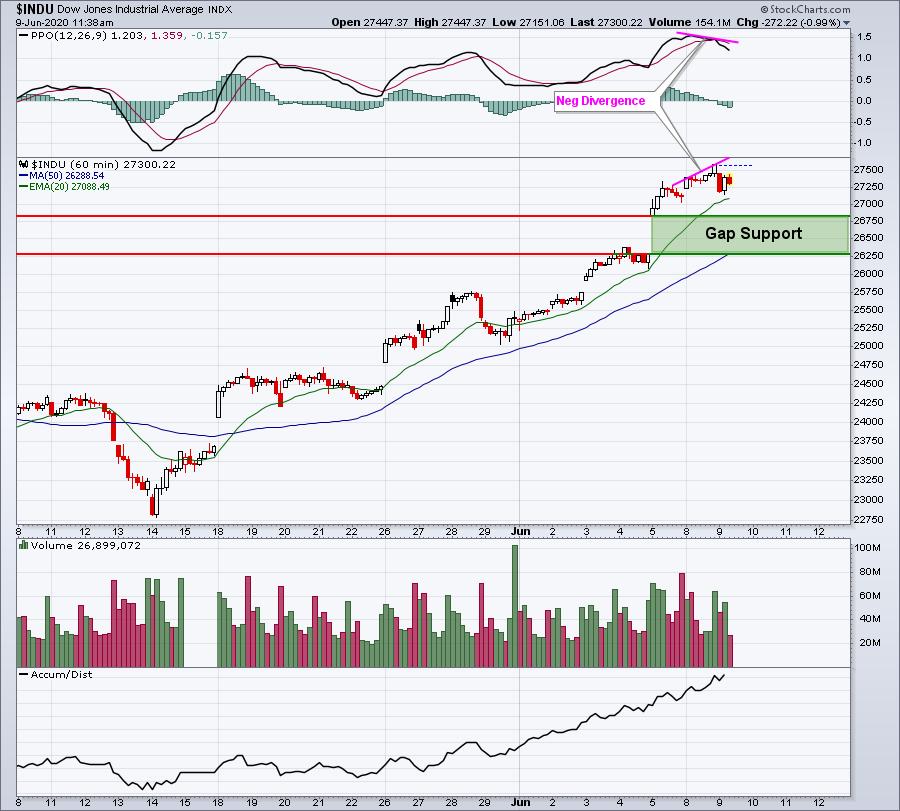
We've seen such bullish action the past couple weeks, especially on the Dow Jones and S&P 500 that it's difficult to imagine much selling, but there are three reasons why we could see the first real selling since May 28-29 on the Dow Jones:
- There's a slight negative divergence on the Dow's hourly chart
- We've marked a lower intraday low for the first time in seven trading sessions
- We're in a period (7th through 10th) when we typically see profit taking
IF we do pull back, I would expect it to be very mild and last only a day or two. Here's the Dow's hourly chart:
While the overall market is only down mildly today, we're seeing rotation again. This time, the Weak AD ChartList stocks are taking on the sellers. There is not a single stock on this ChartList that's up 3% or more. Meanwhile, there are 25 such stocks on the Strong AD ChartList. If I'm going to go down with a ship, I'd rather it be the Strong AD ChartList stocks. In other words, make sure you keep your stops in place on ALL trades, but especially the Weak AD ChartList stocks. I continue to believe that longer-term, the Strong AD ChartList will perform much better. Perhaps today is the day where we see another significant swing in this rotation.
Sector/Industry Focus
Energy (XLE) has definitely seen renewed absolute and relative strength, but today's action thus far appears to leave yesterday's XLE trading on an island. If we finish weak today, then I believe we have a short-term island top on the XLE. It suggests that we be very careful in the near-term with perhaps better entry opportunities ahead. I want to emphasize that these patterns tend to be short-term only, especially given the strength in the XLE's PPO right now:
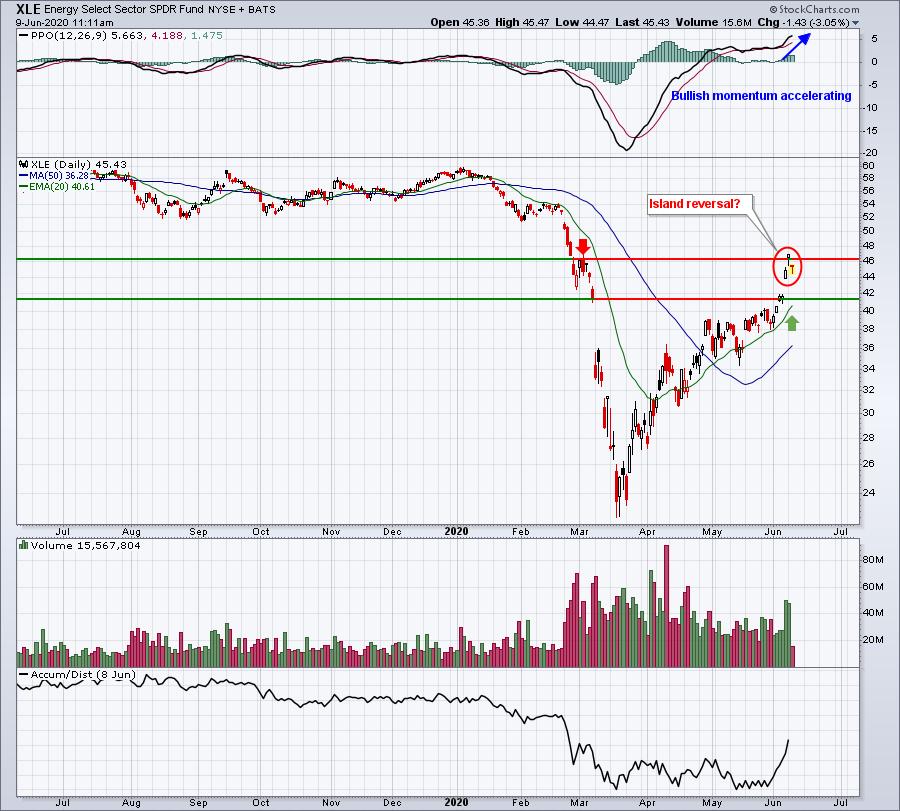
Don't misinterpret what I'm saying here. I remain very bullish U.S. equities. I'm speaking from a short-term trader's perspective when I talk about island reversals. I could be bearish the XLE today and bullish on Thursday. So I'm not making any long-term suggestions. I will many times take profits on a stock even if I believe the stock will eventually turn higher. I simply don't take profits for granted. I like to capture them and look for another solid reward to risk trade.
An example of taking profits on the first sign of weakness would be Wynn Resorts (WYNN). I bought it on the breakout and have set stops beneath the prior day's low each of the past four trading sessions. I got stopped out early today - but with a profit intact:
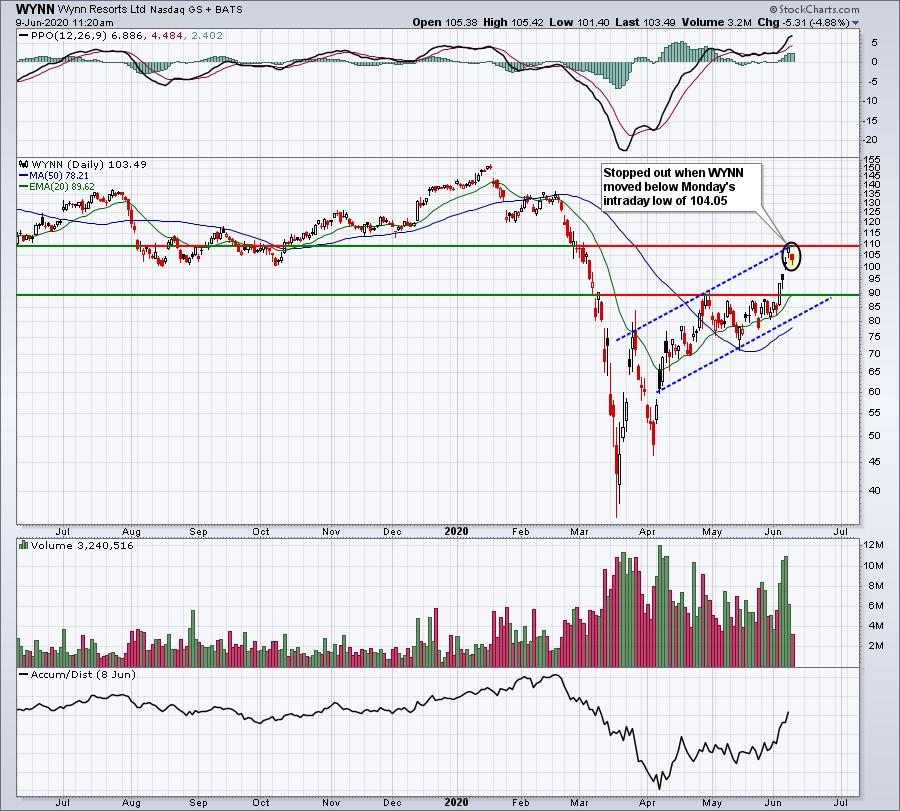
WYNN had been an underperformer, but like so many other underperforming stocks, it's been a leader the past couple weeks. Maybe it continues, maybe it doesn't. But what I now know is that the prior breakout near 90 becomes price support and if I don't capture profits, there's a reasonable chance that WYNN could simply consolidate between that 90 support and yesterday's high near 109. Suddenly, the reward to risk no longer favored me so I followed the "bird in the hand is worth two in the bush" theory. It also follow that old Wall Street adage, "you can't lose money taking a profit". To be successful in trading, you must stick to a plan and be disciplined. That's why I sold. I would buy it back near 90, if it were to get there.
ChartLists
Honestly, I wasn't quite sure how long the love affair would last for those stocks on our Weak AD ChartList, but that love has certainly turned sour today. Therefore, if you're looking to trade any of these stocks on weakness, I'd likely only do it at key price support and/or the rising 20 day EMA. That way, I can keep my stops tight and any potential losses small.
From a Strong AD ChartList and Strong Earnings ChartList perspective, I'd be very interested in stocks that come up on our Downtrend Reversal scan, which is provided on our website under "Scanning Strategies". Here are a few that resonate with me, all in the health care sector (XLV):
MASI:
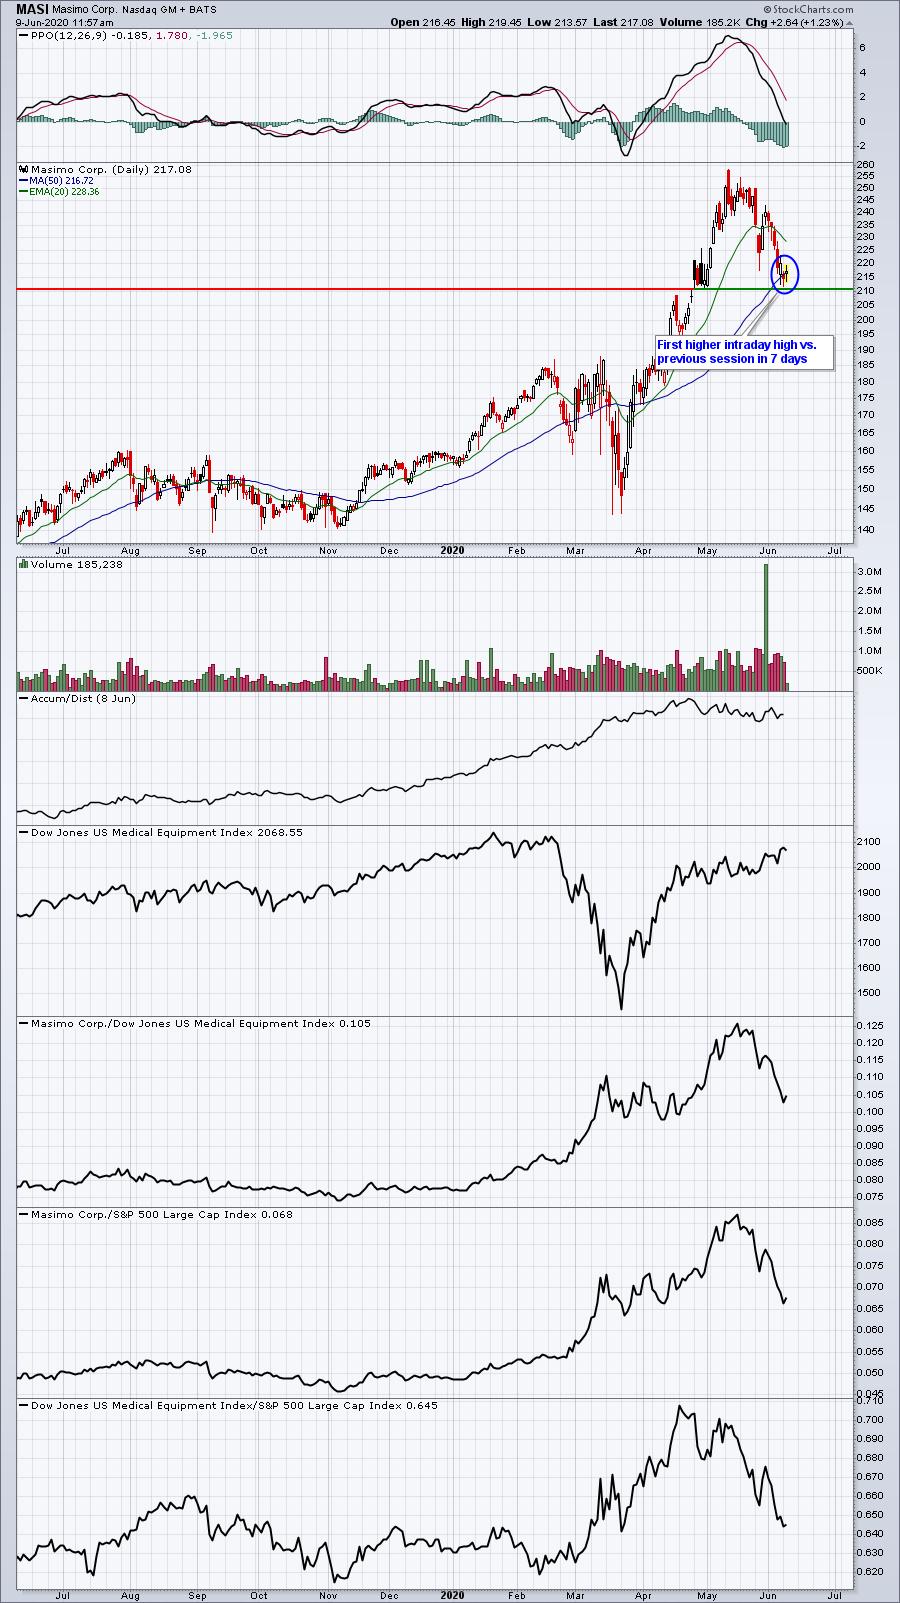
MASI was a leader among medical equipment companies, but has now pulled all the way back to test a key area of support close to 210. Is today's higher high (vs. yesterday) a head fake or is it portending a major reversal at the 50 day SMA? I'm betting on the latter as I've taken a position today. A close below 210 would bother me from a short-term trading perspective, however, so I can keep my stop fairly tight while looking for upside of 40 points to challenge the May high.
MOH:
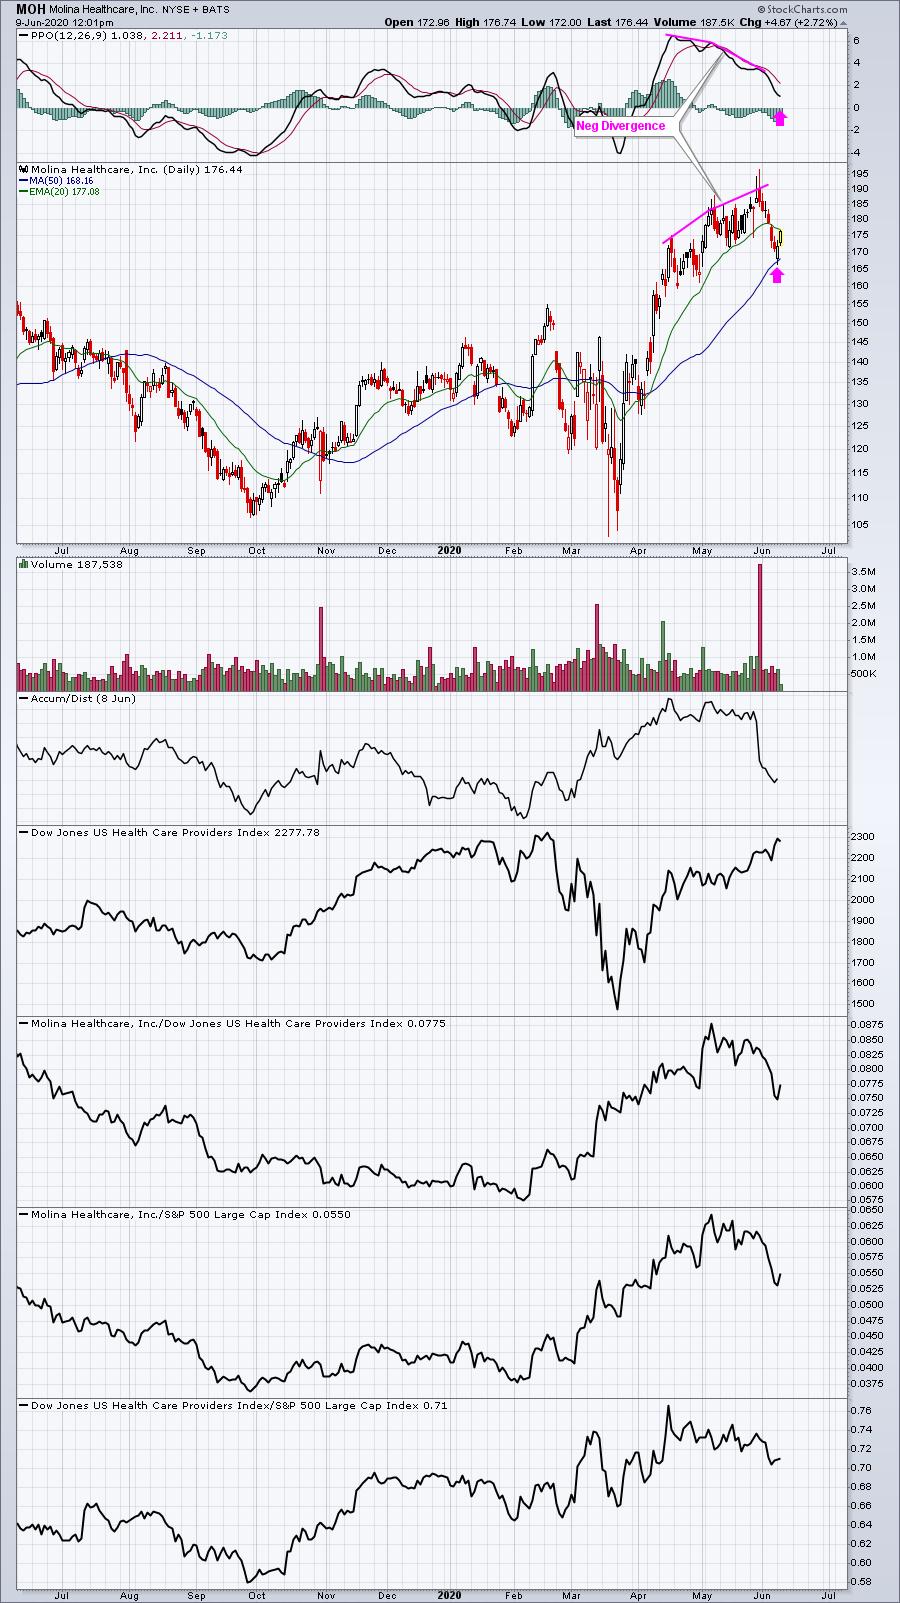
Classic negative divergence printed here on MOH back in early-May and was still present on its next high in late-May. Selling ensued and MOH printed lower highs for six days until it reached its 50 day SMA, a typical destination after a negative divergence prints. Today's action certainly appears to be reversing that downtrend.
TBIO:
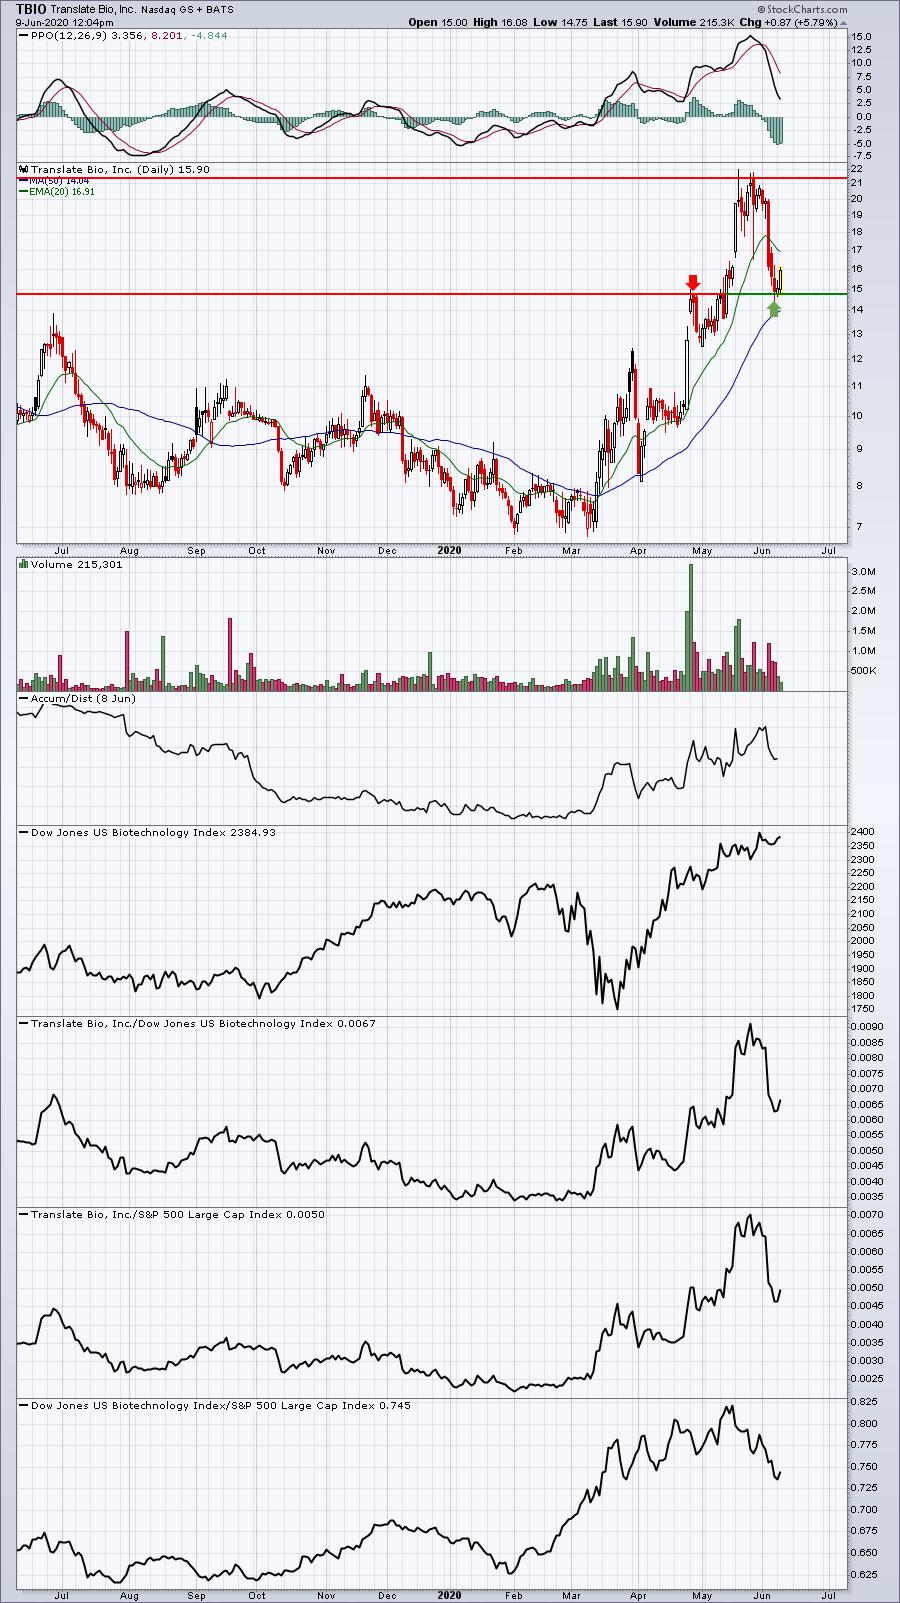
This is the most aggressive trade of the three, but it comes with much better reward potential. It's been a steep drop in TBIO, but it's in the very strong longer-term biotech space ($DJUSBT) and today's reversal could spark another big rally. The initial resistance will be that declining 20 day EMA. A close above that moving average would add to the bullish case here.
Earnings Reports
Here are the key earnings reports for today and tomorrow, featuring stocks with market caps of more than $10 billion. I also include a few select companies with market caps below $10 billion. Finally, any portfolio stocks (or active trade alerts) that will be reporting results are highlighted in BOLD. If you decide to hold a stock into earnings, please understand the significant short-term risk that you are taking. Please be sure to check for earnings dates for any companies you own or are considering owning:
Tuesday, June 9:
BF/B, CHWY, TIF, FIVE, HDS, VRNT, SIG, AMC
Wednesday, June 10:
UNFI
Economic Reports
FOMC meeting begins today; policy statement due tomorrow 2:00pm ET
April wholesale inventories: +0.3% (actual) vs. +0.4% (estimate)
Happy trading!
Tom