
EB Daily Market Report - Wednesday, June 10, 2020
Executive Market Summary
- Futures were mixed, continuing yesterday's theme of buy the NASDAQ, sell the Dow and S&P 500
- Technology (XLK, +1.37%) and health care (XLV, +0.03%) are the two best sector performers today
- Energy (XLE, -2.71%), financials (XLF, -1.95%), and industrials (XLI, -1.51%) are laggards for the second consecutive session
- Crude oil ($WTIC) and gold ($GOLD) are flat today, but the 10 year treasury yield ($TNX) has fallen another 5 basis points to 0.78%, putting pressure on financials and industrials
- The Federal Reserve will announce its latest policy statement at 2:00pm ET this afternoon; I'd be shocked to see anything other than the Fed keeping rates low, which could send more buyers into growth stocks
- Tesla (TSLA) has crossed the $1000 mark, while Amazon.com (AMZN) pushed through $2700 on an intraday basis, though it has since backed off that level
- Computer hardware ($DJUSCR, +1.94%) and software ($DJUSSW, +1.90%) are leading technology higher
Market Outlook
The foreign stock market index that most closely correlates to our benchmark S&P 500 is the German DAX ($DAX). Therefore, I like to keep an eye on how that index is trading and whether it too displays the same bullish long-term characteristics that I see in the U.S. Here's the long-term weekly chart:
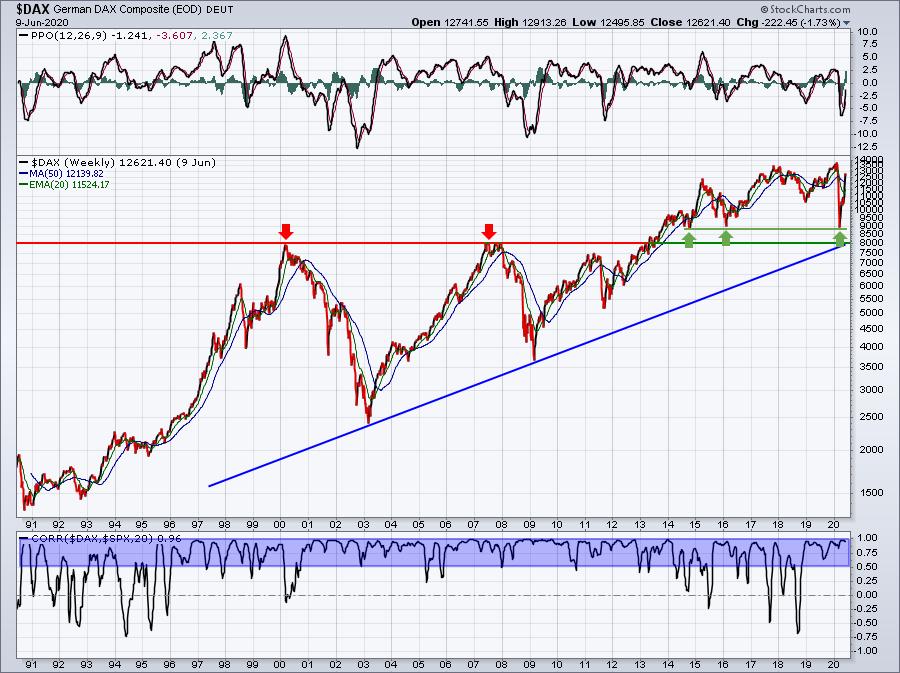
The correlation is not only positive nearly all the time, but it tends to stay above +0.5, which means there's significant positive correlation. While you might think that all global markets would move similarly to the S&P 500, that is absolutely not the case. In fact, I tend to chuckle when CNBC, or any media outlet for that matter, tries to discuss what might happen to the U.S. based on happenings in China. The Shanghai Composite ($SSEC) shows very little positive correlation with the S&P 500:
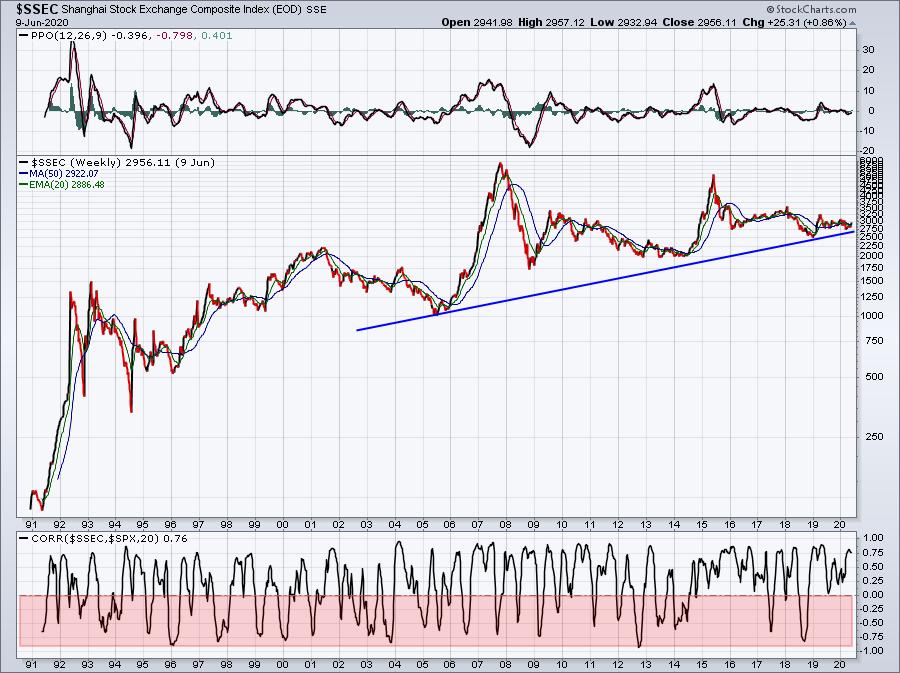
Check out that red-shaded area. That illustrates the level of INVERSE correlation we see between the U.S. and China. China moves opposite the U.S. just as often as the two indices move in unison. So if CNBC goes on a rant about some economic development in China, or the trade war, and how that's going to impact us here in the U.S., remember this chart. There's little research done at CNBC to verify the claims of their guests - or even the hosts for that matter. After all, they're all experts right? :-)
Sector/Industry Focus
Health care (XLV) has been showing signs of possibly breaking out, only to succumb to additional short-term selling pressure. I spoke about this group during today's Trading Places LIVE show, and I also recently discussed some of the short-term momentum issues of its various industry groups in a Daily Market Report (DMR). Despite those negative divergences, we're seeing very little overall selling. It's primarily consolidation. I remain a big fan of biotechs ($DJUSBT) and this group is on the verge of another breakout. It was trying earlier today:
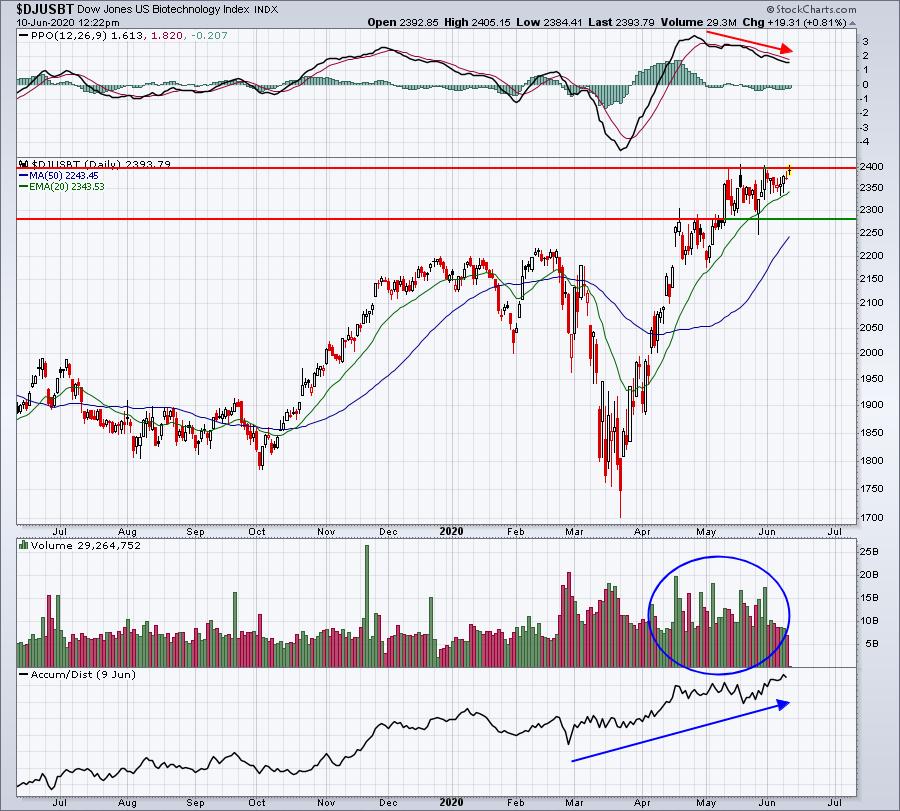
The very heavy volume that accompanied the recent surge in April and May on the breakout confirmed what I believe is the start of a lengthy long-term uptrend. Given that backdrop, I'm planning to have much more patience with this area of the market than I would most other areas. Biotechs are a lot like semiconductors ($DJUSSC) in the sense that when they go, they really go! I would not be at all surprised to see the DJUSBT threatening the 3000 level later this year.
ChartLists
Our Strong AD ChartList stocks are returning to the forefront, at least for the moment, but which ones are rising with heavier than normal volume? Well, from the scan syntax on our website, I ran the following high volume scan against the Strong AD ChartList:

Here were the scan results:
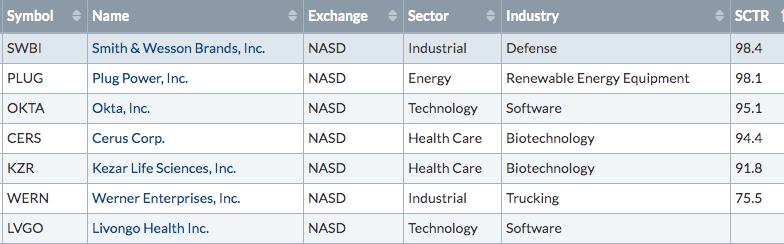
Of these, I really liked two in particular.
LVGO:
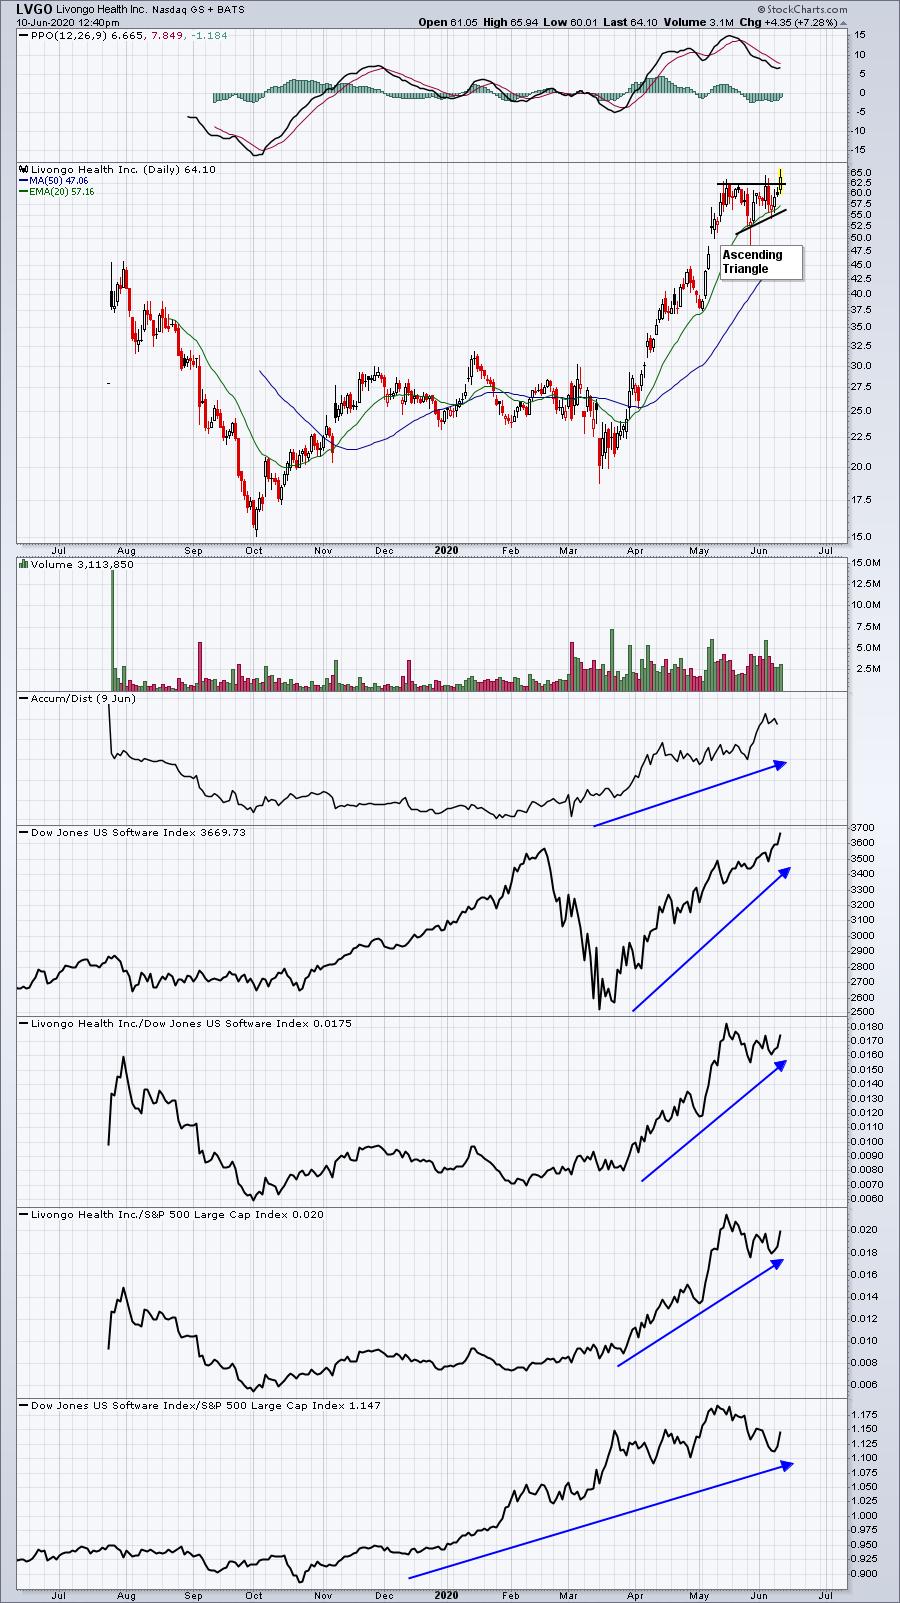
LVGO consolidated in a bullish ascending triangle pattern, while software stocks were taking a break. Now that software is showing strength again, LVGO is threatening a breakout today. The measurement of this pattern would be to roughly 72-73. A false breakout, however, could signal further consolidation. LVGO is one of the strongest relative performers in software.
OKTA:
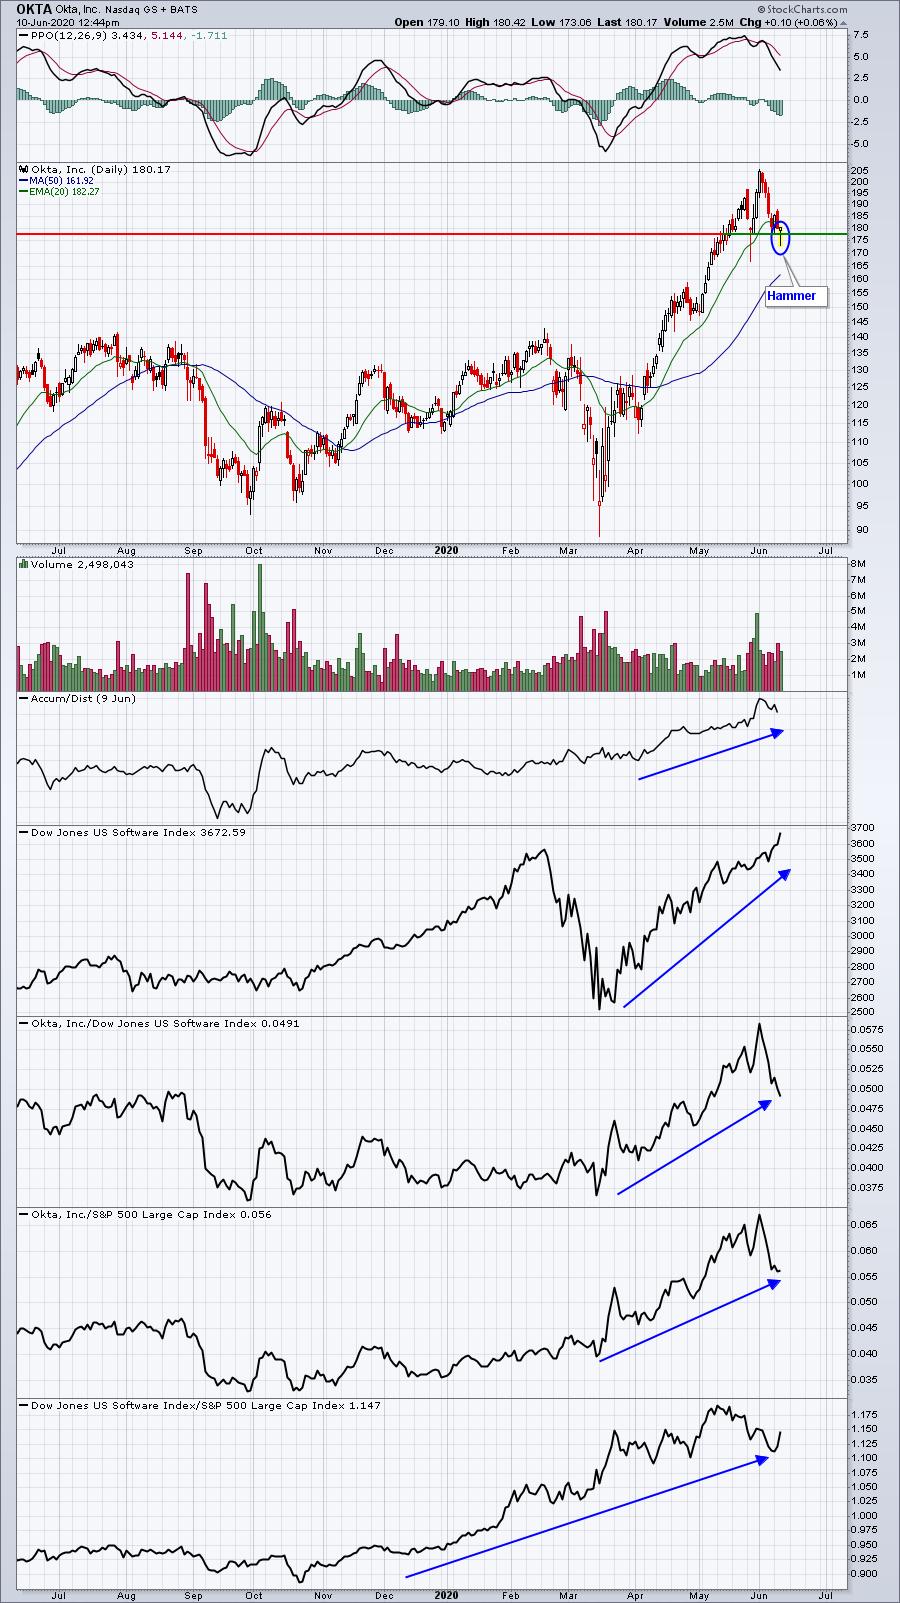
Like LVGO, OKTA has been an excellent performer in software. After reporting stellar quarterly earnings results over a week ago, OKTA fell back approximately 15% and created an opportunity for those wanting to jump in cheaper. Today's hammer candlestick isn't final until we close, but at least so far we're seeing that buyers were very interested in the stock earlier as it nearly retested the low set in late-May.
Earnings Reports
Here are the key earnings reports for today and tomorrow, featuring stocks with market caps of more than $10 billion. I also include a few select companies with market caps below $10 billion. Finally, any portfolio stocks (or active trade alerts) that will be reporting results are highlighted in BOLD. If you decide to hold a stock into earnings, please understand the significant short-term risk that you are taking. Please be sure to check for earnings dates for any companies you own or are considering owning:
Wednesday, June 10:
UNFI
Thursday, June 11:
ADBE, LULU, PVH, FLR
Economic Reports
FOMC meeting ends today; policy statement will be announced at 2:00pm ET
May CPI: -0.1% (actual) vs. +0.0% (estimate)
May Core CPI: -0.1% (actual) vs. +0.1% (estimate)
Happy trading!
Tom