
EB Daily Market Report - Thursday, June 11, 2020
Executive Market Summary
- Futures were decidedly lower today as global indices sold off overnight and earlier this morning
- The Tokyo NIKKEI ($NIKK, -2.82%) and Hong Kong's Hang Seng ($HSI, -2.27%) led selling in Asia
- Most European indices are down in the 3%-4% neighborhood
- The Dow Jones has tumbled 1000 points at last check, but small caps ($SML, -5.67%) and mid caps ($MID, -4.83%) are being hit the worst
- The Volatility Index ($VIX, +15.96%) has surged, suggesting more short-term caution
- Energy (XLE, -5.95%) and financials (XLF, -5.48%) are leading to the downside and both are trading just beneath their 20 day EMAs
- All 11 sectors are lower, with consumer staples (XLP, -1.56%) holding up best
- Airlines ($DJUSAR, -9.93%) and recreational services ($DJUSRQ, -9.39%), which suffered considerably during the March decline, are among the weakest industry groups once again
Market Outlook
Capital preservation is always job #1 for me. I set stops and if I'm taken out, so be it. I want to live to trade again. Because the VIX is back on the rise again, jumping above its 20 day EMA for the first time since in a month, and it could be the first time it closes above that moving average in about 2 1/2 months. This is the fourth day in a row that the VIX has risen, so it makes sense to be more cautious in the near-term. Perhaps what we're seeing is "buy on the rumor, sell on the news" after the Fed policy statement on Tuesday. Honestly, if rates stay near zero for 2-3 years and 2021 GDP rebounds to 5%, it makes sense for U.S. equities to move higher, perhaps a lot higher. But that might have been what the market has been pricing in for weeks. Hearing it from the Fed might simply result in a pause and sideways consolidation. But where might we look to for support as the selling accelerates today?
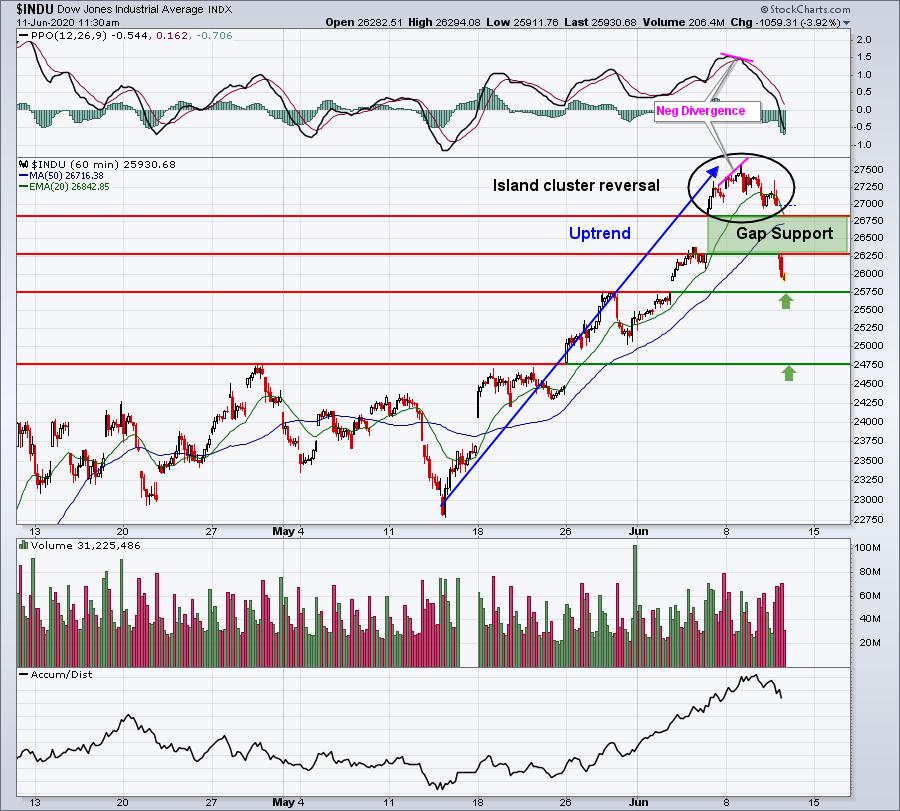
I'd look for 25750 to provide next support, then 24750. Today's gap below the prior gap support zone left the last few days' trading activity on "an island". We gapped up to that island, traded back and forth with a negative divergence emerging, and then gapped lower today to complete the multi-session reversal. When the VIX is this high and rising, I tend to grow very cautious, even if I miss out on some upside. Why? Because I don't like to get caught in panic-induced selling episodes. Market makers will go "on vacation" and allow stocks to fall precipitously for a period of time and wait to buy them cheaper. I don't know if that's what we're looking at, but I just don't like to take that chance.
Sector/Industry Focus
Let's review health care (XLV) again, because with today's action and move below the 20 day EMA, that negative divergence now appears to be driving prices down to the 50 day SMA for a PPO centerline reset. Here's the current view:
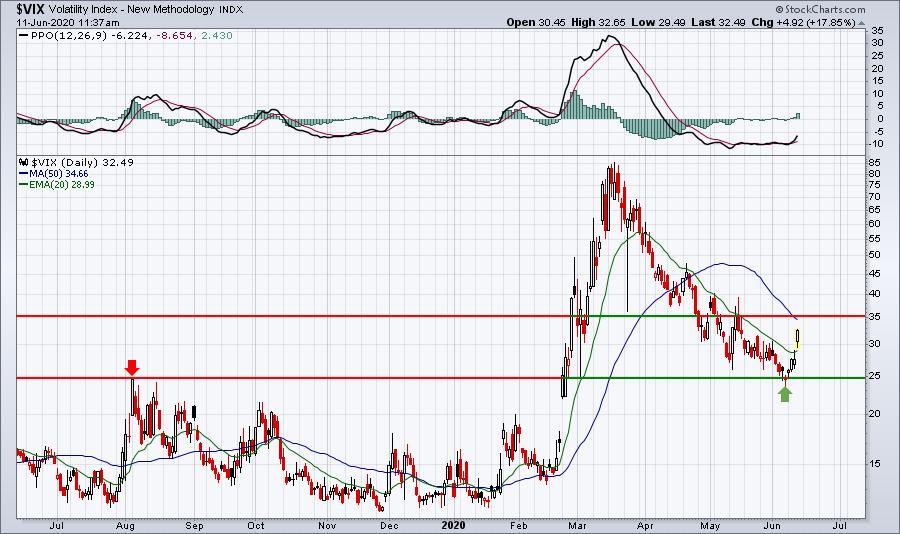
The VIX did hang onto key support near 25 and this could just be a short-lived bounce as the market sells off and consolidates after a long uptrend. I'd grow more concerned near-term if the VIX clears overhead resistance closer to 35. That also would clear the 50 day SMA and likely result in additional impulsive selling. One thing that's really important to point out - we haven't even had a 20 day EMA test on the Dow Jones and S&P 500. On an intraday basis, however, both the S&P 400 Mid Cap Index ($MID) and the S&P 600 Small Cap Index ($SML) have lost their respective 20 day EMAs, which could lead to further selling unless a reversal takes place this afternoon.
ChartLists
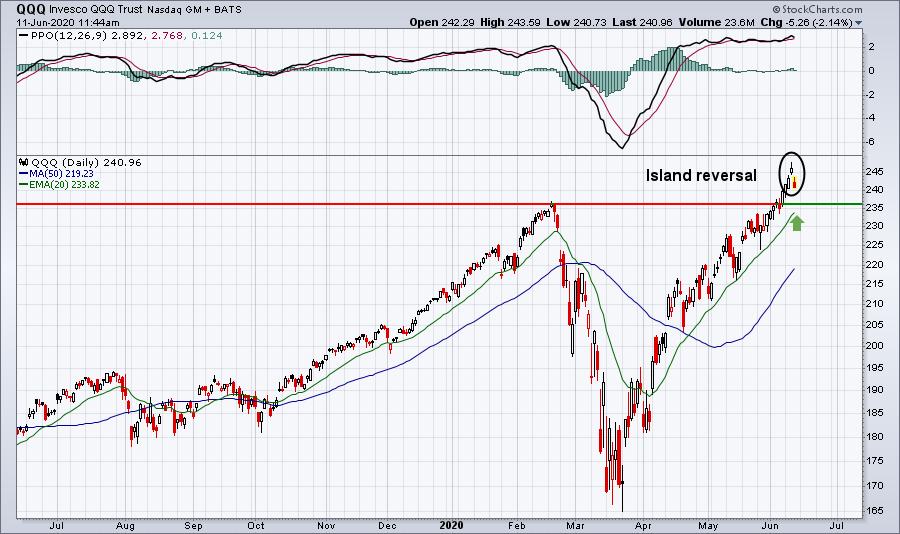
One other short-term problem we have today is that the QQQ (ETF that tracks the NASDAQ 100) has gapped lower to leave yesterday's candle on an island. That's a potential topping signal with an upcoming 20 day EMA test very possible:
Personally, I don't short in what I believe is a secular bull market. I'm more than happy to simply sit mostly or fully in cash.
I'm glad that the Strong AD and Weak AD ChartLists remained unchanged. In other words, I'm glad I didn't update them, because what we're seeing again this week as the market turns more fearful is a resumption of the relative weakness of the Weak AD ChartList stocks. That's fairly clear I believe when you look at the following performance breakdown of each of our four ChartLists:
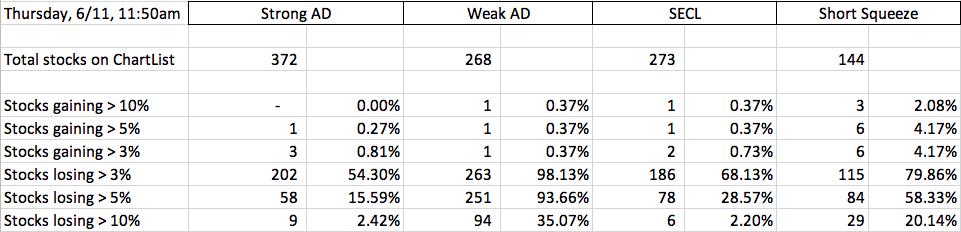
93% of our Weak AD ChartList stocks are down more than 5%, while the S&P 500 is down 3.6%. I think it's pretty clear what's weighing on U.S. equities today. Most stocks are lower, but these relative underperformers are carrying the burden of this week's selling.
I'm holding off on adding any new positions today, unless I see a massive reversal later this afternoon.
Earnings Reports
Here are the key earnings reports for today and tomorrow, featuring stocks with market caps of more than $10 billion. I also include a few select companies with market caps below $10 billion. Finally, any portfolio stocks (or active trade alerts) that will be reporting results are highlighted in BOLD. If you decide to hold a stock into earnings, please understand the significant short-term risk that you are taking. Please be sure to check for earnings dates for any companies you own or are considering owning:
Thursday, June 11:
ADBE, LULU, PVH, FLR
Friday, June 12:
None
Economic Reports
Initial jobless claims: 1,542,000 (actual) vs. 1,565,000 (estimate)
May PPI: +0.4% (actual) vs. +0.1% (estimate)
May Core PPI: -0.1% (actual) vs. -0.1% (estimate)
Happy trading!
Tom