
EB Daily Market Report - Tuesday, June 16, 2020
Today's Event
We will be hosting a members-only event today at 4:30pm ET to discuss max pain for the month of June. Here's THE LINK to the webinar, but follow the link on our website if this doesn't work.
Executive Market Summary
- Futures were very strong early this morning, strengthening further after a record monthly retail sales report
- The June housing market index also crushed estimates, although both industrial production and capacity utilization both came in below expectations
- Health care (XLV), energy (XLE), and materials (XLB) are leading today's action
- All 11 sectors are higher, but communication services (XLC) is the only sector up by less than 1%
- Dexamethasone, a widely used steroid, has become the first drug shown to save lives among COVID-19 patients
- Crude oil ($WTIC) has spiked over 3% today, while gains in other commodities are less robust
- The 10 year treasury yield ($TNX) was up 8 basis points to 0.78%, but has backed off to 0.75%
- Apparel retailers ($DJUSRA, +5.11%) and clothing & accessories ($DJUSCF, +3.24%) are big beneficiaries of the surprisingly strong retail sales report
Market Outlook
Retail sales posted its largest one month increase ever earlier this morning, when it jumped 17.7%. We saw a huge opening gap higher in the S&P Retail ETF (XRT) this morning, but it's been followed by some selling and back-and-forth action. Ultimately, we want to see this ETF clear overhead resistance from late 2019:
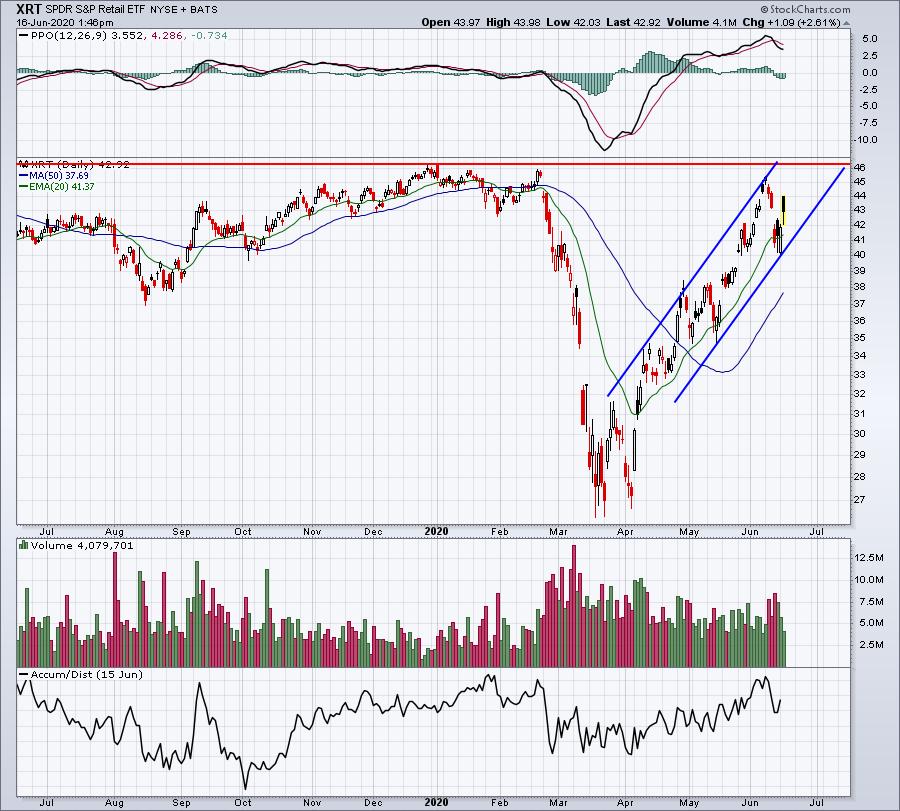
At some point, we'll need to consolidate after a huge recent uptrend. For now, however, I'd simply watch this channel. We remain in a very strong uptrend until the bottom uptrend line fails to hold. At that point, I'd look for a trading range to develop.
Sector/Industry Focus
Health care (XLV, +2.78%) is leading. I haven't said that in a long, long time. But, at least for a part of a trading session, the XLV is back on top. On its daily chart, it certainly looks like a false breakdown:
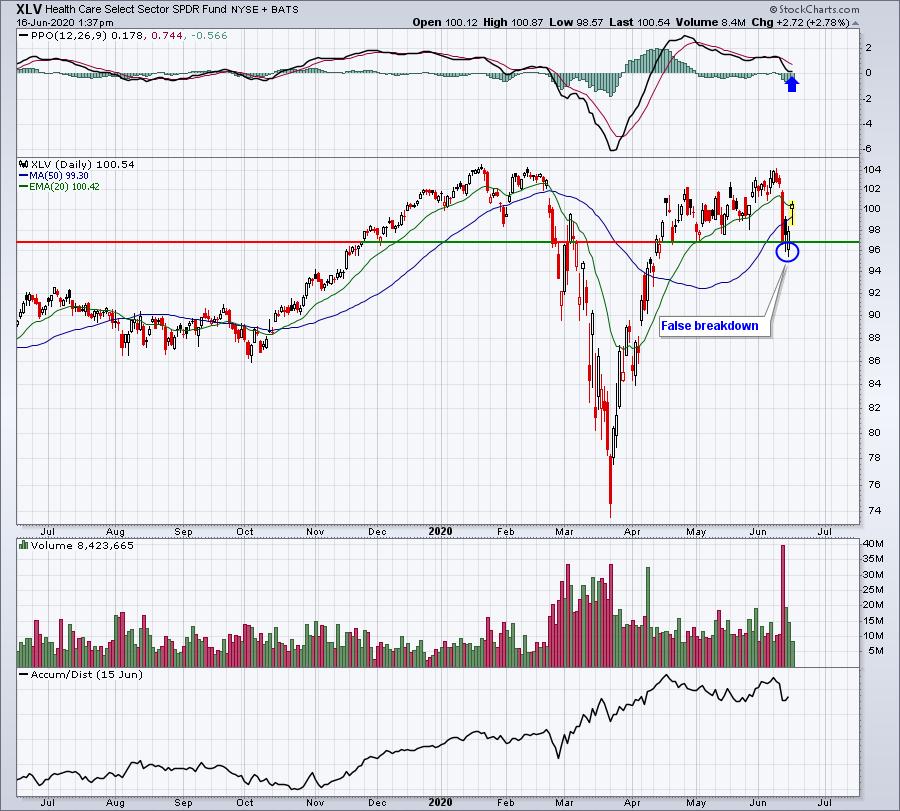
The reversal on the absolute chart is definitely a bullish development, but the XLV has much work to do on a relative basis. Check out its hourly chart and relative downtrend it's currently trying to break:
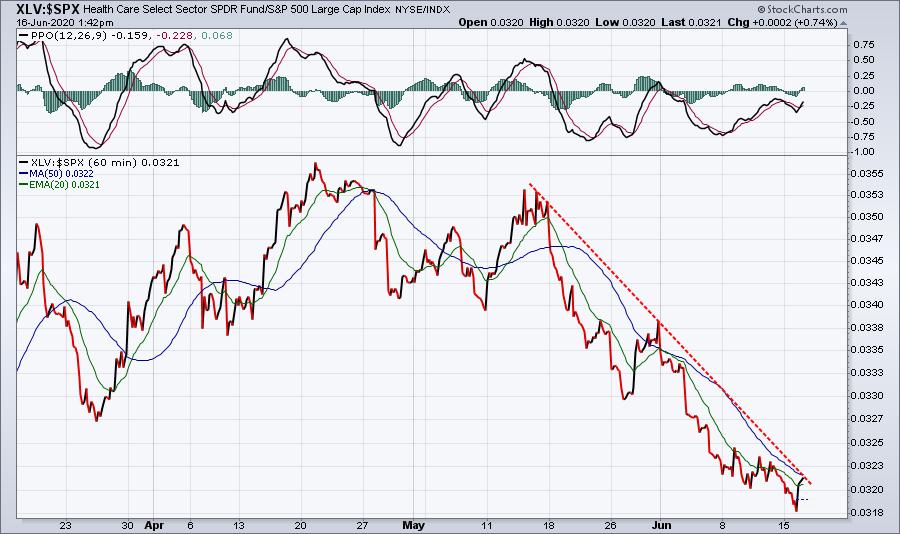
Perhaps we'll begin to see an extended period of relative strength in health care once this relative downtrend line is broken.
ChartLists
When I ran our Downtrend Reversal scan against our Strong Earnings ChartList, it returned 33 stocks. When I sorted them in SCTR order, there were 18 with SCTR scores above 70. Here are two that I thought were interesting:
LRN:
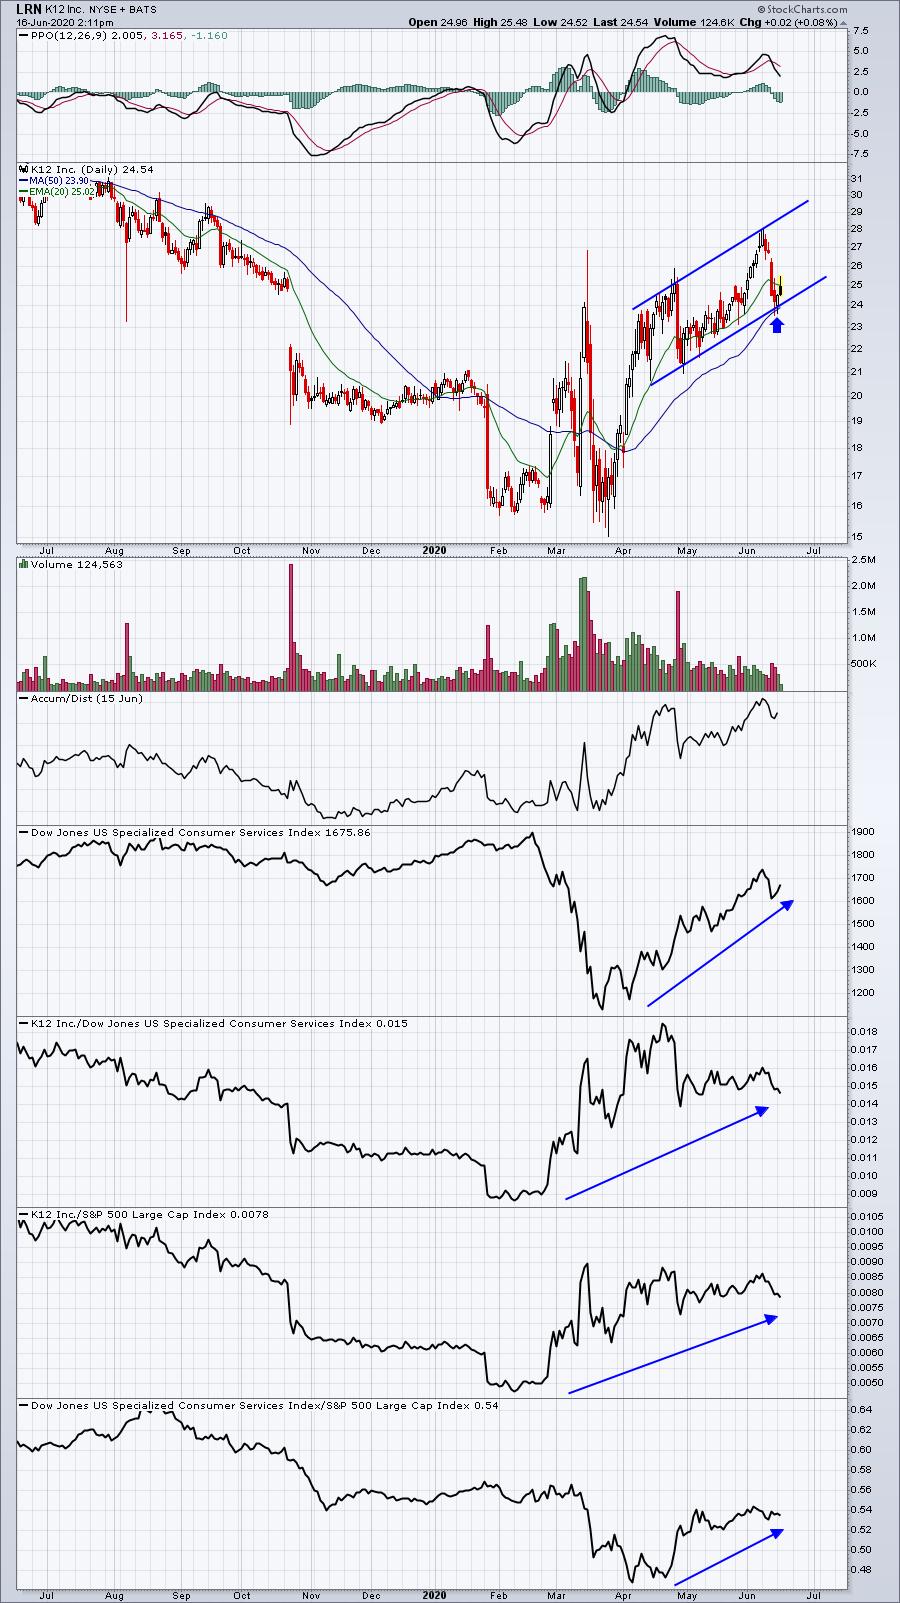
LRN seems to be bouncing off the lower uptrend line in a bullish channel. Its PPO remains in positive territory and today's daily high clearing yesterday's could represent the start of an uptrend.
XLNX:
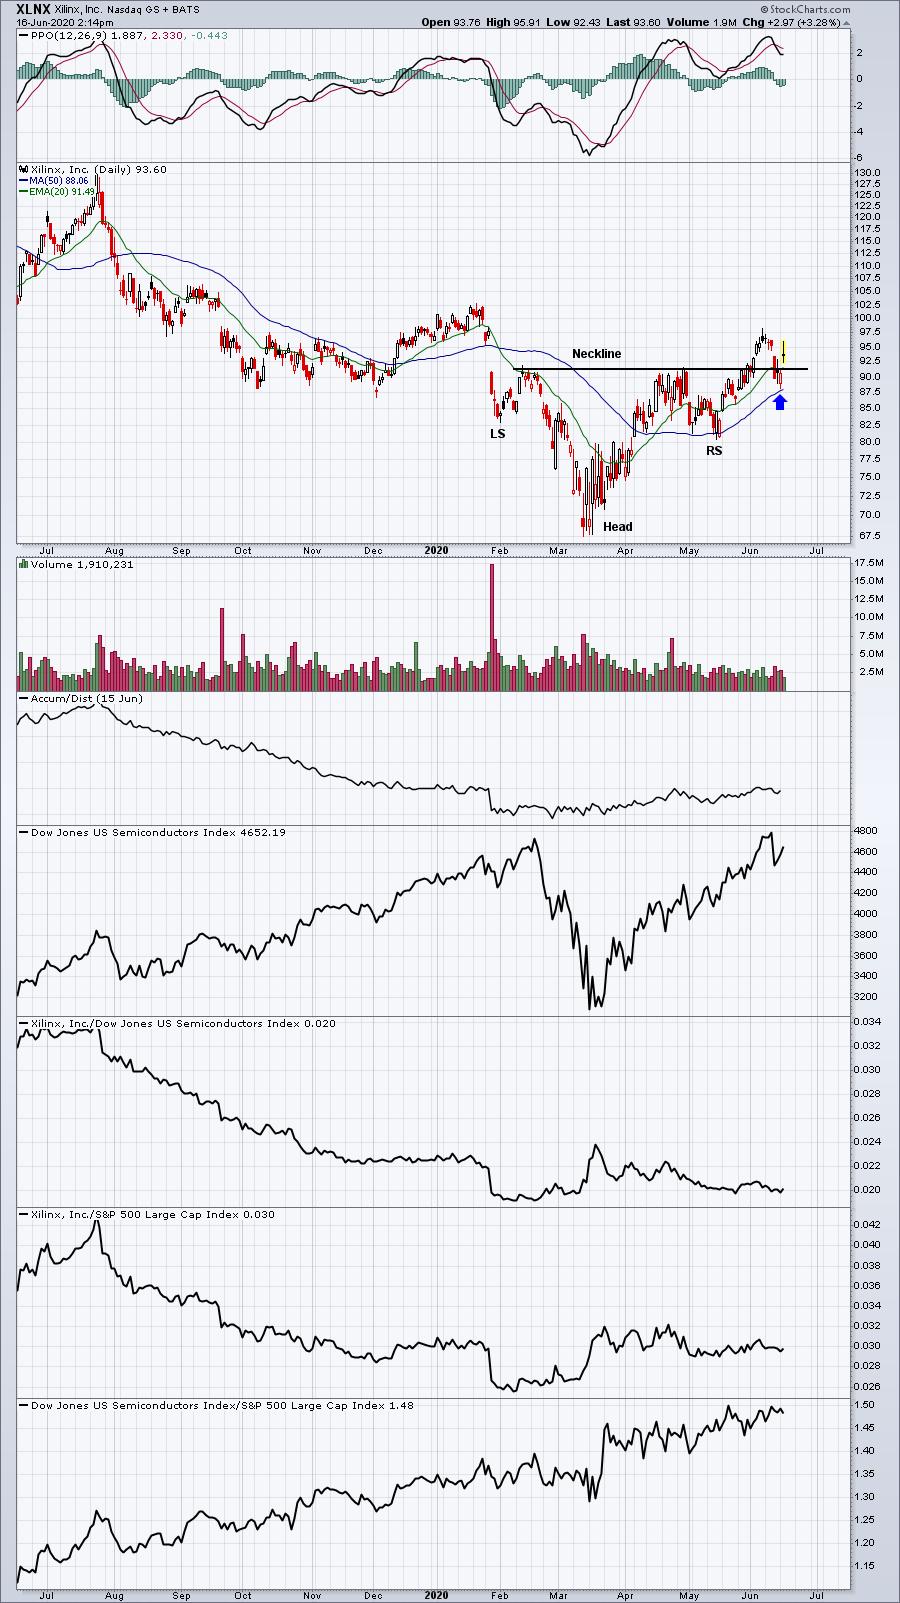
I mentioned XLNX awhile back as a possible reverse head & shoulders bottom. After recently falling back to lose neckline support, XLNX has since recovered and now appears to potentially be beginning an uptrend. There's no excuse for XLNX to move and close back beneath its now-rising 50 day SMA (blue arrow), so I'd consider a closing stop there.
Earnings Reports
Here are the key earnings reports for today and tomorrow, featuring stocks with market caps of more than $10 billion. I also include a few select companies with market caps below $10 billion. Finally, any portfolio stocks (or active trade alerts) that will be reporting results are highlighted in BOLD. If you decide to hold a stock into earnings, please understand the significant short-term risk that you are taking. Please be sure to check for earnings dates for any companies you own or are considering owning:
Tuesday, June 16:
LEN, HRB, GRPN
Wednesday, June 17:
HTHT, CPRI, ABM
Economic Reports
May retail sales: +17.7% (actual) vs. +7.5% (estimate)
May retail sales less autos: +12.4% (actual) vs. +5.2% (estimate)
May industrial production: +1.4% (actual) vs. +2.9% (estimate)
May capacity utilization: 64.8% (actual) vs. 66.7% (estimate)
April business inventories: -1.3% (actual) vs. -0.5% (estimate)
June housing market index: 58 (actual) vs. 44 (estimate)
Happy trading!
Tom