
EB Daily Market Report
ChartLists Updated
John Hopkins sent out a note earlier, but if you didn't see it, we've updated two of our ChartLists - the Strong Earnings ChartList (SECL) and the Short Squeeze ChartList (SSCL). When signed into your EarningsBeats.com account, look under "Members" on the left navigational panel and click on "ChartLists". You'll find a link and a password for both of these ChartLists, which you can then use to download these two ChartLists into your StockCharts.com account, provided that you're an Extra member or above there. Otherwise, you'll only be able to view the charts. (It's definitely worth the upgrade at StockCharts.com, if necessary, in order to be able to organize all of our work into your account there.)
Executive Market Summary
- Futures headed lower yesterday evening, but recovered overnight with mostly minor losses at the open
- Crude oil ($WTIC) has spiked nearly 2% to $38.70 per barrel
- Economic reports were mixed this morning; initial jobless claims were much higher than expected
- Philadelphia Fed survey and leading indicators both were reported much stronger than expected
- Energy (XLE, +1.18%) and materials (XLB, +0.20%) were the only two sectors higher today
- Real estate (XLRE, -1.36%) and utilities (XLU, -0.85%) were weakest
- Hotels ($DJUSLG, +1.83%) and software ($DJUSSW, +0.80%) were both holding up well at last check
- The 10 year treasury yield ($TNX) is taking another hit today, down 3 basis points to 0.70%
Market Outlook
One key for technology (XLK) and thus, the overall market, will be whether software can make a breakout. It tested overhead price resistance earlier this morning, but has since pulled back. Here's the chart:
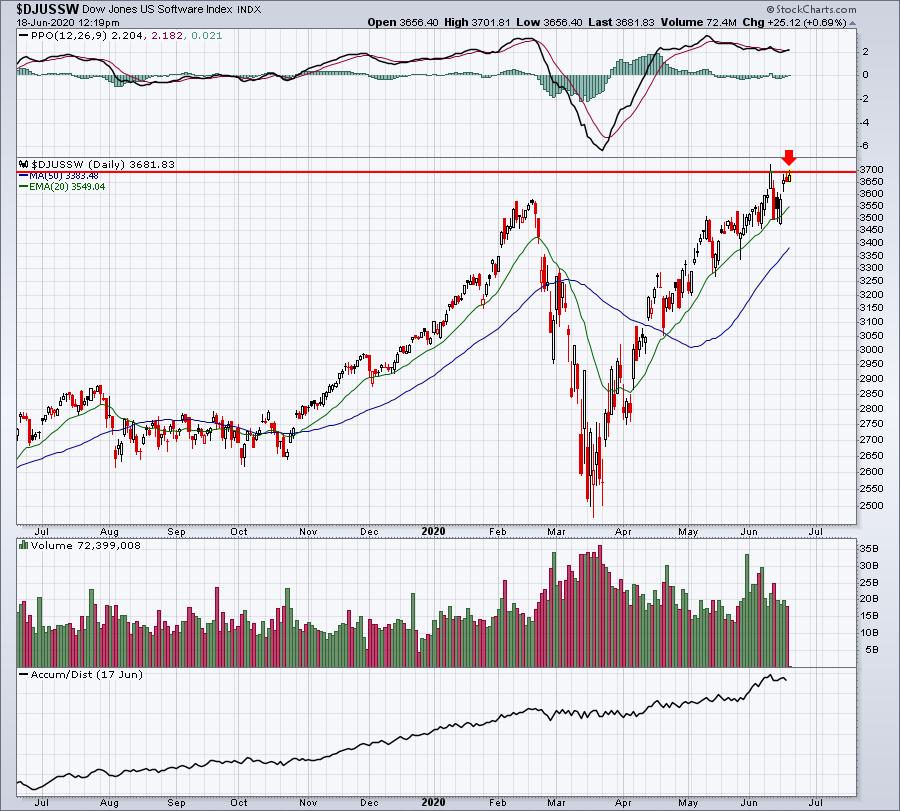
Remember that huge 1800 point decline on the Dow Jones last Thursday? The Dow Jones still remains 3.61% below the close prior to that day. In other words, it's only recovered about half its losses from that day. But software has recovered all of its losses. Do you see the relative strength simply by considering that? Professionals are using this period of weakness to rotate into areas they believe will perform best heading into next quarter's earnings season.
Sector/Industry Focus
I showed you how software is outperforming as money rotates into that group. Well, I did a study and I'm sure you'd like to know the areas that have been favored most during the past week of volatility. Here they are:
- Software ($DJUSSW)
- Computer hardware ($DJUSCR)
- Toys ($DJUSTY) - best performing industry
- Home improvement retailers ($DJUSHI)
- Specialty retailers ($DJUSRS) - 2nd best industry
- Home construction ($DJUSHB)
- Broadline retailers ($DJUSRB)
- Recreational products ($DJUSRP) - 4th best industry
- Internet ($DJUSNS)
- Building materials & fixtures ($DJUSBD)
- Financial administration ($DJUSFA)
- Brewers ($DJUSDB)
- Personal products ($DJUSCM)
- Nondurable household products ($DJUSHN)
- Distillers & vintners ($DJUSVN)
- Diversified REITs ($DJUSDT) - 3rd best industry
So while others view the recent action as simply a bit of selling and consolidation, I like to take it a step further. Professionals are using this period of selling as an opportunity to better position themselves for the earnings season ahead. The groups that are performing best now, and over the next few weeks, will be the groups with the most explosive earnings. These are the groups we want to identify NOW in our research.
ChartLists
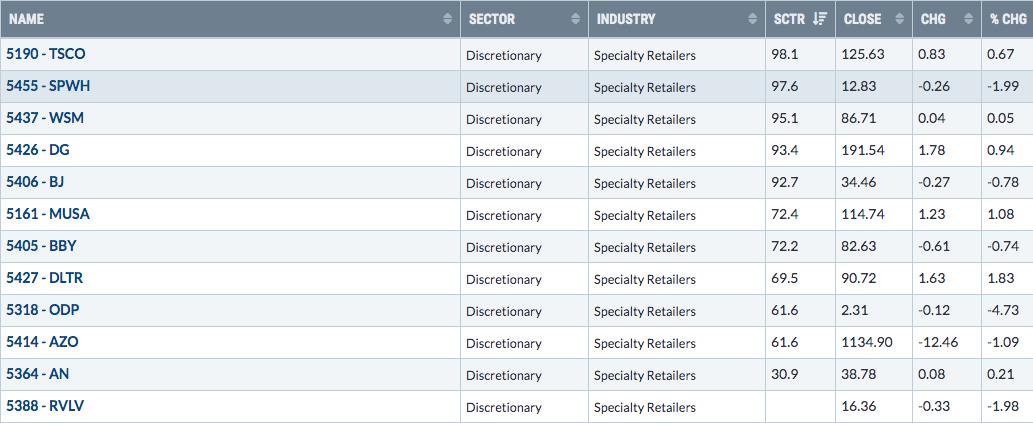
We can take each of those top industry groups above and search our Strong Earnings (SECL), Strong AD (SADCL), and Short Squeeze (SSCL) ChartLists for a few of the best relative performers in those areas. When you pull up each ChartList in "Summary" form and then type the industry group into the search box, this is what you'll see (I'm using specialty retailers as an example):
SECL:
SADCL:

SSCL
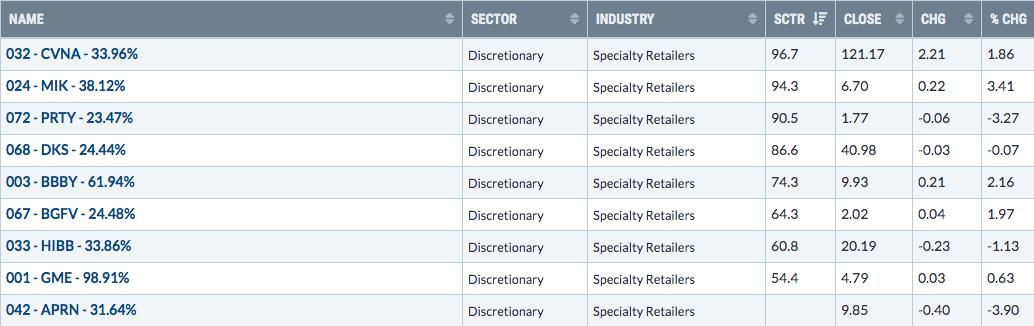
Note that every stock in the Short Squeeze ChartList has a percentage next to the ticker symbol. This represents the "Short % of Float" so you can quickly see how heavily a stock is shorted. All of them have high short interest levels, which is why they're on this ChartList in the first place. But the %'s will help you quickly identify those highest on the list.
Earnings Reports
Here are the key earnings reports for today and tomorrow, featuring stocks with market caps of more than $10 billion. I also include a few select companies with market caps below $10 billion. Finally, any portfolio stocks (or active trade alerts) that will be reporting results are highlighted in BOLD. If you decide to hold a stock into earnings, please understand the significant short-term risk that you are taking. Please be sure to check for earnings dates for any companies you own or are considering owning:
Thursday, June 18:
KR, CCEP, CCL, CMC, FLR, KFY, MEI
Friday, June 19:
KMX, JBL
Economic Reports
Initial jobless claims: 1,508,000 (actual) vs. 1,220,000 (estimate)
June Philadelphia Fed Survey: 27.5 (actual) vs. -22.7 (estimate)
May leading indicators: +2.8% (actual) vs. +1.7% (estimate)
Happy trading!
Tom