
EB Daily Market Report - Monday, June 22, 2020
Executive Market Summary
- Our major indices all gapped lower and they're now all in positive territory, led by NASDAQ shares
- May's existing home sales fell short of expectations
- Crude oil ($WTIC) has climbed back above $40 per barrel
- The 10 year treasury yield ($TNX) was down earlier, but has rebounded back to 0.70%
- Global markets were mostly lower overnight and earlier this morning, but U.S. indices remain quite strong
- Technology (XLK) is today's leader as software ($DJUSSW) surges another 2%
- We're not higher everywhere, however, as real estate (XLRE) leads four sectors lower
Market Outlook
Strong economic growth should result in a strengthening transportation group ($TRAN) and it typically does. However, airlines ($DJUSAR) remain a drag and mask strength that we've been seeing in both trucking ($DJUSTK) and railroads ($DJUSRR). Nonetheless, I'd like to see the overall TRAN remain in an overall uptrend and hold onto key price and moving average support:
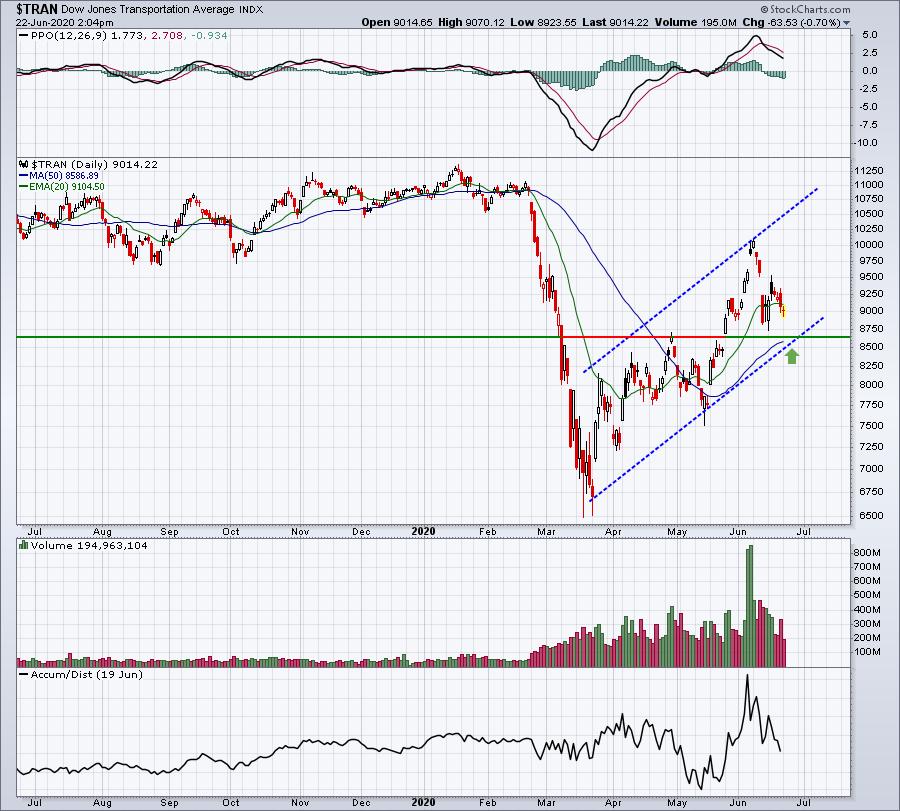
The green arrow marks a key area of support to watch. Price support and gap support reside at 8628 and 8470, respectively. The 50 day SMA currently resides at 8586. Throw in trendline support, which is approximately 8500 at the present time and I think this provides us a critical range to watch between 8470 and 8628.
Sector/Industry Focus
In my recent industry group analysis, which I shared in part in the "State of the Market" email from last night, a rapidly-improving sector has been communication services (XLC) and one of the primary reasons for it has been internet stocks ($DJUSNS). During the February 19th through April 17th decline and rebound, the DJUSNS ranked 32nd out of 104 industry groups - not bad at all. But we've seen this group improve in the most recent drop and recovery (June 10th through June 19th) to the 10th spot out of 104 groups. The DJUSNS daily chart has a few question marks, most notably a negative divergence that we're seeing across several key areas of the market. But I want to emphasize that there is no such issue on the longer-term weekly chart:
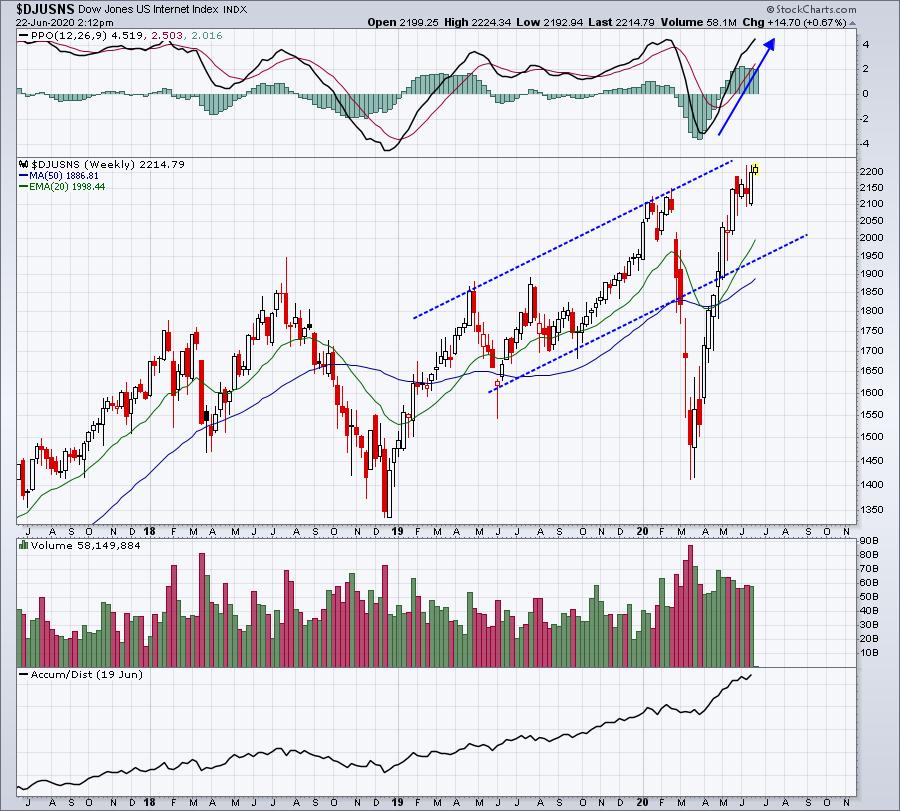
Imagine what the DJUSNS chart might look like if the pandemic never hit. I've drawn blue-dotted channel lines connecting the highs and potentially the lows. What the stock market is telling us is that we had a great economy before the pandemic and we'll have a great economy when it's over. Wall Street is telling us the areas that we need to favor as we head towards earnings season and I believe the DJUSNS is clearly one of these groups. Expect blowout results and improving guidance ahead.
ChartLists
First, here's a performance breakdown of our key ChartLists:
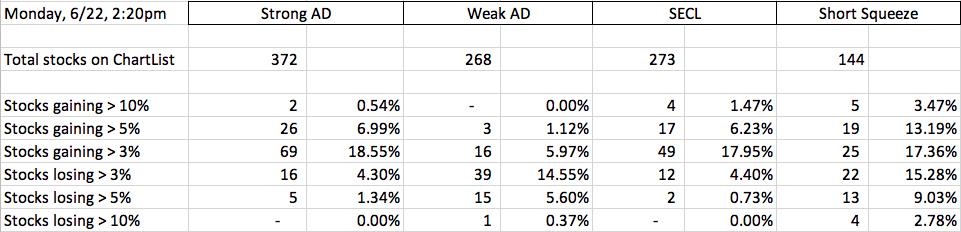
There's definitely a bias today towards our technically-sound Chartlists, the SECL and SADCL. Going through charts on these two lists, I wanted to highlight a few that are worth mentioning:
MASI:
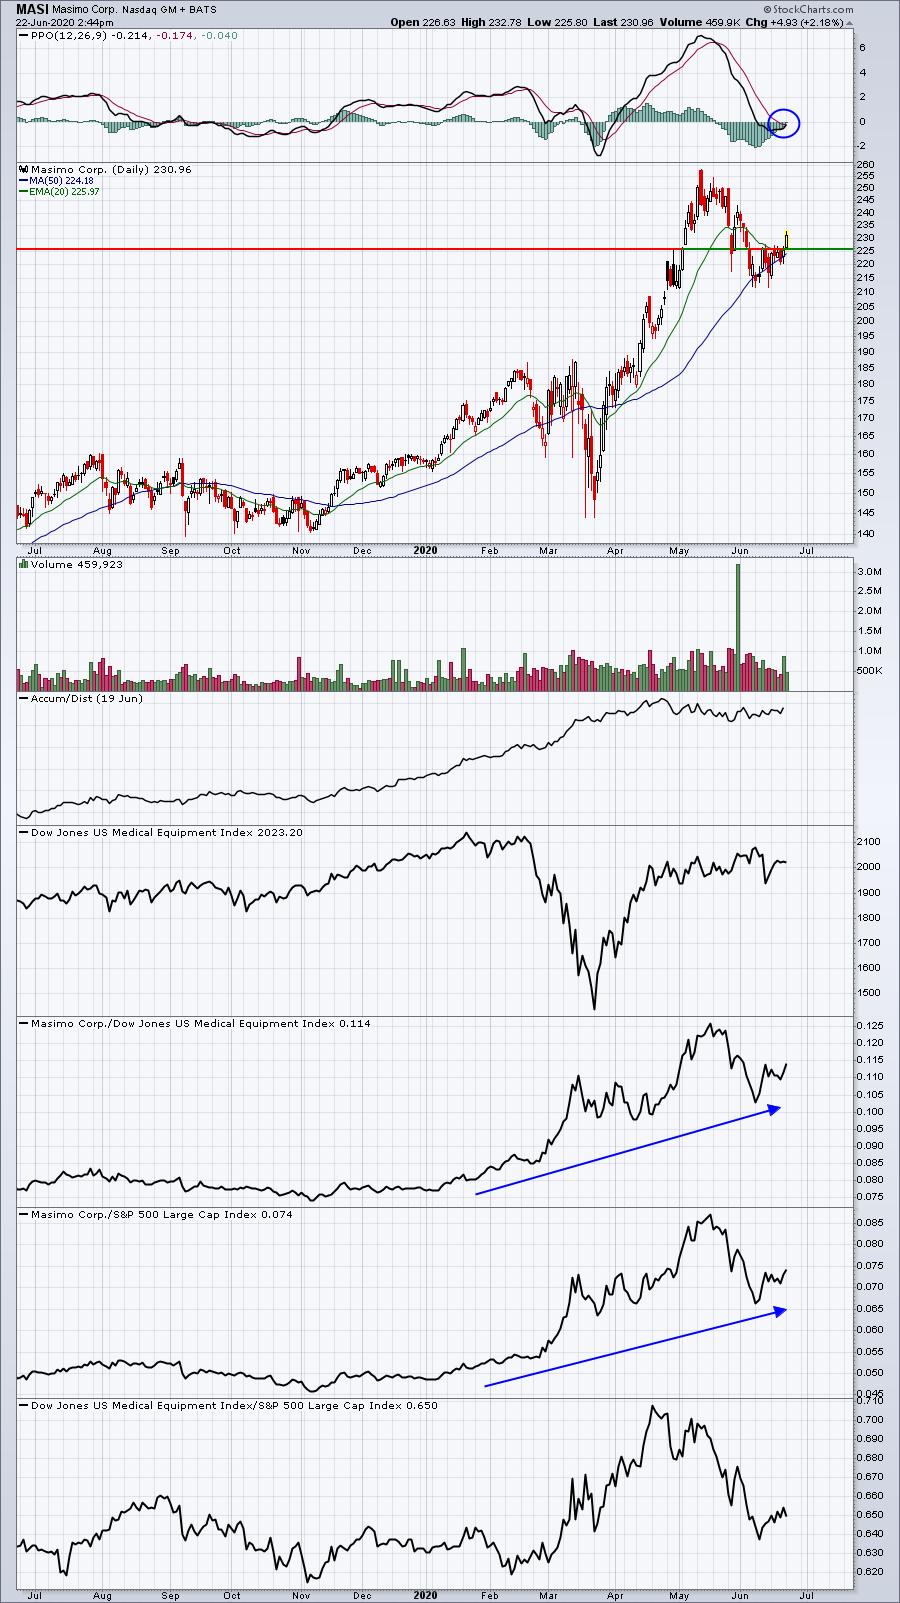
MASI is a strong medical equipment company that had been struggling to clear price resistance and its 20 day EMA. It's finally doing both today. It could be an early signal to an upcoming advance into earnings season.
FFIV:
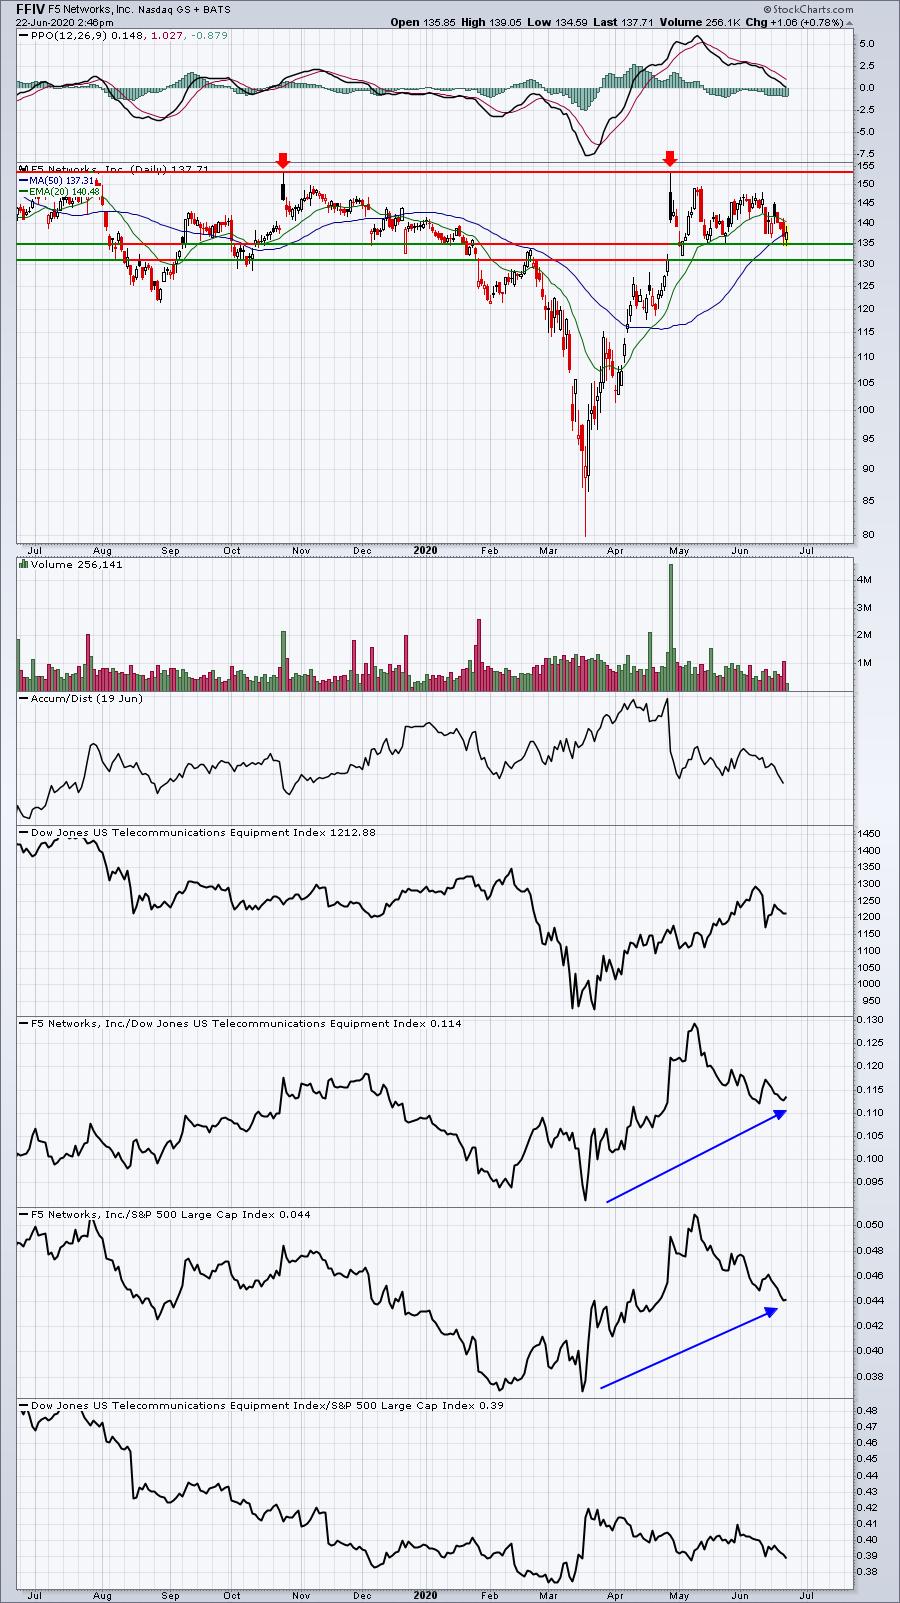
The only issue I see here is that telecom equipment companies have been underperforming. FFIV, however, was showing relative strength until its recent consolidation. The best reward to risk entry is at 135 or just below with recent highs near 153 the target.
CLGX:
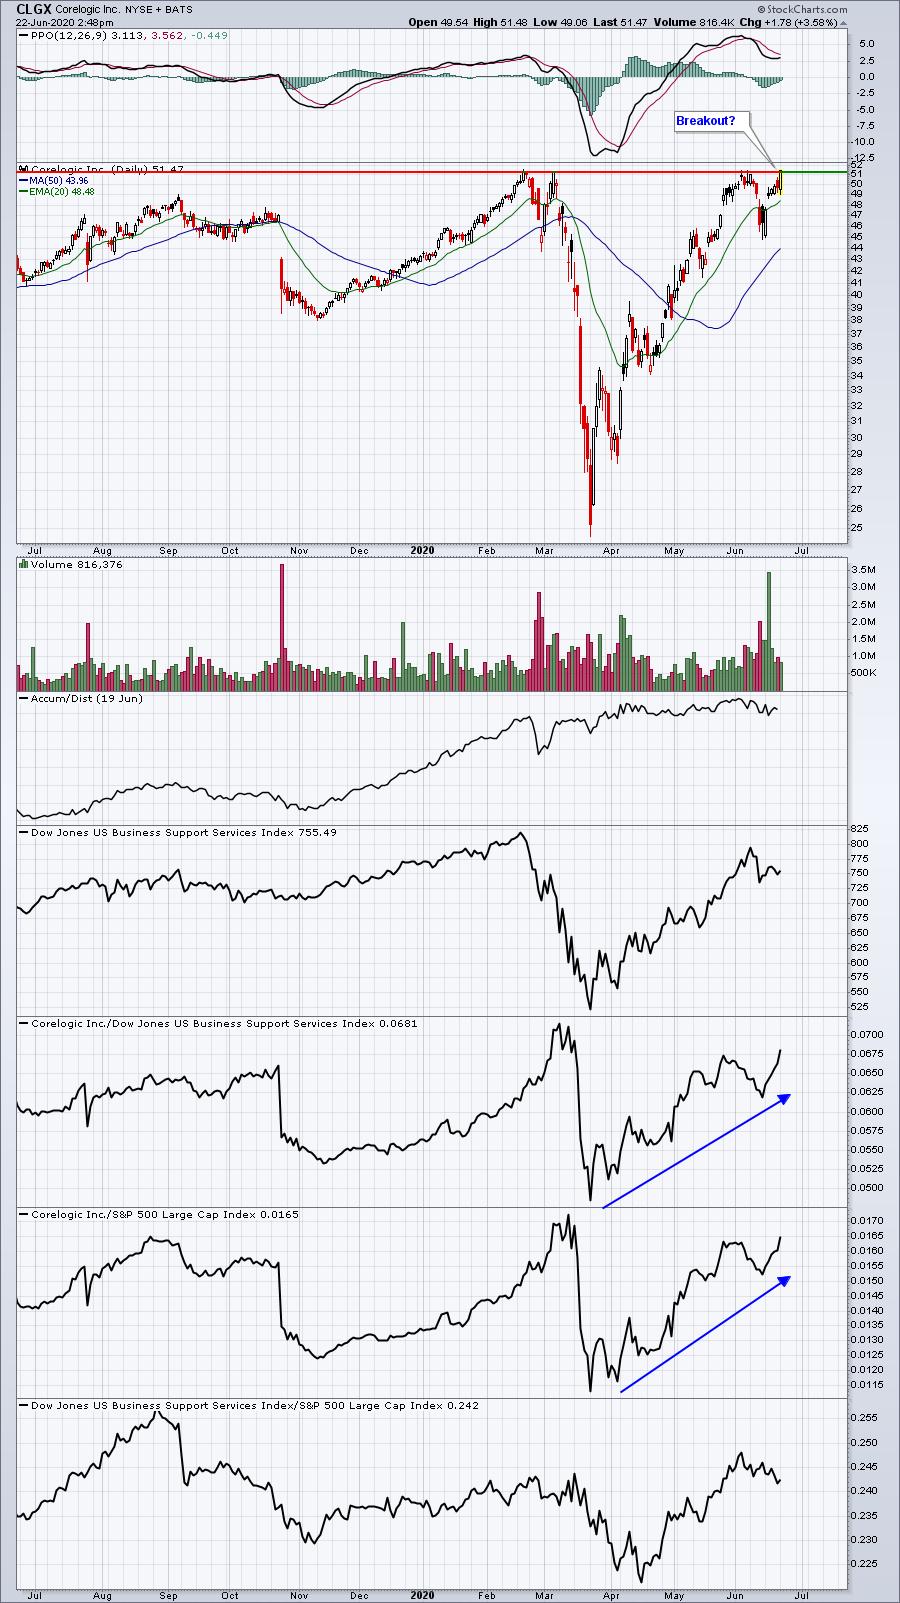
51.29 is the key closing number to watch. CLGX is currently trading above that level and volume is solid, though not off the charts. A strong finish today would be bullish.
Earnings Reports
Here are the key earnings reports for today and tomorrow, featuring stocks with market caps of more than $10 billion. I also include a few select companies with market caps below $10 billion. Finally, any portfolio stocks (or active trade alerts) that will be reporting results are highlighted in BOLD. If you decide to hold a stock into earnings, please understand the significant short-term risk that you are taking. Please be sure to check for earnings dates for any companies you own or are considering owning:
Monday, June 22:
None
Tuesday, June 23:
INFO, AVAV, LZB
Economic Reports
May existing home sales: 3,910,000 (actual) vs. 4,290,000 (estimate)
Happy trading!
Tom