
EB Daily Market Report - June 23, 2020
New ChartList Added
We've added a brand new ChartList, the Strong Future Earnings ChartList (SFECL). If we focus solely on the Strong Earnings ChartList (SECL), then we ignore the companies that Wall Street is favoring as we head into a new earnings season. The SFECL attempts to bridge that gap. This ChartList will be updated periodically, similar to the SECL, but it will only feature companies that belong to the best performing industry groups at that time and that have SCTR scores above a predetermined level. Our first SFECL uses a SCTR score of 80+ as a filter. This new ChartList is now available on our ChartLists page and can be downloaded into your StockCharts.com account (assuming that you have an Extra membership there or above) using the link and password provided. Enjoy!
Executive Market Summary
- Our major indices were green once again ahead of the open
- The NASDAQ, setting new all-time record highs nearly every day, is setting the pace among our indices
- May new home sales easily surpassed forecasts
- Technology (XLK), communication services (XLC), consumer discretionary (XLY), and health care (XLV) are the leading sectors
- Utilities (XLU) and real estate (XLRE) are the only two sectors in negative territory
- Computer hardware ($DJUSCR), led by Apple (AAPL), is up more than 3% today
- Furnishings ($DJUSFH) and renewable energy ($DWCREE) are the two leading industry groups
Market Outlook
The Wilshire 5000 Composite Index ($WLSH) is a broad measure of all US stocks actively traded. It is a market capitalization weighted index, meaning that is skewed much more by large companies like Apple (AAPL) and Microsoft (MSFT). Still, if we look at a daily chart of this index, I believe we have a very strong bullish channel in play right now that continues to point to higher prices:
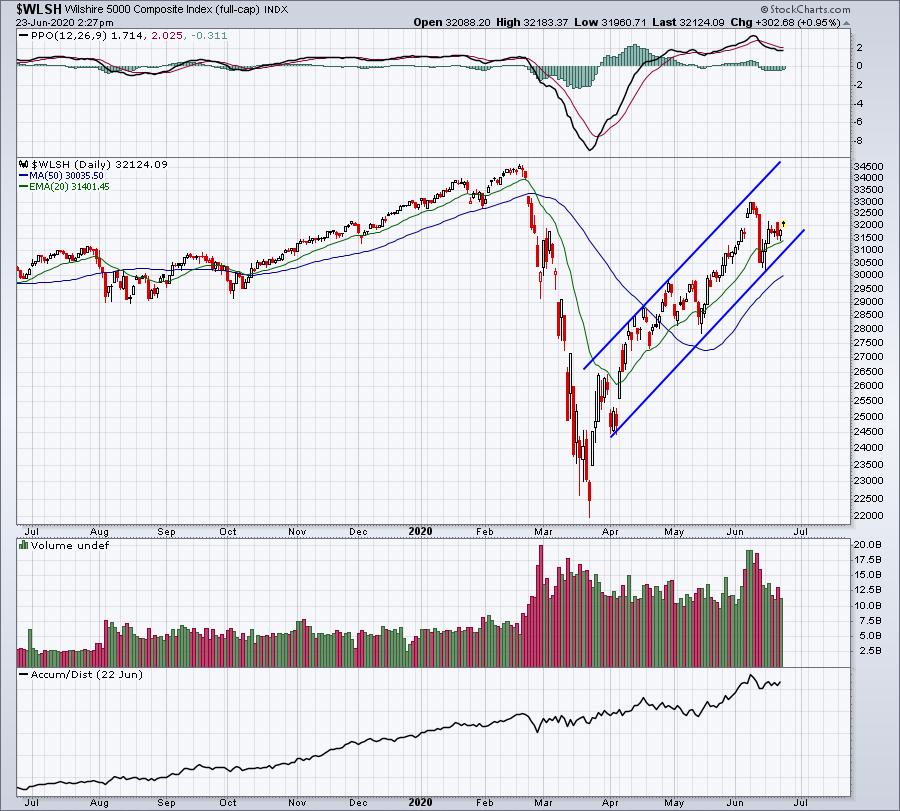
We do have to keep in mind that this is a very steep uptrend that will not last forever. When that lower uptrend line breaks, I would expect a more meaningful period of consolidation to take place. That very well could be the July through September period as historically that's the worst time of the year to invest in U.S. equities.
Sector/Industry Focus
Restaurants & bars ($DJUSRU) have broken to fresh new relative lows vs. the benchmark S&P 500, suggesting that we be very careful within this group. Stocks like Chipotle Mexican Grill (CMG) and Wingstop (WING) have been able to weather the relative downturn, but others have not. If you ever want to venture into a stock that's a component of a lagging industry group, always be sure you're trading one of the very best stocks within the group. Check out the current relative weakness of the DJUSRU:
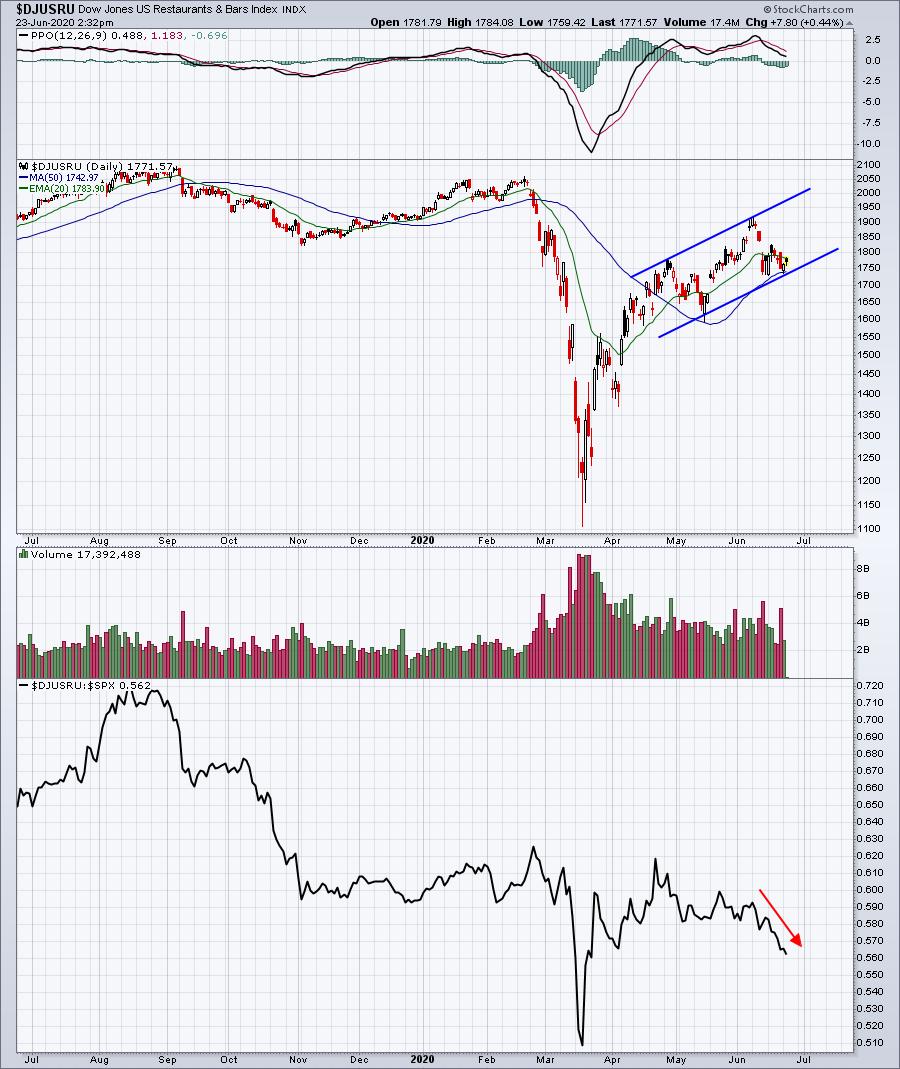
If you just look at the top part of the chart, you can see that the absolute strength of the DJUSRU doesn't appear to be bad at all. However, the bottom panel shows that the group is rolling over on a relative basis and now trades at its worst relative level since March.
ChartLists
Since we have a new toy (ChartList), I thought I'd run a scan against it and see what stocks might pop up. I decided to run a high volume scan to see which stocks on this Strong Future Earnings ChartList (SFECL) has traded at least double their normal daily volume today. Here's the list:
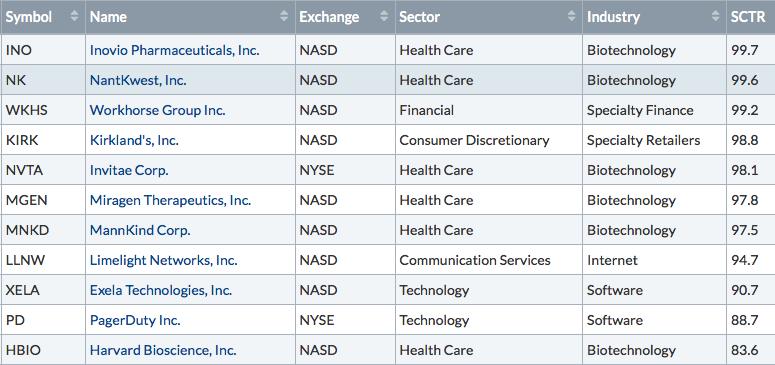
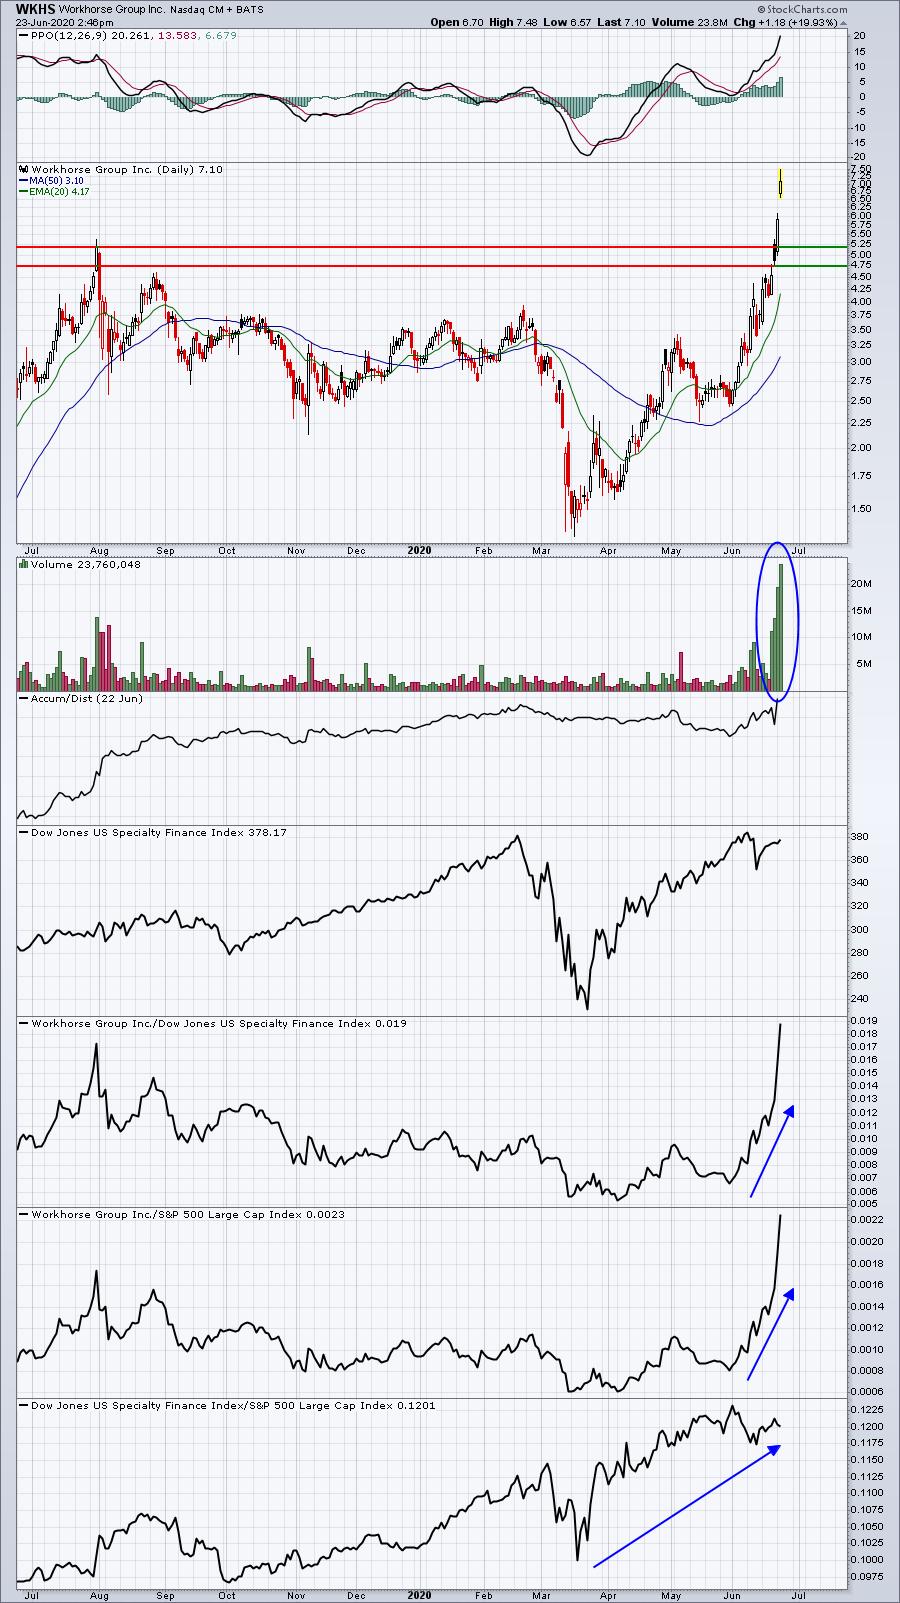
The first thing I noted was that 7 of these 11 stocks are biotechnology stocks. They can be extremely volatile, so please be careful trading any of these names. The two that grabbed my attention were the following:
WKHS:
LLNW:
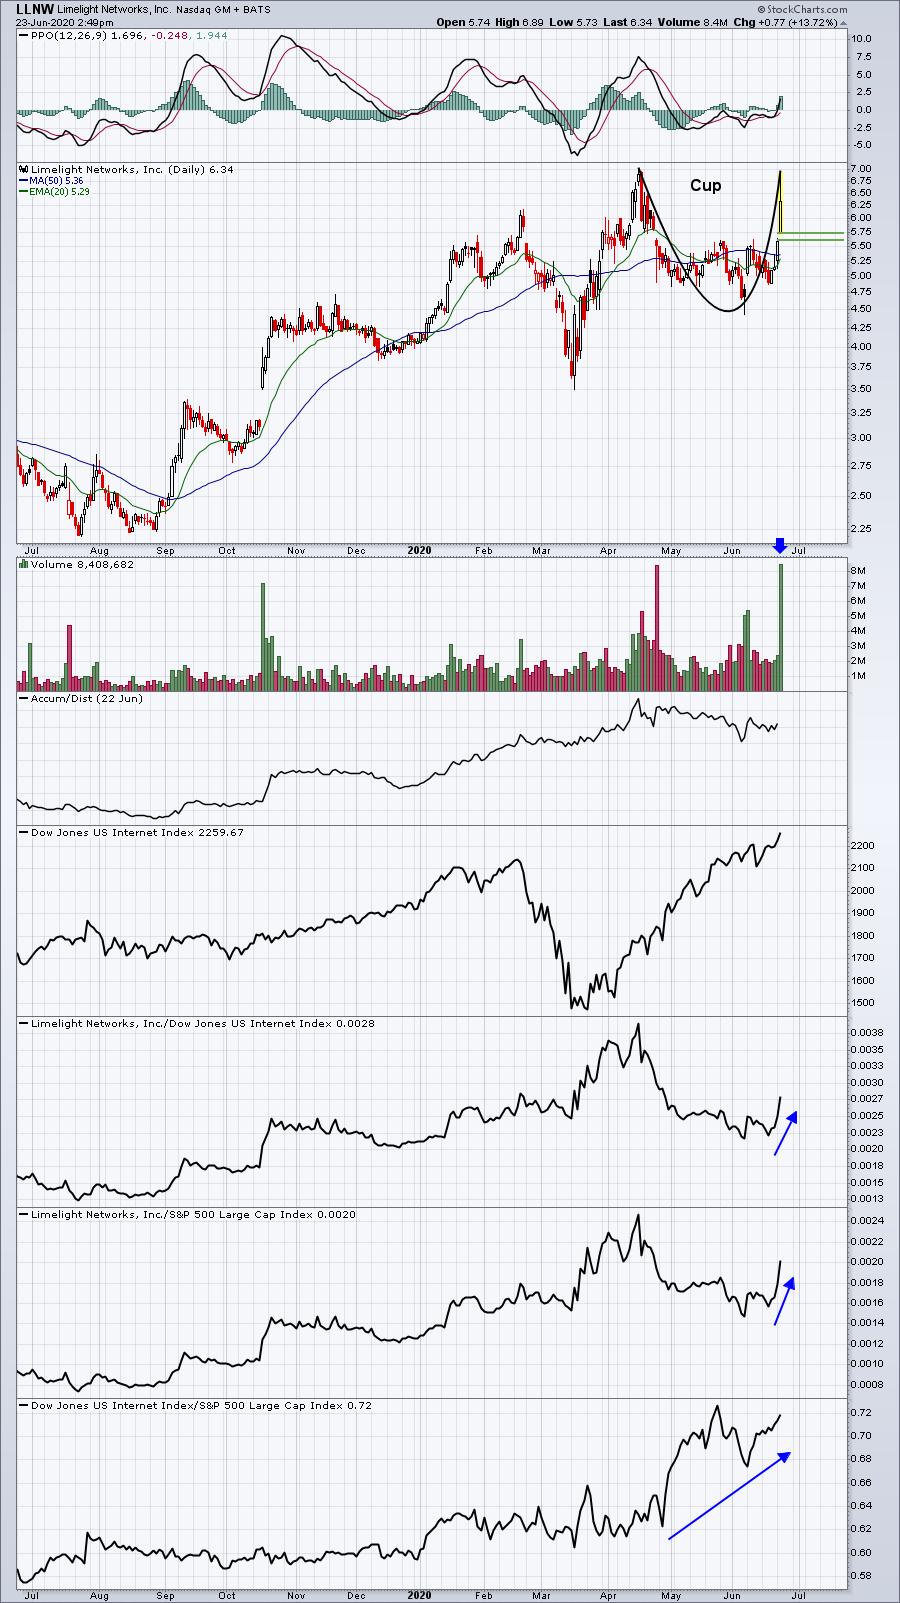
Both of these stocks hail from strong (or strengthening) industry groups. That's what this ChartList is all about. It's about trying to uncover stocks poised to deliver exceptional quarterly results, but not already included on our Strong Earnings ChartList. WKHS and LLNW are both trading as though good news is coming, but chasing after strong rallies adds significant short-term risks. I've highlighted levels of support to watch in future days/weeks. Hopefully, it occurs on lighter volume and sets the stocks up for explosive moves into earnings.
Earnings Reports
Here are the key earnings reports for today and tomorrow, featuring stocks with market caps of more than $10 billion. I also include a few select companies with market caps below $10 billion. Finally, any portfolio stocks (or active trade alerts) that will be reporting results are highlighted in BOLD. If you decide to hold a stock into earnings, please understand the significant short-term risk that you are taking. Please be sure to check for earnings dates for any companies you own or are considering owning:
Tuesday, June 23:
INFO, AVAV, LZB
Wednesday, June 24:
FIZZ, KBH, BB, NG, WGO, FUL, PDCO
Economic Reports
June PMI composite flash: 46.8 (actual) vs. 45.0 (estimate)
May new home sales: 676,000 (actual) vs. 636,000 (estimate)
Happy trading!
Tom