
EB Daily Market Report - Wednesday, June 24, 2020
Executive Market Summary
- Our major indices opened weak today and the selloff has accelerated
- The NASDAQ 100 is the best performer on a relative basis, but is still lower by 2.14%
- Small caps ($SML) and mid caps ($MID) are the worst performing indices
- Energy (XLE, -5.14%), real estate (XLRE, -3.56%), industrials (XLI, -3.24%), and financials (XLF, -3.23%) are today's lagging sectors
- Consumer staples (XLP, -1.75%) is the best performing sector
- The three worst performers on the S&P 500 are NCLH, RCL, and CCL - all cruise lines
- Airlines ($DJUSAR) are also very weak, down another 6.80% as a group
- Overall, the pandemic stocks that led on a relative basis in March/April are leading on a relative basis now
Market Outlook
I don't know if you were able to tune into my Trading Places LIVE show this morning at EarningsBeats.com, but I discussed the consequences if the QQQ (ETF that tracks the NASDAQ 100) were to fall beneath Tuesday's price low of 247.82. A reversing shooting star printed on Tuesday with a negative divergence in play. I pointed out that the market has had its head down and has ignored all sorts of warning signs of late, but that I'd be remiss if I didn't mention the bearishness of yesterday's action. First, check out the shooting star candle (looks like an upside down hammer):
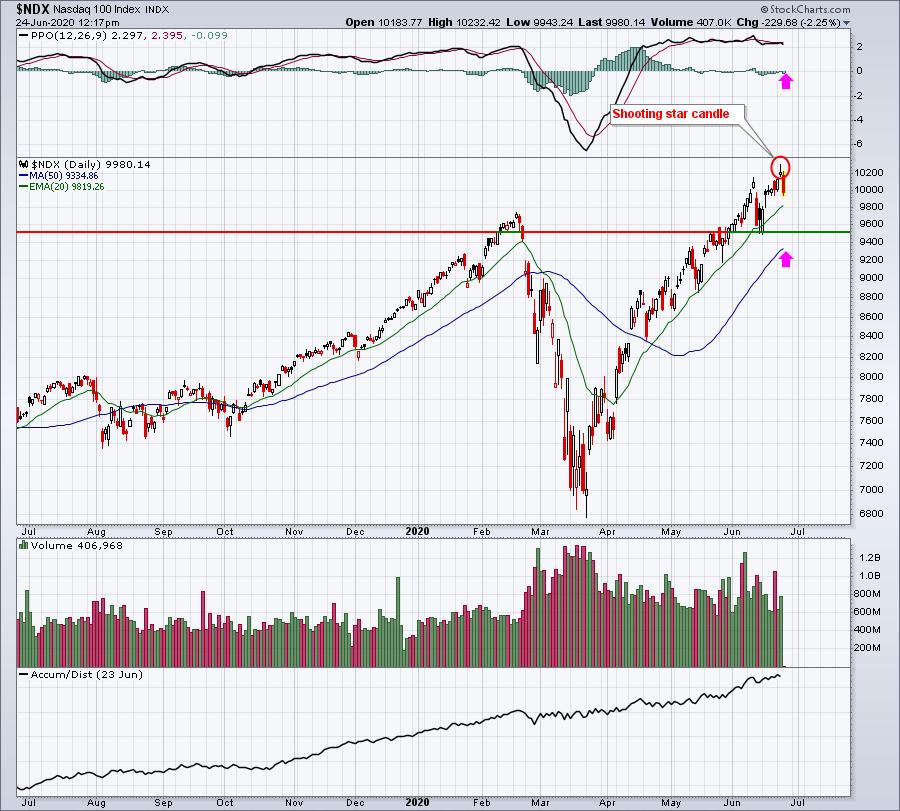
I didn't annotate it, but if you look at the chart, you'll see that the NDX printed a higher high on Tuesday with a lower PPO. That's a negative divergence. When I see the combination of a negative divergence and a reversing candle, I begin to think "PPO centerline test" and/or "50 day SMA test" (pink arrows). The NASDAQ has been extremely resilient, but I pointed out earlier this month the typically weak June for technology stocks. We're not quite out of June, so maybe we're just seeing historical weakness catch up with this area.
As a reminder, here's the seasonality chart for technology (XLK) for the past two decades:
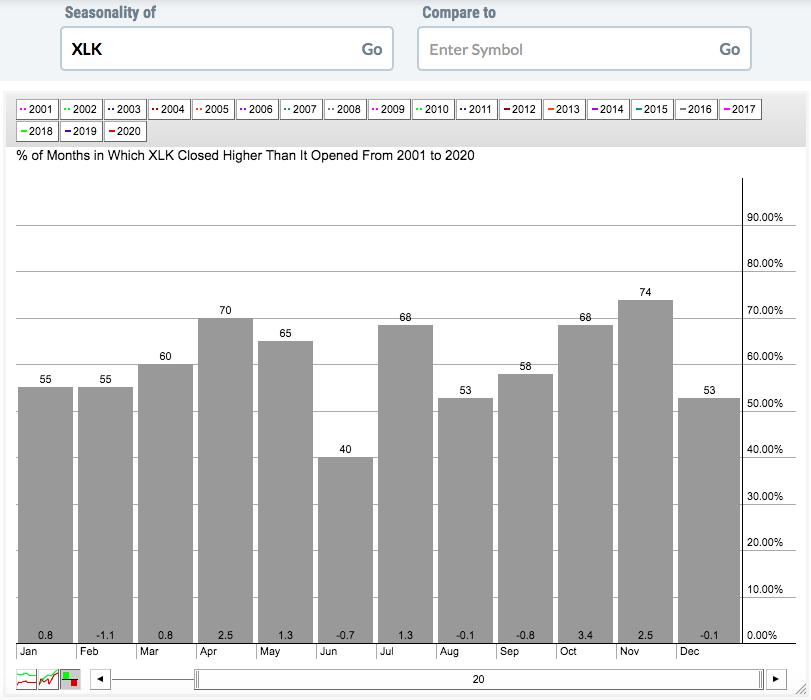
June has definitely been a problem child for the XLK, but June 2020 shows a rise of around 4-5% right now, even with today's intraday losses.
Sector/Industry Focus
The depths of the current selling will depend on a number of factors obviously, but one that I'll be watching closely will be the aggressive semiconductors group ($DJUSSC). The relative strength of this technology area is quite strong, which bodes well for the longer-term. However, if the absolute trend channel breaks to the downside, that will almost certainly put additional pressure on the NASDAQ 100 and potentially cause a more significant short-term breakdown. Here's the current look at the semiconductors:
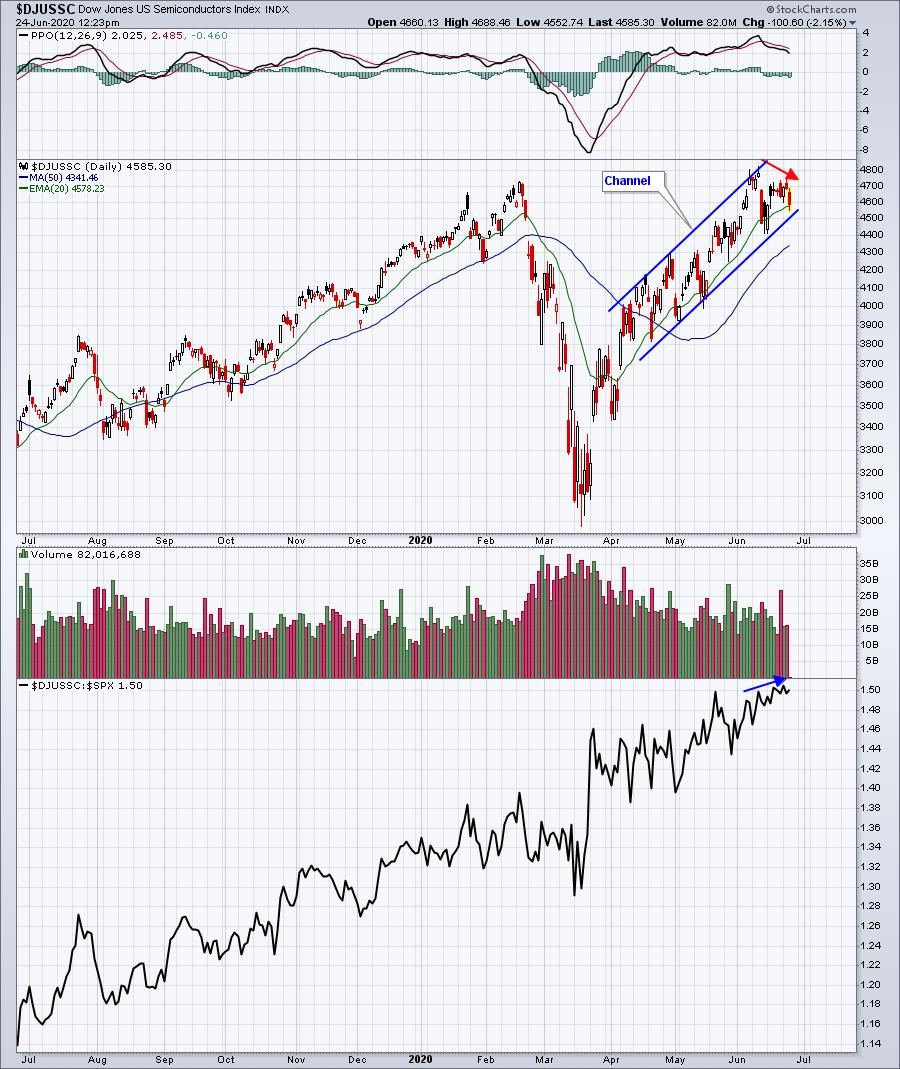
Unlike the NASDAQ 100, the DJUSSC does not have a negative divergence. At its last high in early June, the PPO was also at a high. Under these circumstances, I expect pullbacks to be contained at the rising 20 day EMA. As a result, watching the DJUSSC to see if it holds channel and 20 day EMA support will be very important for the NASDAQ 100 as a whole.
ChartLists
This morning on the show, I looked at one Short Squeeze stock that's caught my attention and I mentioned this one in last Friday's DMR as well. It's Alpha Pro Tech (APT), which is currently up more than 11% today. I was watching for a break above 17.40-17.50 on increasing volume and we were on the verge of getting that breakout on Tuesday. Today, APT is in full breakout mode:
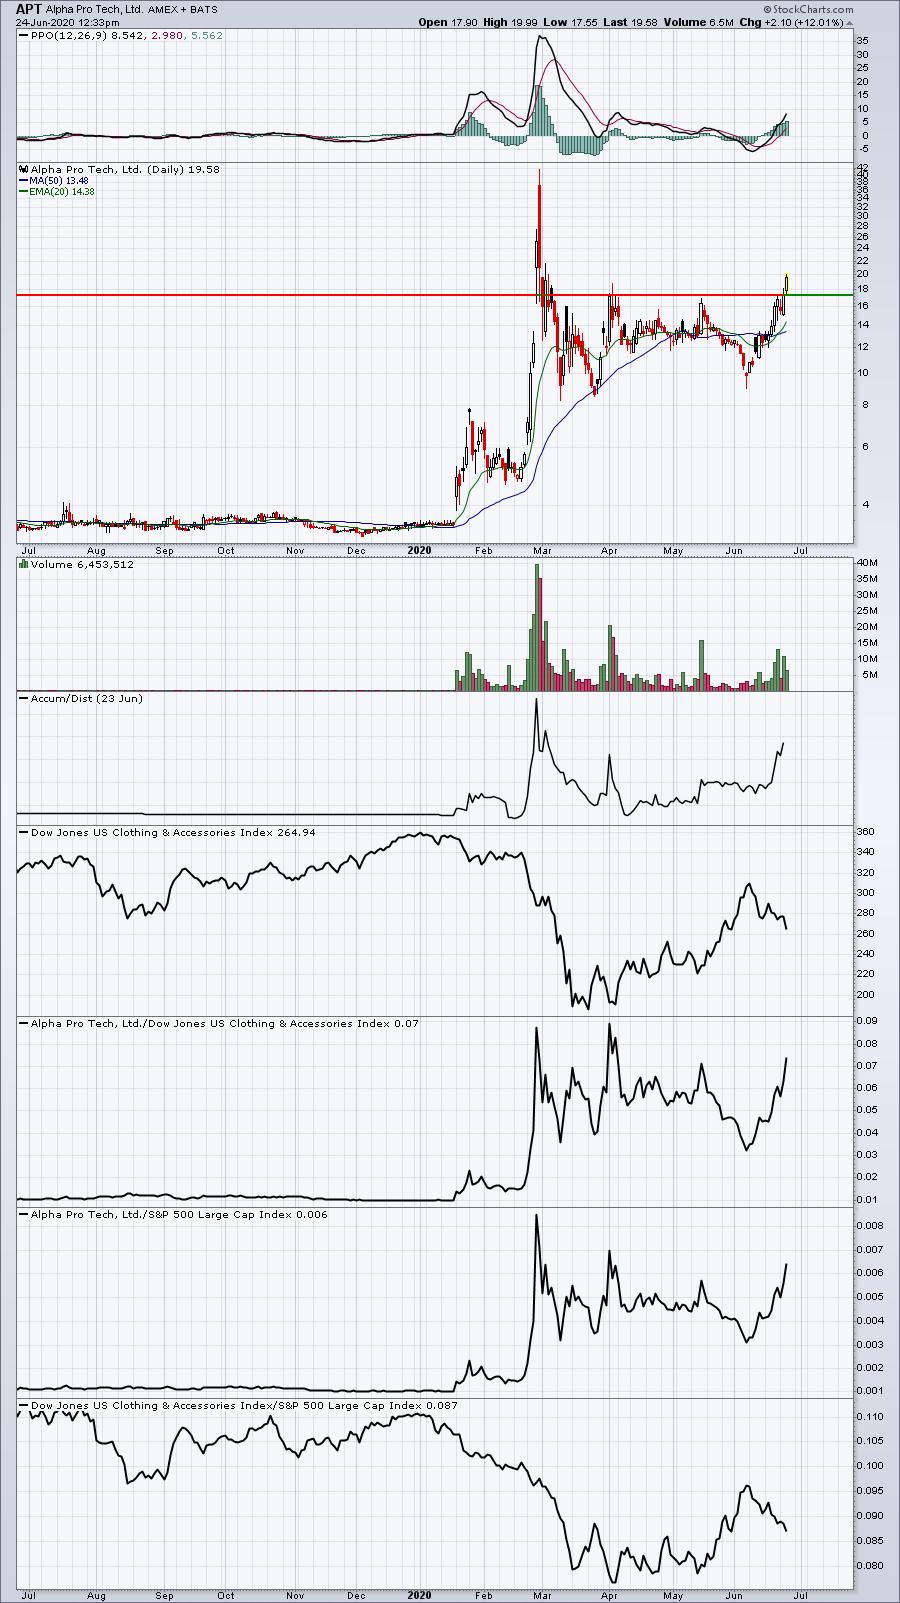
As a short-term trader, I'm picking my spots for trades until we see how deep this overall selling goes. From a longer-term perspective, I'm not concerned at all. But regardless of your time frame, it still makes sense to be aware of the technical and seasonal issues the market faces right now. We've got one more day before we move to the other side of the bearish 19th to 25th calendar day period and with a Volatility Index ($VIX) at 35 and up nearly 13% on the session, the market can lose a lot of ground in 24 hours.
Personally, I try to keep trade capital invested to a minimum during periods like this. If I miss out on some upside, so be it. I just don't want to get caught up in a steep short-term selloff. I honor my short-term stops.
Earnings Reports
Here are the key earnings reports for today and tomorrow, featuring stocks with market caps of more than $10 billion. I also include a few select companies with market caps below $10 billion. Finally, any portfolio stocks (or active trade alerts) that will be reporting results are highlighted in BOLD. If you decide to hold a stock into earnings, please understand the significant short-term risk that you are taking. Please be sure to check for earnings dates for any companies you own or are considering owning:
Wednesday, June 24:
FIZZ, KBH, BB, NG, WGO, FUL, PDCO
Thursday, June 25:
NKE, ACN, MKC, FDS, DRI, SNX, WOR, PRGS, RAD
Economic Reports
April FHFA house price index: +0.2% (actual) vs. +0.4% (estimate)
Happy trading!
Tom