
EB Daily Market Report - Friday, June 26, 2020
StockCharts TV Appearance
Yesterday, I joined StockCharts TV for an episode of "Your Daily 5". As the name implies, it's a daily show featuring a variety of technical analysts to provide 5 important charts. I provided a stock chart from each of our 5 ChartLists, describing the nature of each ChartList and how I came up with that particular stock. I wanted to mention it as I thought some of you might enjoy it......and it provides potentially some trading candidates. You can CLICK HERE for the video at YouTube.
Executive Market Summary
- U.S. equities are suffering through a fairly difficult day, extending the recent losing streak
- Financials (XLF) and communication services (XLC) are the two hardest hit sectors, both down more than 4% at last check
- Banks ($DJUSBK) are down 6% as the Fed announced that banks must suspend share repurchases and cap dividend payments in the upcoming quarter
- Separately, a falling 10 year treasury yield ($TNX) is adding to the bank's woes
- The TNX was down 4 basis points to 0.64%, threatening to break below 6 week yield support at 0.65%
- Facebook (FB) is under attack today, dropping more than 7% and testing its 50 day SMA for the first time since breaking above it in April
- Nike (NKE) is also testing its 50 day SMA and down more than 7% after reporting disappointing quarterly revenues and EPS
- Gold ($GOLD) is benefiting from the increased level of volatility ($VIX, +9.37%)
Market Outlook
We continue in our short-term downtrend. Up until the past few days, every single bit of selling has been met with increased buying pressure. That doesn't seem to be the case right now. As I mentioned in yesterday's DMR, lower daily highs and lower daily lows is the definition of a downtrend. We've seen that pattern again today. Here's an update of the S&P 500 chart that I posted yesterday:
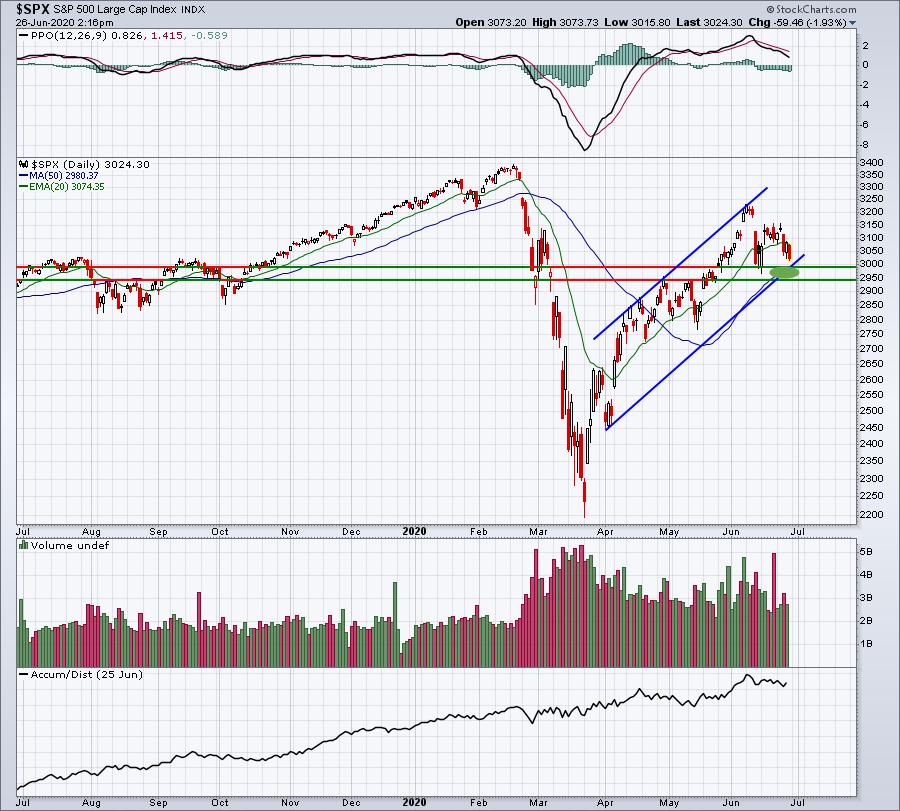
We are working our way down toward gap support (both opening and closing) and potentially channel support, although the latter would require a turn back to the upside probably somewhere in the 2990-3000 area.
Sector/Industry Focus
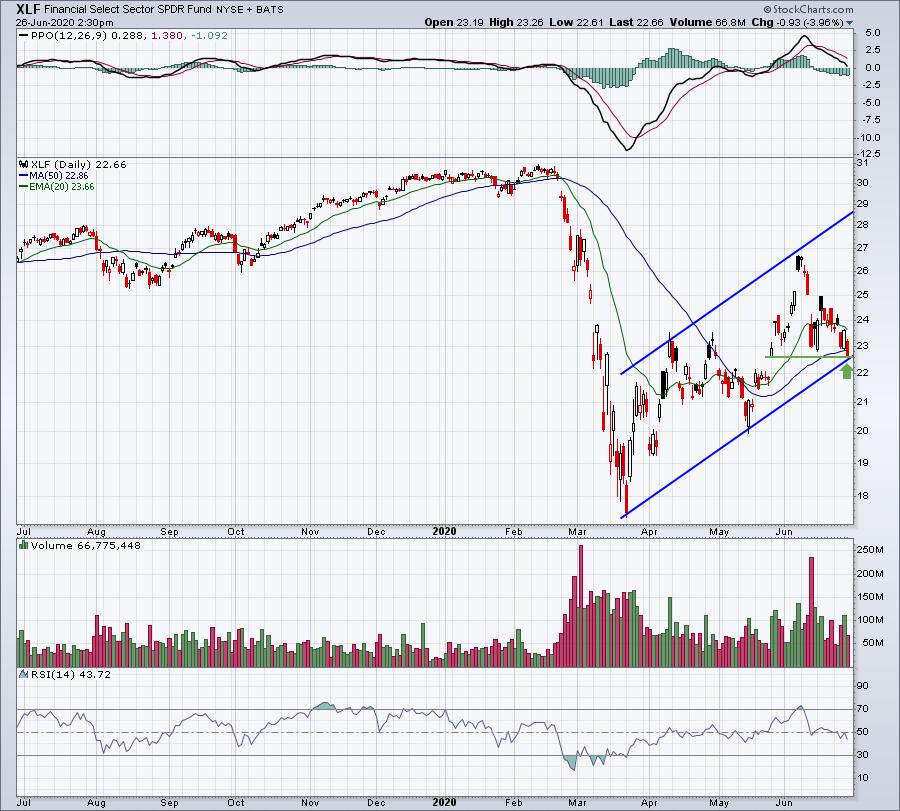
Financials (XLF, -3.88%) are getting beaten up again today, but I wouldn't be ready to write the group off. Yes, they're a lagging sector and no, I wouldn't be long a bunch of financial stocks because of that relative weakness. However, the XLF is currently testing the lower end of its up channel and this would be an excellent point for a reversal and recovery:
ChartLists
I'd remain somewhat cautious for now. Strong companies should absolutely be accumulated during periods of selling, but I'd take my time building such positions. I waited until late this afternoon to see if we might get an afternoon reversal. But it's currently 3pm ET and all of our major indices remain lower by 2-3%.
Here's what I'm doing. I'm using the Downtrend Reversal scan, in part, to identify strong companies with SCTRs over 90 that have printed lower highs at least four days in a row, including today. These are companies that I will be potentially looking to trade next week on the first sign of reversal (higher high). I ran this scan against the Strong Earnings ChartList (SECL), the Strong AD ChartList (SADCL), and the Strong Future Earnings ChartList (SFECL), and these were the companies with SCTRs above 90 that were returned for each of these scans:
SECL:
CWH, BYND, VIPS, CTXS
SADCL:
ZTO, RCUS, VIPS, HCHC, CCXI, CTXS, MASI
SFECL:
NK, KIRK, MGEN, MASI
Earnings Reports
Here are the key earnings reports for today and tomorrow, featuring stocks with market caps of more than $10 billion. I also include a few select companies with market caps below $10 billion. Finally, any portfolio stocks (or active trade alerts) that will be reporting results are highlighted in BOLD. If you decide to hold a stock into earnings, please understand the significant short-term risk that you are taking. Please be sure to check for earnings dates for any companies you own or are considering owning:
Friday, June 26:
None
Monday, June 29:
MU
Economic Reports
May personal income: -4.2% (actual) vs. -6.4% (estimate)
May personal spending: +8.2% (actual) vs. +8.6% (estimate)
June consumer sentiment: 78.1 (actual) vs. 78.9 (estimate)
Happy trading!
Tom