
EB Daily Market Report - Thursday, July 2, 2020
Special Notes
Here are 3 notes I want to pass along again today:
- The stock market will be closed tomorrow, Friday, July 3rd for Independence Day. Therefore, we'll be off as well, so there will be no Daily Market Report. I want to wish everyone a happy holiday weekend. Please be safe if you travel or are celebrating this weekend.
- On Monday, we will be having a Members-Only "2020 2nd Half Market Outlook" webinar that will begin at 4:30pm ET. This is typically a lengthy webinar as I'll be discussing my market forecast for the balance of 2020 (and my reasons supporting it), along with a look at many areas of the market to include our ChartLists. It should be a very timely and educational event. I hope you can make it. (If not, no worries as we'll record the event as we always do)
- Next Friday, July 10th, we plan to host a "Q&A" webinar beginning at 11am ET. The idea will be to answer many of the most frequently asked questions about our website, our style, our strategy, etc. I'll do my best to answer many of the questions that you've been sending in. Have a question or two you've been wanting to get answered? Use the following Survey Form and send them in!
Executive Market Summary
- Futures were very strong as a much-better-than-expected jobs report was released this morning
- June nonfarm payrolls were 60% above expectations, while May's number was revised higher
- Unemployment is now trekking lower, at 11.1% for June
- Despite the surge in jobs, the 10 year treasury yield ($TNX) is down a basis point to 0.67%
- Global markets were higher overnight and this morning; the German DAX ($DAX) is up nearly 3% today
- Energy (XLE) and materials (XLB) are the strongest areas, while real estate (XLRE) is the only sector in negative territory
- Automobiles ($DJUSAU) are getting a huge lift from Tesla (TSLA) as quarterly sales crush expectations; a Wedbush analyst raised TSLA's price target from $1250 to $2000
Market Outlook
We're once again witnessing the impact of new money coming into the market. The last trading day of a calendar month and the first two trading days of a calendar month are BY FAR the best three consecutive days of the month. Seriously, nothing is even close. Below is a 60 minute chart on the NASDAQ 100 ($NDX) that helps to visualize this strength:
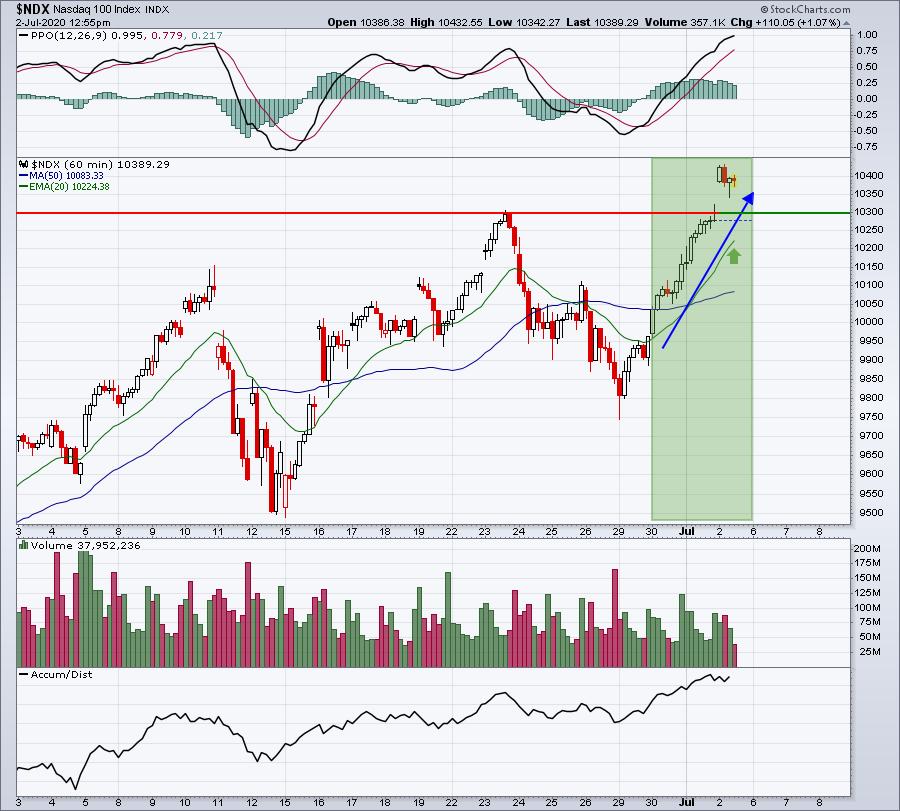
The blue directional line and the green-shaded area highlight this 3 day performance. It's not always quite this bullish, but just remember that the historical tendency is for prices to rise during this period of the calendar month. Next, check out that PPO. It's pointing straight up, which is indicative of accelerating bullish momentum. It doesn't mean we won't see any selling, but it does suggest to me that if the NDX were to weaken, the rising 20 hour EMA (green arrow) would likely provide excellent short-term support.
Sector/Industry Focus
If you go to our Relative Strength Industry Group ChartList (available for annual EB.com members to download to their StockCharts.com account at any time) in Summary form and rank them based on Y-T-D performance, you might be surprised by the #1 industry group on the list. It's automobiles ($DJUSAU). Tesla (TSLA), one of our Model Portfolio stocks, is up 189.74% thus far in 2020. It's actually topped by Nikola Corp (NKLA), which is higher by an eye-popping 496.13%! NIO Inc. (NIO) is up 132.99%. While TSLA has been the one grabbing the headlines, there are other auto companies riding much higher as well. Meanwhile, Harley Davidson (HOG), Ford Motor (F), and General Motors (GM) are down 35.38%, 33.40%, and 29.28%, respectively. So it's not a "one size fits all" kind of group. We need to continue to focus on the leaders. Here is how the DJUSAU chart looks now:
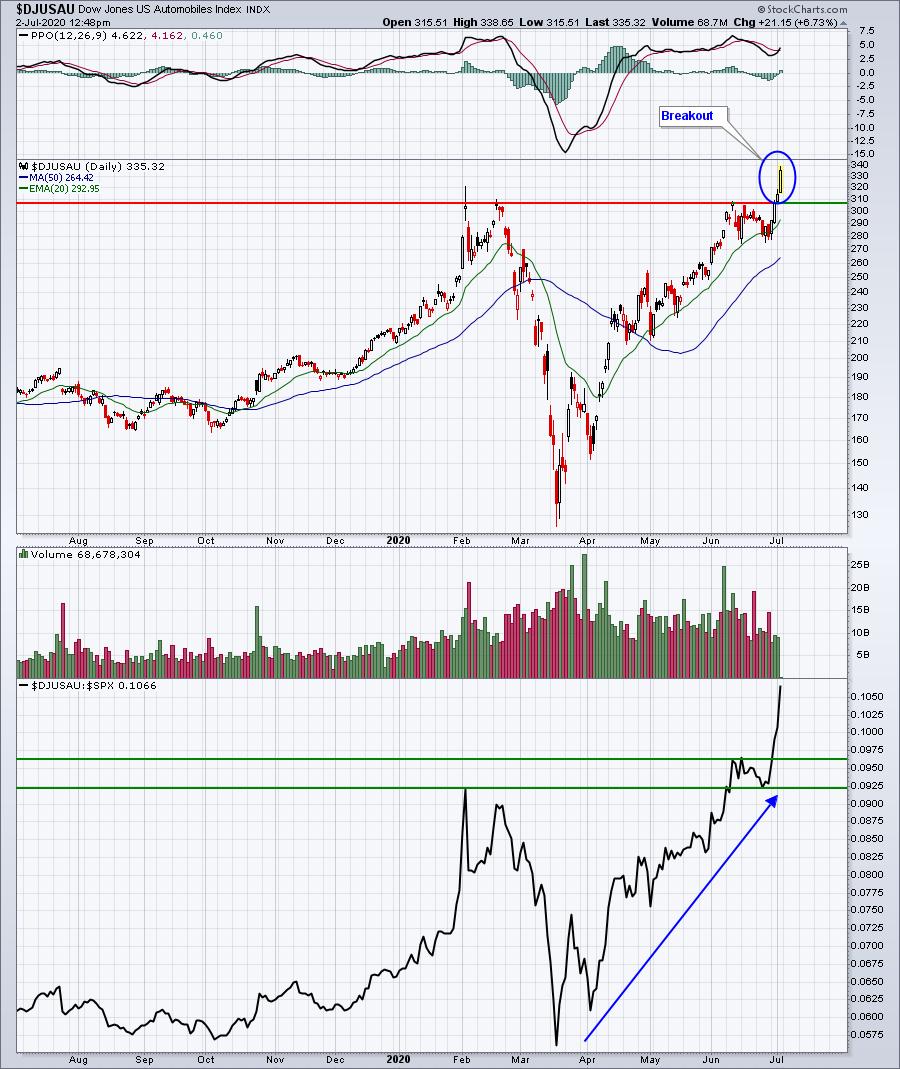
I don't know how long this amazing level of relative strength persists, but I do know we want to be a part of it while it lasts.
ChartLists
Today, I ran a high volume scan against the Short Squeeze ChartList (SSCL) and the Strong Earnings ChartList (SECL) to see what opportunities I might find.
On the SSCL, the following 8 stocks have already traded their average daily volumes as of 11:45am ET: AXDX, FIZZ, FRAN, MTCH, OPTN, PLUG, YRCW, ZYNE. Let's look at two:
AXDX:
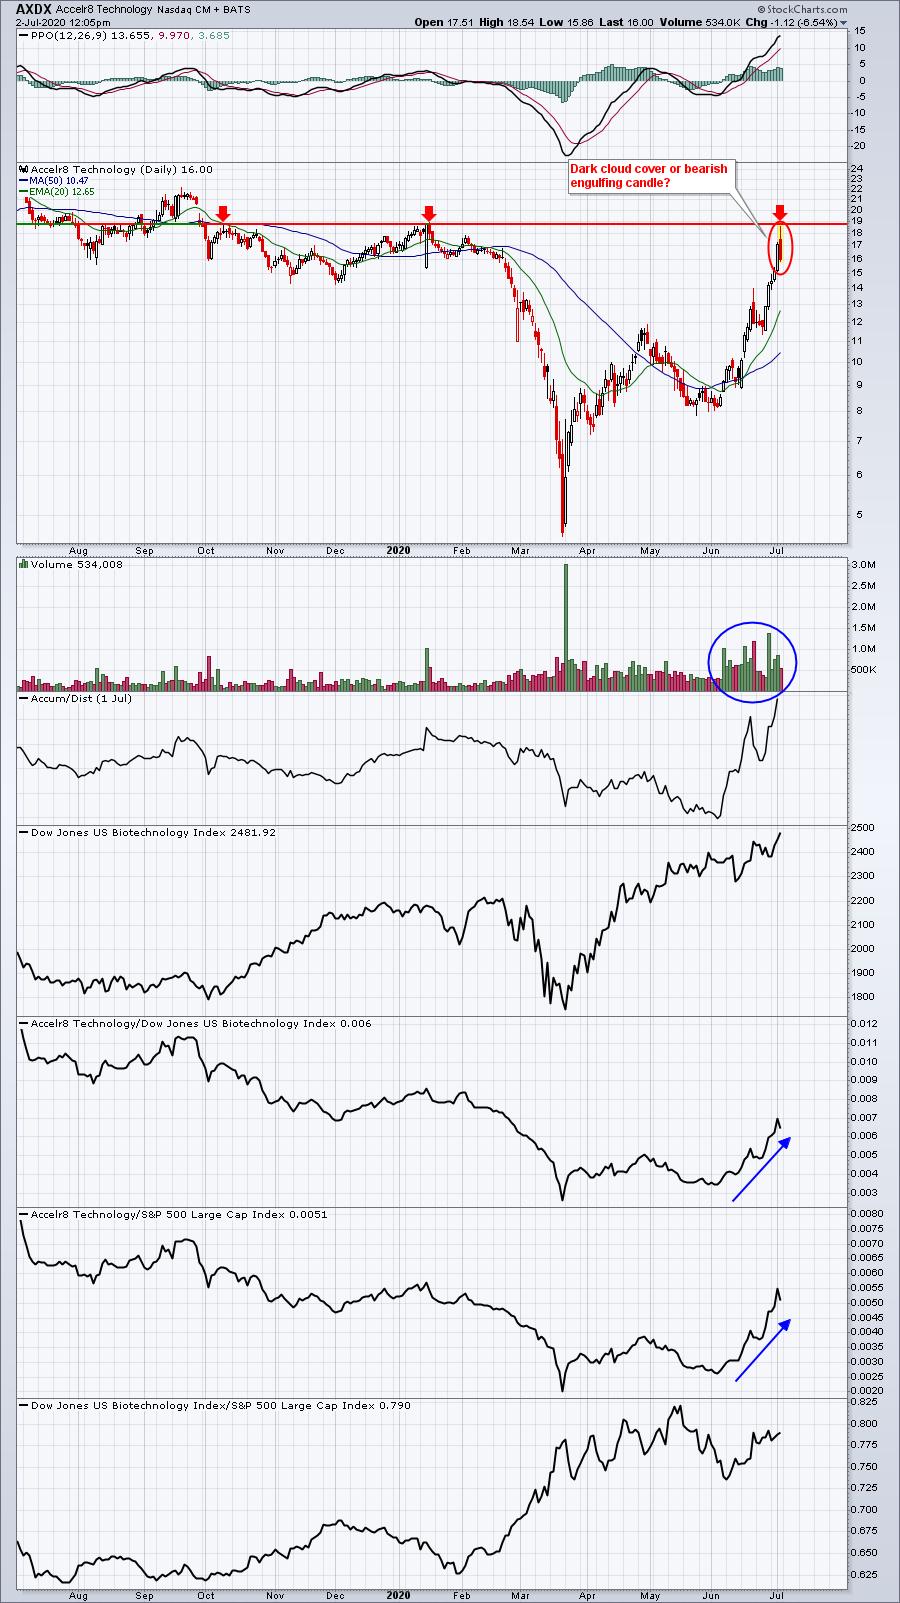
No matter how you slice it, this has been a major short squeeze. But, AXDX did nearly touch a very key price resistance level earlier today and it's potentially printing a reversing candle. That could change by the close, so if you own this one, you'll need to look at the candle around 3:55pm ET. It's been a powerful run, so a short-term selloff down to 13-14 wouldn't be shocking to me. A breakout above 19 on a closing basis would be an indication that it's likely to have further upside.
OPTN:
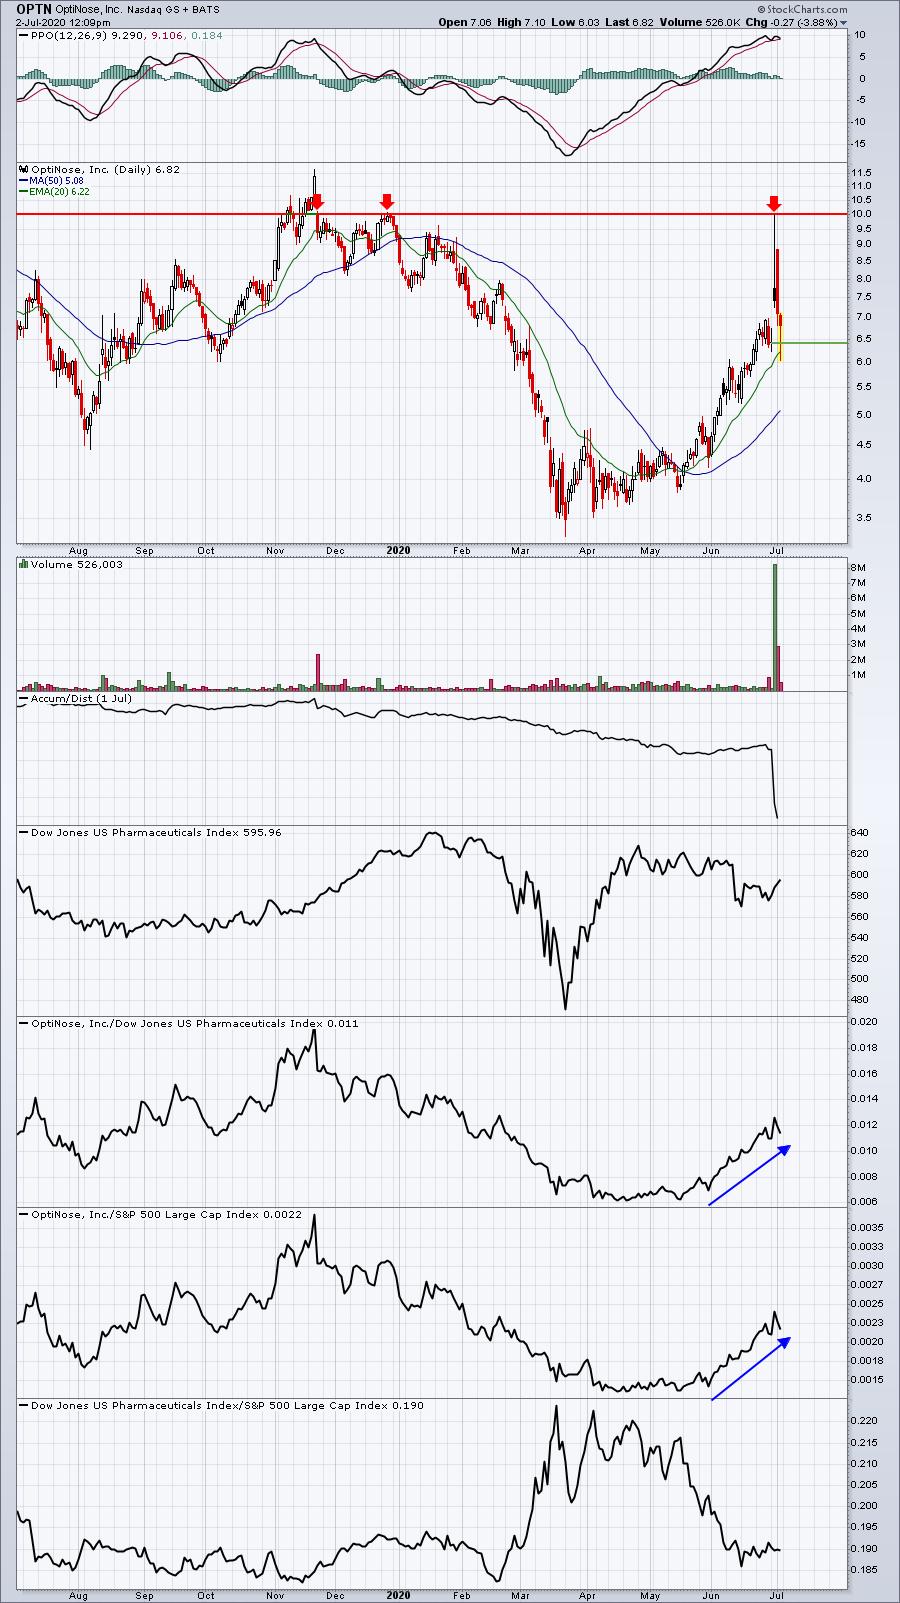
I know sometimes it seems like a stock cannot possibly pull back to test a rising 20 day EMA, but OPTN is a perfect example of how quickly it can happen. Today, it completely filled its gap, while also testing that rising 20 day EMA. OPTN is incredibly volatile and now has a short-term trading range from 20 day EMA support to price resistance at 10.
On the SECL, the following 6 stocks have already traded their average daily volumes as of 11:45am ET: AKAM, ANGI, DOCU, FSLY, IIVI, ODP. Here we'll look at the three that are most important technically:
AKAM:
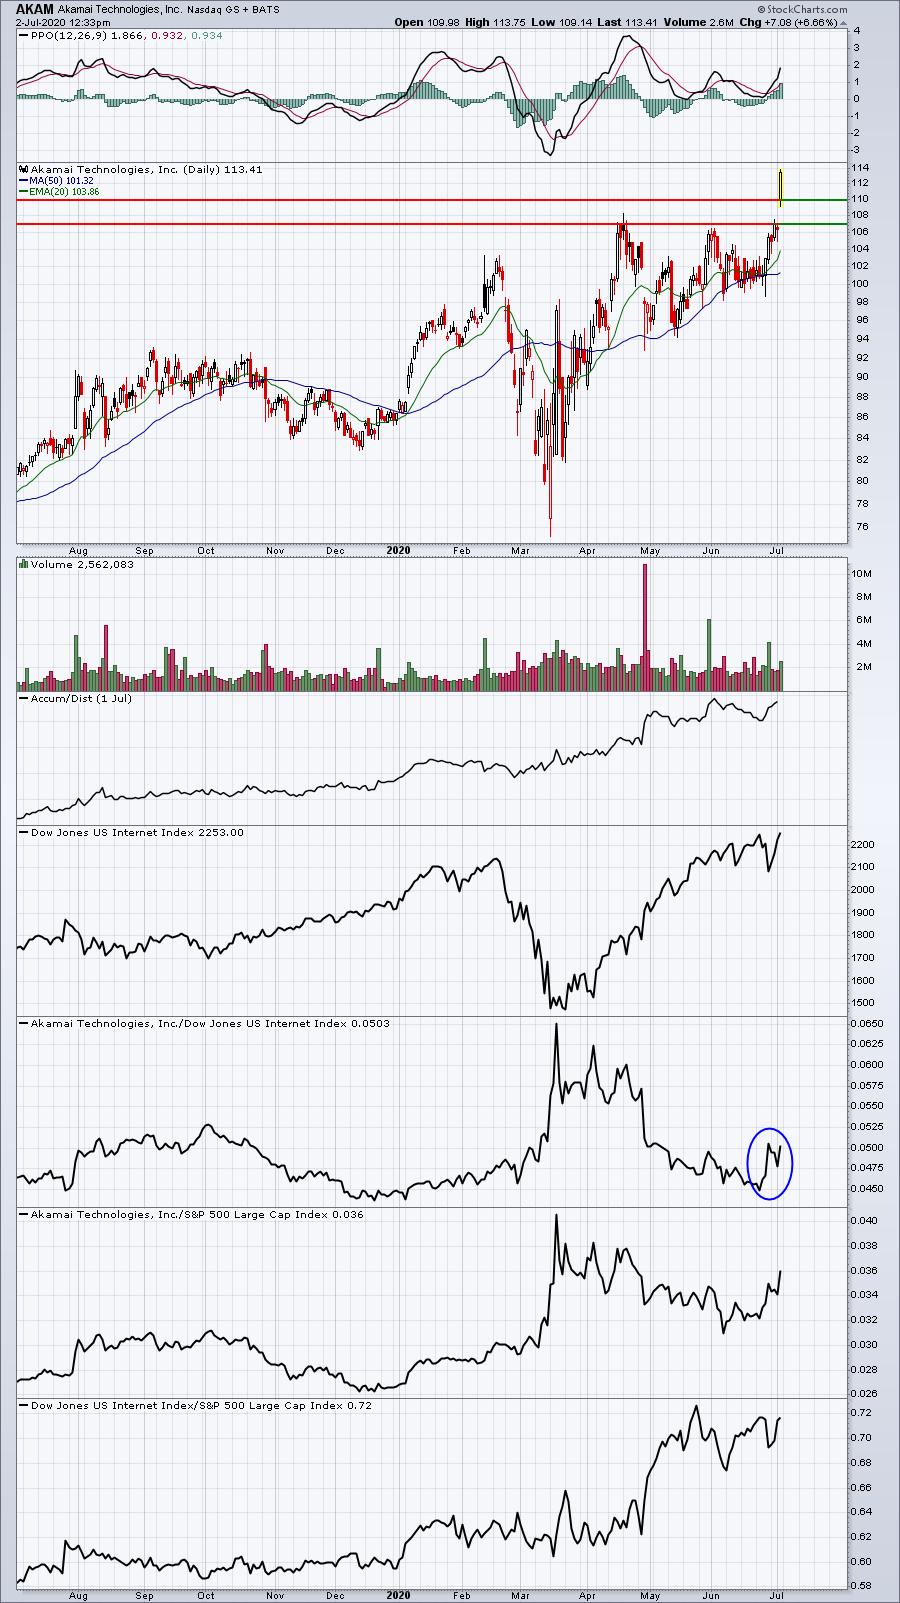
AKAM was listed yesterday as one of the stocks I was awaiting breakout on. Well, it's here. I like the stock from its current price down to the bottom of gap support near 107.
ANGI:
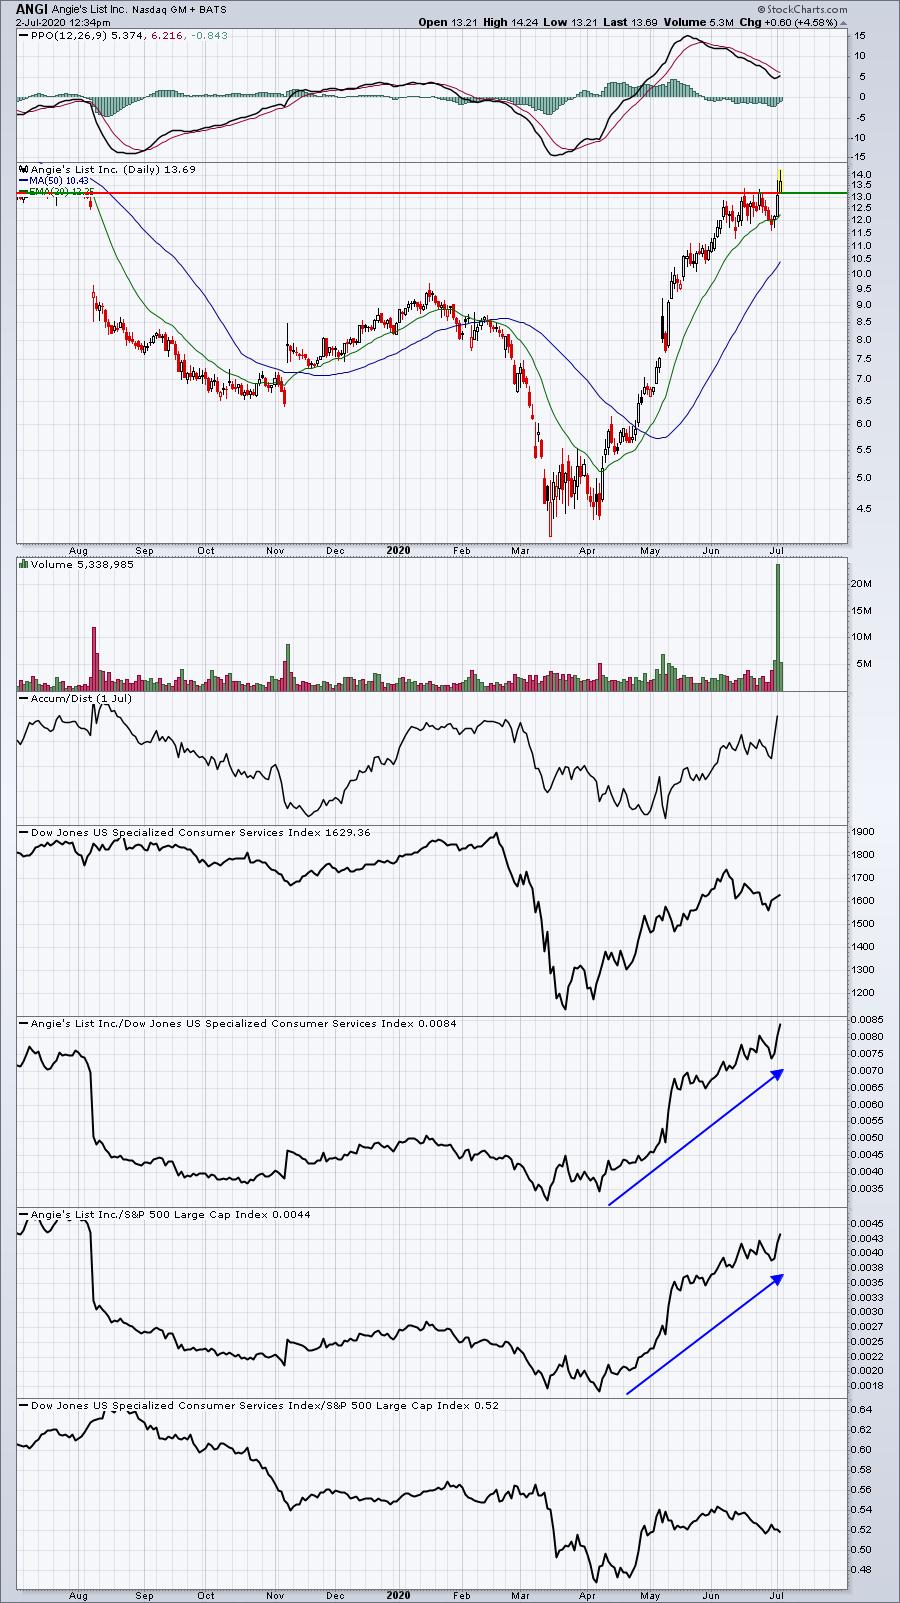
Like AKAM, ANGI is breaking out and volume is confirming the breakout. It appears as though Wall Street is expecting an excellent upcoming earnings report.
IIVI:
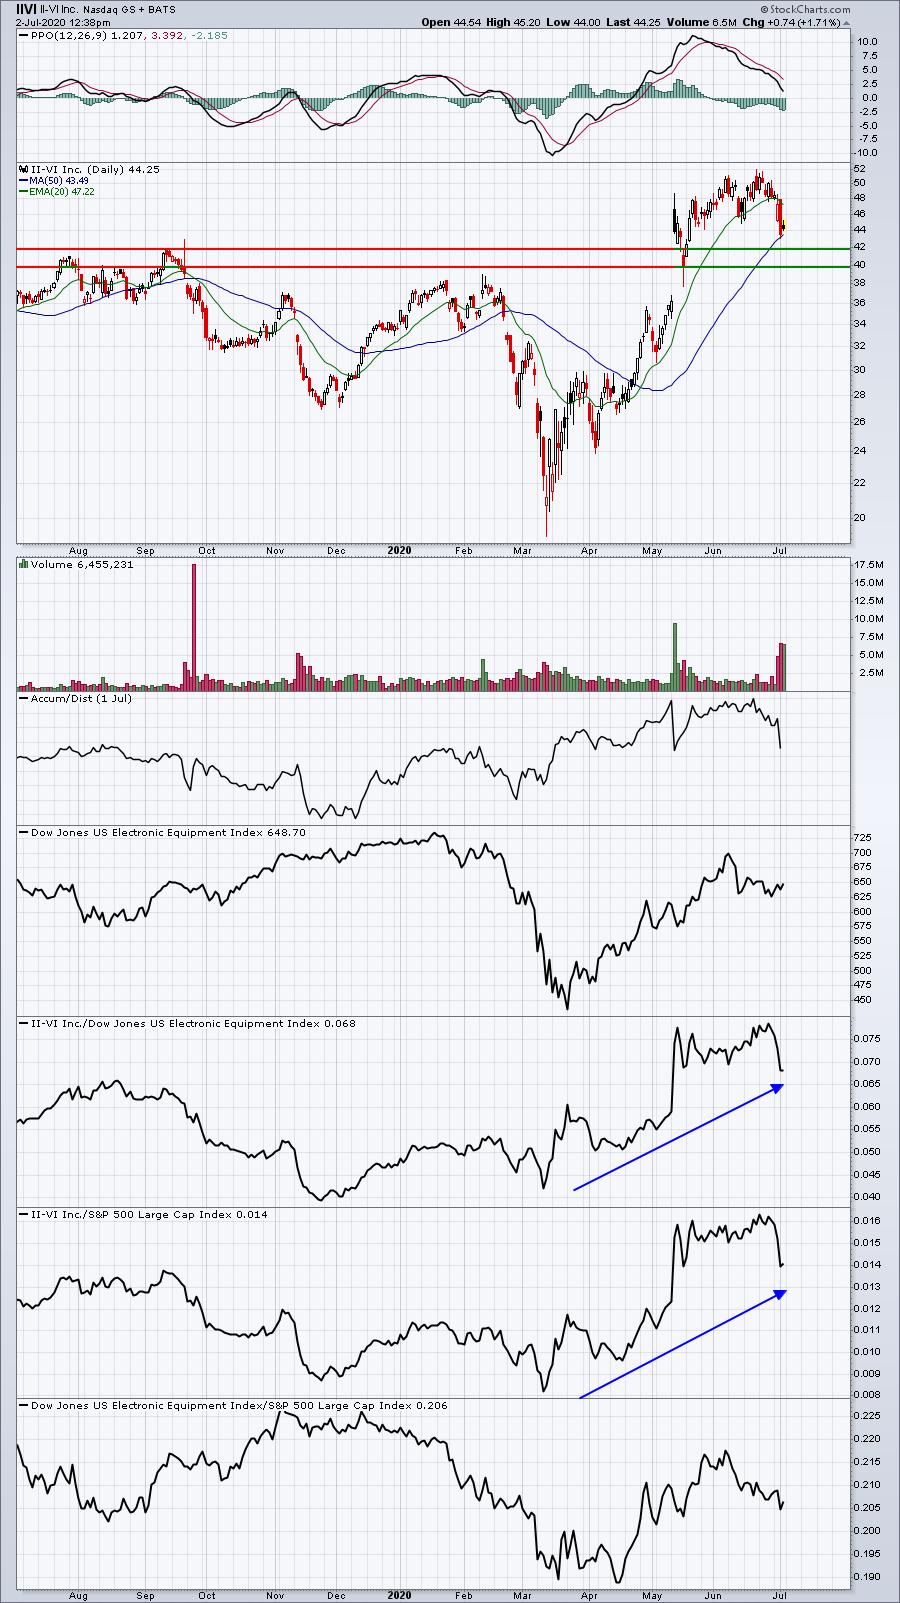
IIVI is a different animal. It's been a leader, but it's now pulled back 15% to test its rising 50 day SMA. I think there's still the possibility of a bit more selling, but accumulating a position from the current price down to the 40-42 range makes some sense.
Earnings Reports
Here are the key earnings reports for today and tomorrow, featuring stocks with market caps of more than $10 billion. I also include a few select companies with market caps below $10 billion. Finally, any portfolio stocks (or active trade alerts) that will be reporting results are highlighted in BOLD. If you decide to hold a stock into earnings, please understand the significant short-term risk that you are taking. Please be sure to check for earnings dates for any companies you own or are considering owning:
Thursday, July 2:
KFY, LNN
Monday, July 6:
None
Economic Reports
June nonfarm payrolls: 4.80 mil (actual) vs. 3.00 mil (estimate)
June private payrolls: 4.77 mil (actual) vs. 2.66 mil (estimate)
June unemployment rate: 11.1% (actual) vs. 12.4% (estimate)
June average hourly earnings: -1.2% (actual) vs. -0.8% (estimate)
Initial jobless claims: 1,427,000 (actual) vs. 1,400,000 (estimate)
May factory orders: +8.0% (actual) vs. +8.7% (estimate)
Happy trading!
Tom