
EB Daily Market Report - Monday, July 6, 2020
Special Event - 2020 2nd Half Market Outlook
Please note: We will not be sending out another email later today with webinar room instructions. Be sure to use the link provided below or connect from the member home page.
Later this afternoon at 4:30pm ET, we will be having a Members-Only "2020 2nd Half Market Outlook" webinar. This is typically a lengthy webinar as I'll be discussing my market forecast for the balance of 2020 (and my reasons supporting it), along with a look at many areas of the market to include our Portfolios and ChartLists. It should be a very timely and educational event. I hope you can make it. (If not, no worries as we'll record the event as we always do).
To access the webinar room this afternoon, you'll be able to follow a link on our member home page OR you can simply click on the link below:
https://us02web.zoom.us/j/84052207419
Executive Market Summary
- Futures were substantially higher after the July 4th holiday weekend
- Gold ($GOLD) remains just below $1800 per ounce, while crude oil ($WTIC) is down fractionally
- The 10 year treasury yield ($TNX) is up 3 basis points to 0.70%
- Asian markets soared overnight, while European markets are up mostly between 1.50-2.00% today
- Communication services (XLC), technology (XLK), and consumer discretionary (XLY) - 3 aggressive sectors - are leading today's action
- Utilities (XLU) and energy (XLE) are the only two sectors not participating; renewable energy ($DWCREE), however, is up more than 7%
- S&P 500 leaders include four of our portfolio stocks in the Top 10 - CMG, DXCM, KLAC, and AMZN; the latter cleared 3000 today
Market Outlook
The S&P 500, unlike the NASDAQ 100, has not broken back out above its early-June high. Currently, this benchmark index is consolidating as follows:
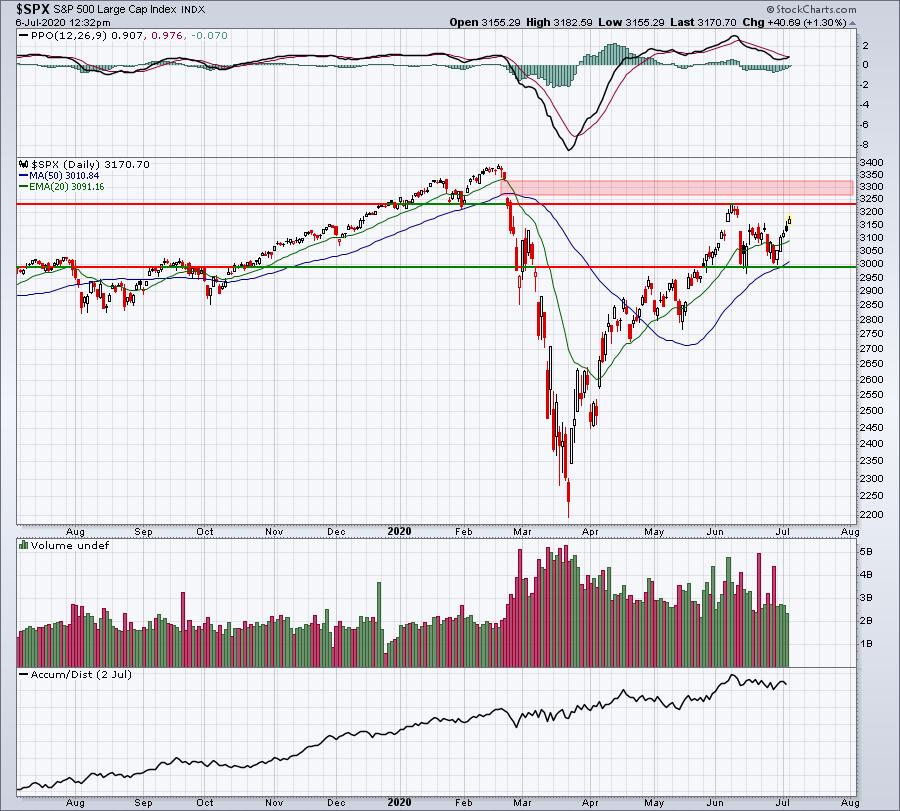
There's closing resistance at 3232 from June 8th that must initially be negotiated. Then there's significant gap resistance created by those panicked headlines in late-February. That gap resistance range is from 3257 to 3337. It would not be at all surprising to see the S&P 500 struggle in this zone. But I expect this zone to be tested sooner rather than later.
Sector/Industry Focus
It's not the best industry group today, but home construction ($DJUSHB) is higher by nearly 3% on today's session as it consolidates between 850 and 975:
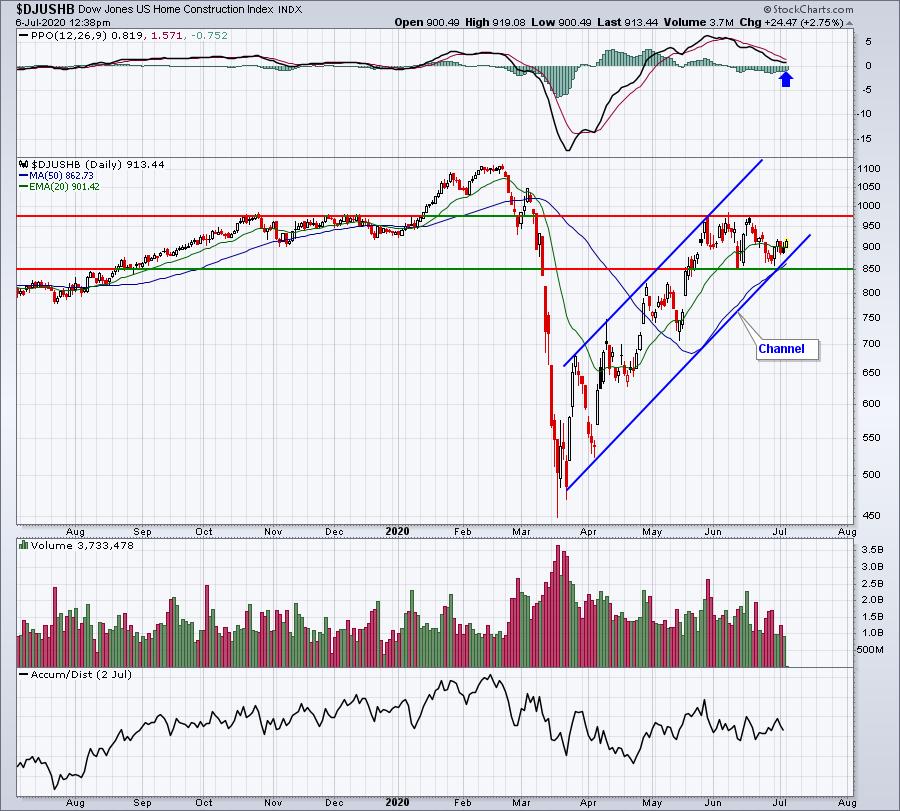
The sideways action here has allowed the DJUSHB to move closer and closer to its support line within its up channel. A close below 850 would be very bearish, but that's not what I'd expect to see here. Sideways consolidation that follows an uptrend generally results in a breakout to the upside. That's what I'd be looking for.
ChartLists
First, I want to let you know that the Strong Earnings ChartList (SECL) has been updated, adding 18 companies that reported solid results the past 2-3 weeks. When logged in at EarningsBeats.com, and on the left navigational panel, click on "ChartLists" under "Members". The SECL is the first ChartList featured and there are instructions of how to download it into your StockCharts.com account - so long as you're an Extra member (or above). If you're not an Extra member or above at StockCharts.com, you'll be able to view the 325 charts one at a time, but you won't be able to download them. Trust me, it's worth the monthly cost of an Extra membership to be able to download all of our research into your account.
Today, I just want to highlight a few interesting charts that I saw as I reviewed our various ChartLists:
CALX:
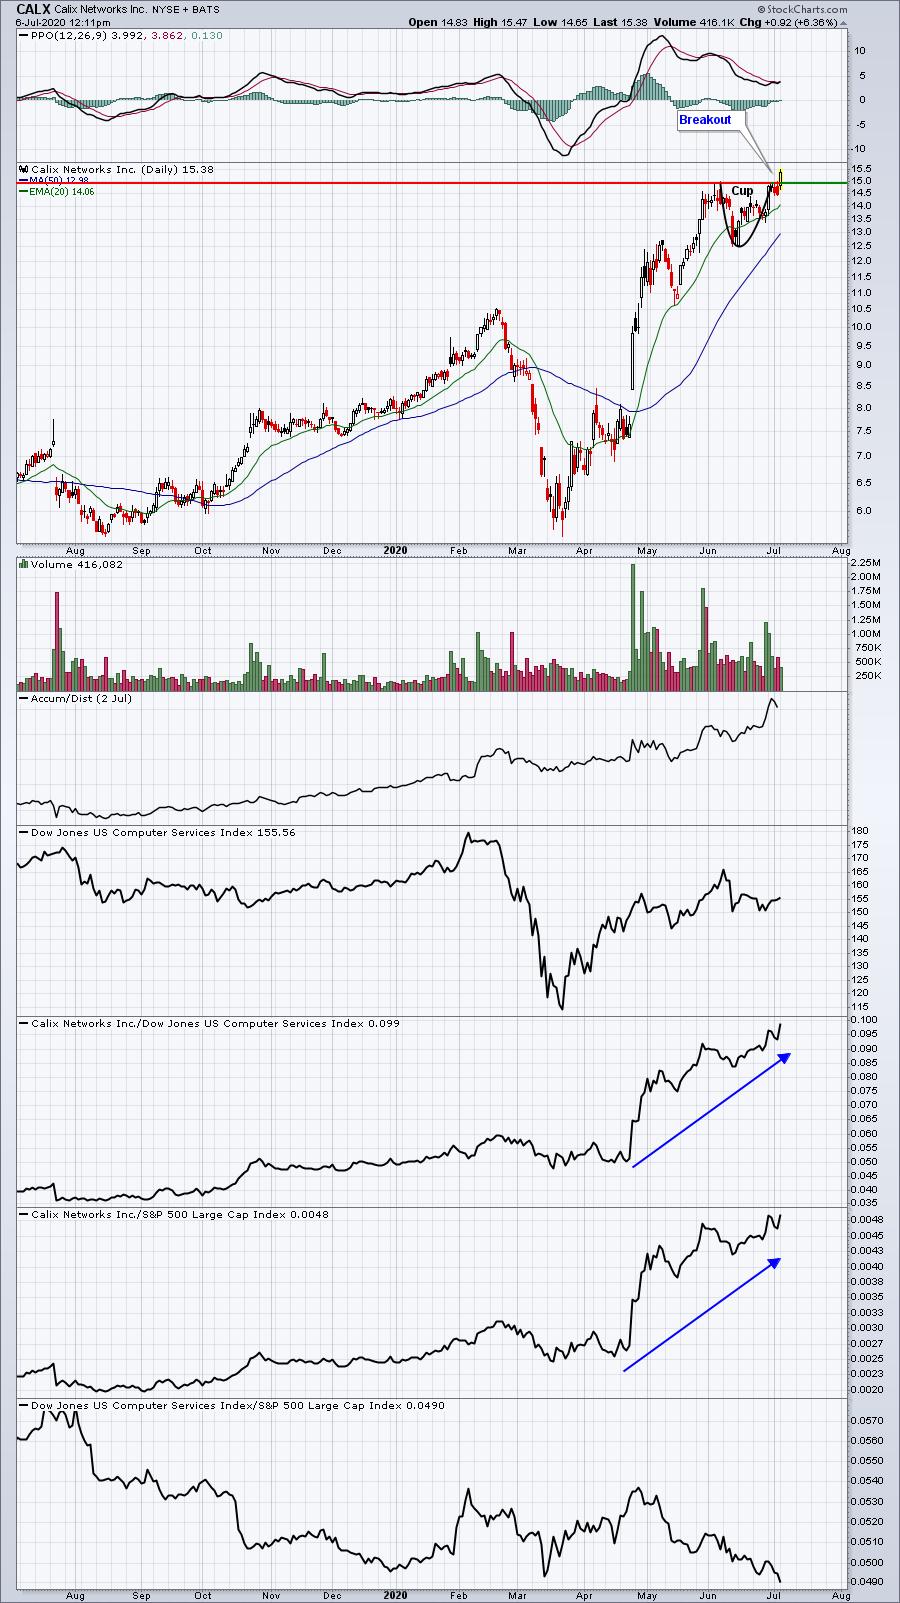
The volume appears solid on this breakout. CALX is a clear leader among its peers, but if there's one issue here, it's that its industry group has been very weak relative to the S&P 500. That just means to me that we want to make sure we keep a fairly tight stop in play.
DXCM:
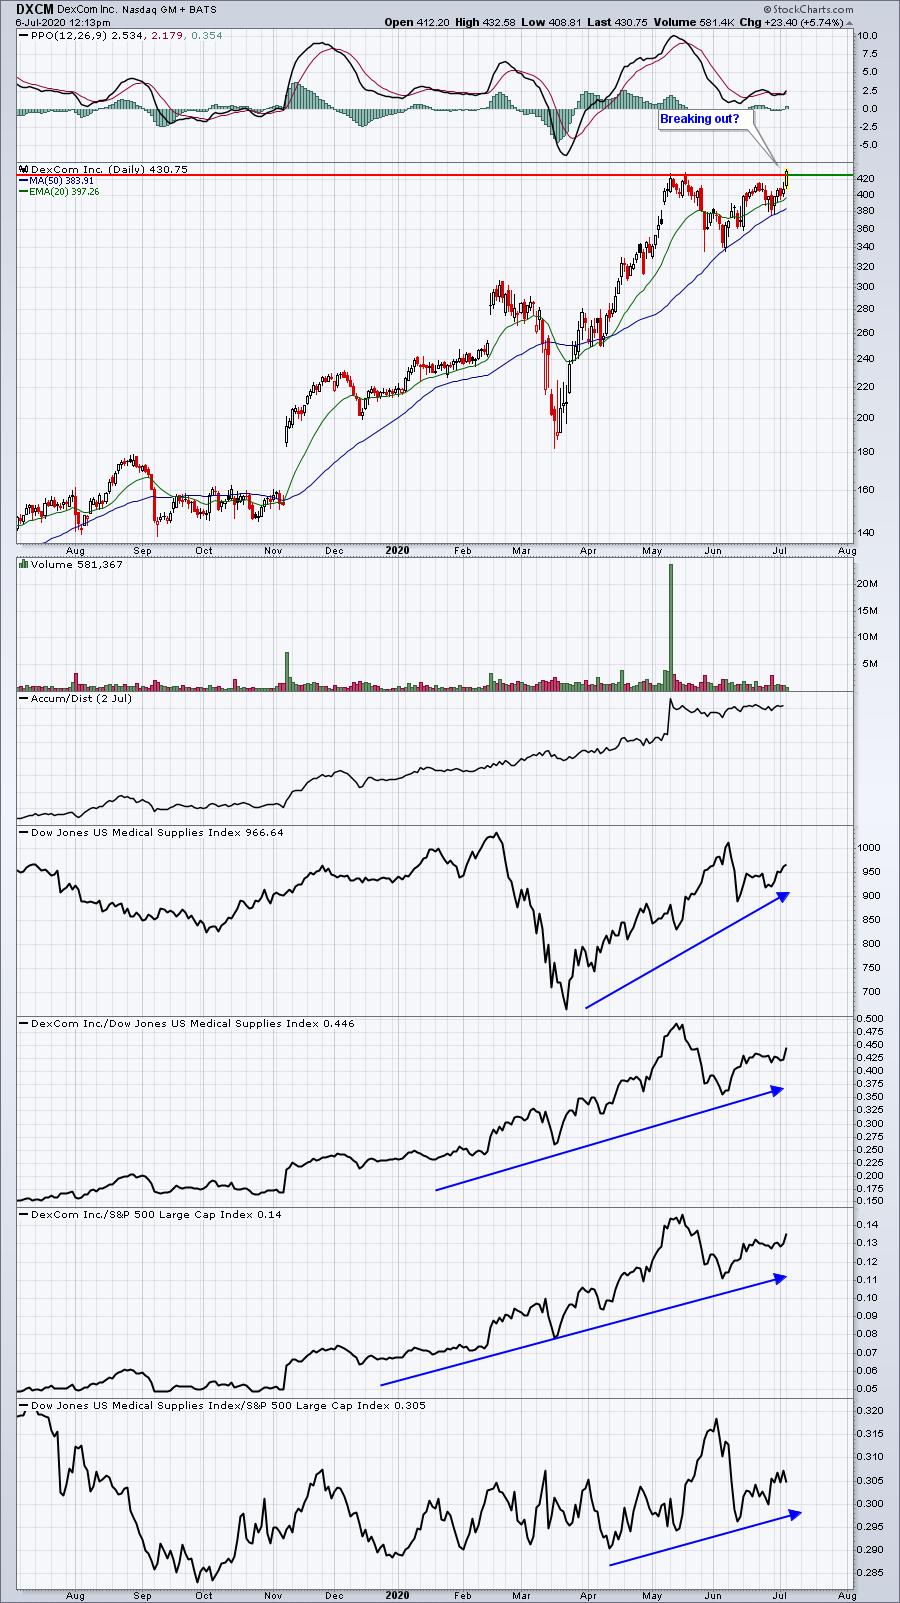
This could be a very significant breakout on one of our favorite stocks at EarningsBeats.com. DXCM is in our Aggressive Portfolio, so a breakout here could be the beginning of a significant pre-earnings rally.
CMG:
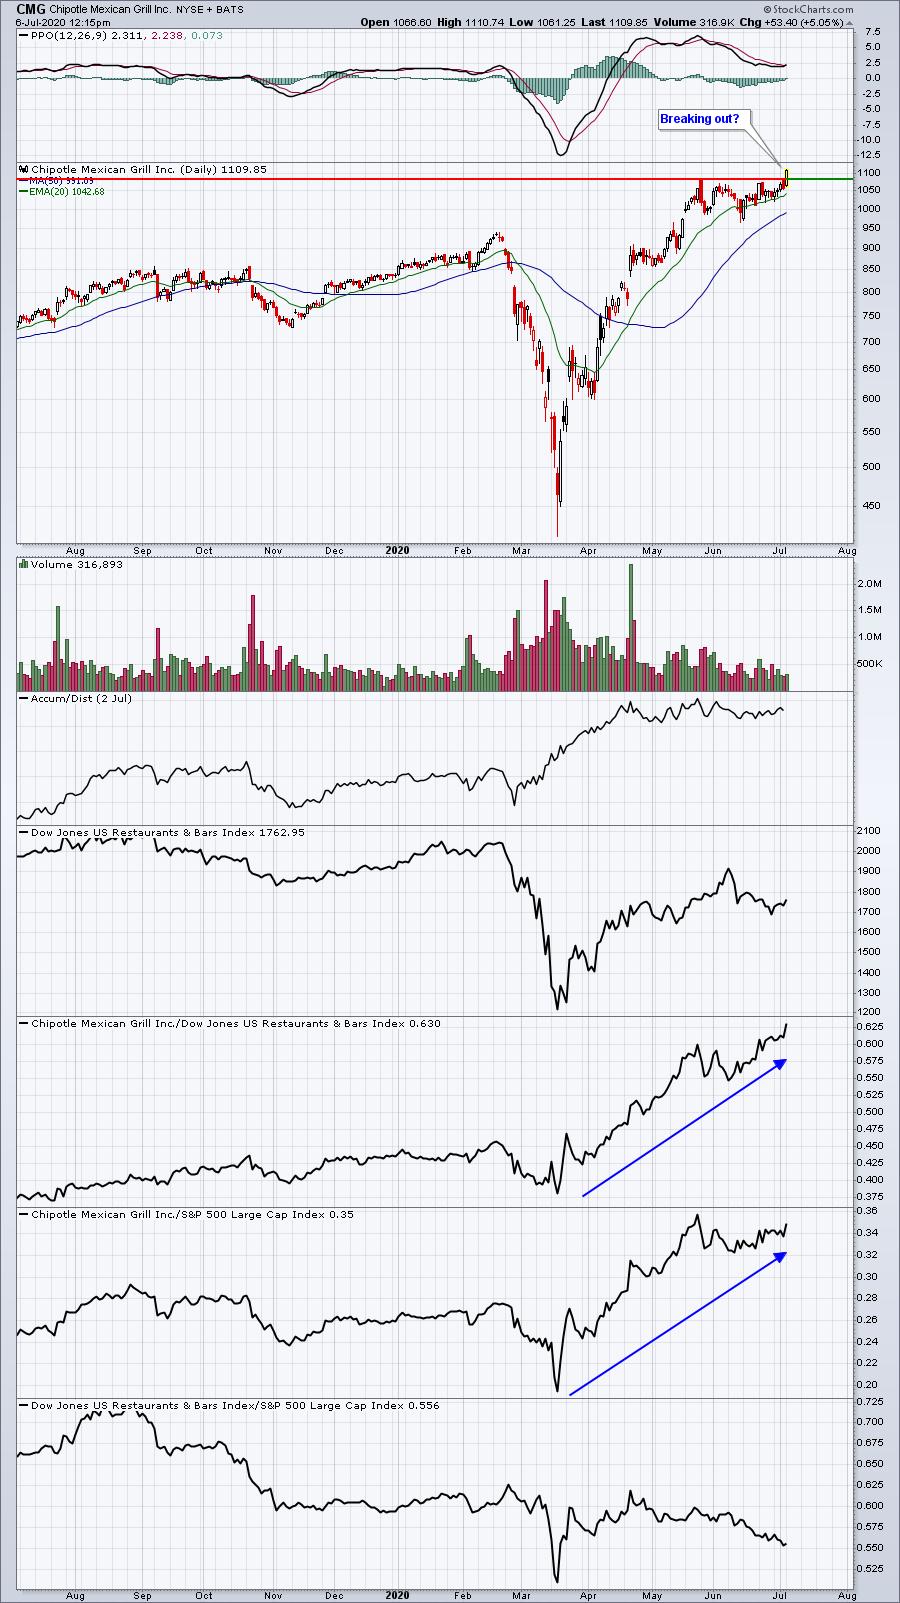
CMG has been consolidating for weeks, but today appears as though it could be starting another leg higher. It's another big favorite of ours and currently resides in our Model Portfolio.
Earnings Reports
Here are the key earnings reports for today and tomorrow, featuring stocks with market caps of more than $10 billion. I also include a few select companies with market caps below $10 billion. Finally, any portfolio stocks (or active trade alerts) that will be reporting results are highlighted in BOLD. If you decide to hold a stock into earnings, please understand the significant short-term risk that you are taking. Please be sure to check for earnings dates for any companies you own or are considering owning:
Monday, July 6:
None
Tuesday, July 7:
PAYX, LEVI
Economic Reports
June PMI services index: 47.9 (actual) vs. 46.7 (estimate)
June ISM non-manufacturing index: 57.1 (actual) vs. 50.1 (estimate)
Happy trading!
Tom