
EB Daily Market Report - Thursday, July 9, 2020
Executive Market Summary
- Futures were slightly higher this morning, with mostly strength in NASDAQ names
- Gold ($GOLD) and commodities ($CRB) are lower, with particular weakness in crude oil ($WTIC, -3.55%)
- The 10 year treasury yield ($TNX) is tumbling, which could provide short-term term for equities
- The U.S. Dollar (UUP) is up today, trying to reverse its recent downtrend, and adding to commodity woes
- Walgreens (WBA) reports quarterly results and is down 8.68%; it was very weak on a relative basis, so I mentioned on my shows not to expect much here
- All 11 sectors are lower, led by energy (XLE), utilities (XLU), and financials (XLF)
- Technology (XLK) is the relative leader on the session with telecom equipment ($DJUSCT) up nearly 1%
Market Outlook
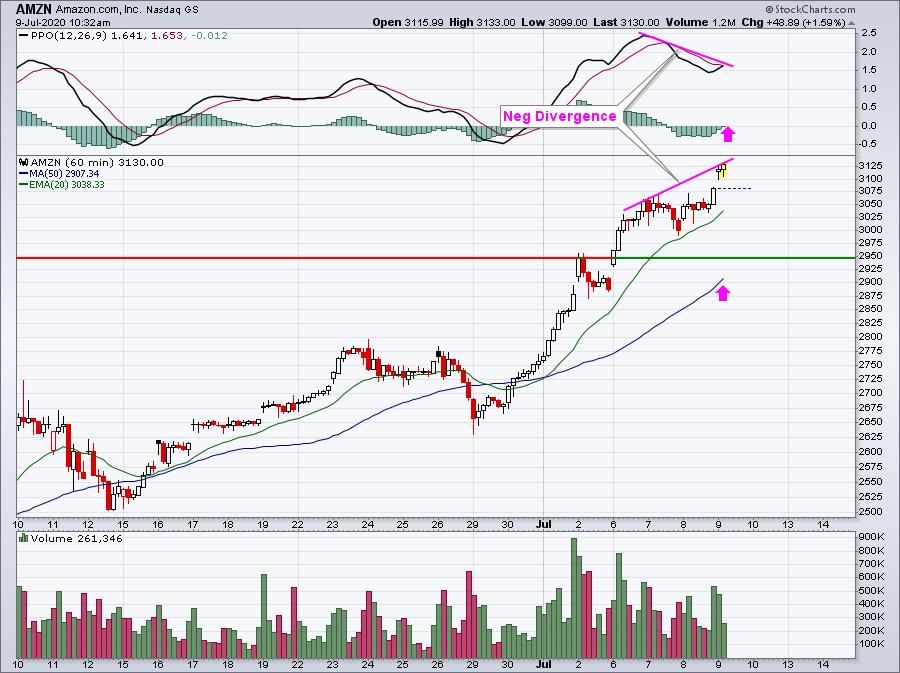
Today's breakout on the NASDAQ 100 ($NDX) is definitely occurring with a negative divergence on its 60 minute chart. Two of the recent leaders, Amazon.com (AMZN) and Netflix (NFLX), are also showing nasty negative divergences. As long as they continue to print higher daily lows, I'd be okay holding on, but beware if they start to turn lower. Here are both 60 minute charts:
AMZN:
NFLX:
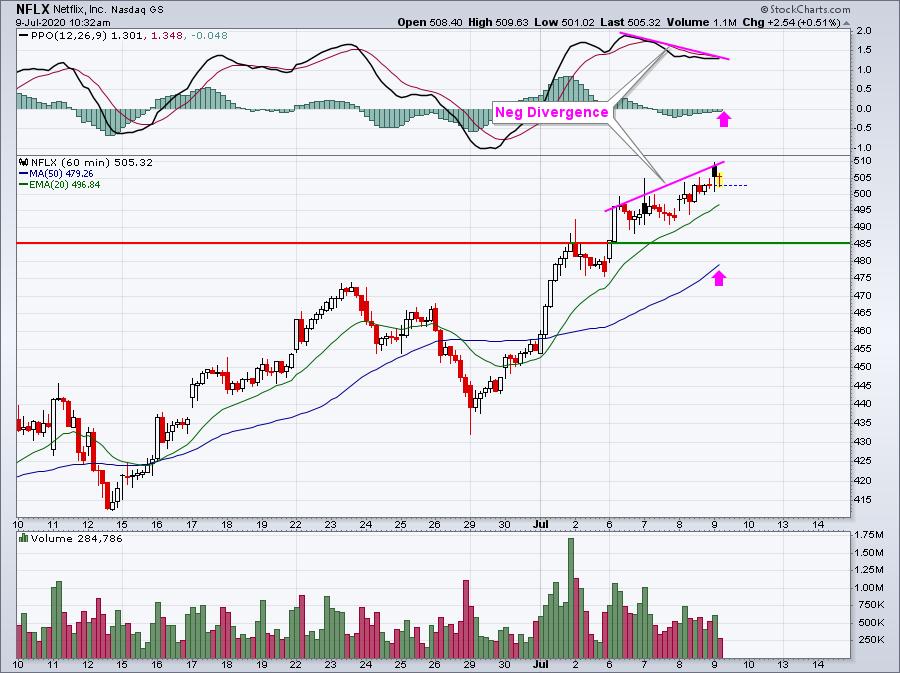
Negative divergences guarantee us absolutely nothing. They do provide us, however, warnings of slowing upside price momentum. It also seems as though volume, while solid, is lessening on each breakout. Long-termers: I wouldn't worry, these are two great companies that I believe will trend higher over the balance of 2020 and beyond. Short-termers: Are you okay holding on during a potential 5-10% decline. I believe a decline of that magnitude is coming, but whether it happens now, next week or next month is anyone's guess. As we move closer and closer to options expiration, that red flag will get brighter and brighter.
Sector/Industry Focus
The same groups are struggling, while the same groups are leading. Because technology (XLK), consumer discretionary (XLY), communication services (XLC), and health care (XLV) remain the best performing sectors, the NASDAQ 100 is the primary beneficiary. The S&P 500 is being held back on a relative basis because of the rest of the market, which doesn't have the same representation in the NASDAQ 100. Check out these sector weightings:
NASDAQ 100 (QQQ):
Technology (XLK): 45%
Communication services (XLC): 20%
Consumer discretionary (XLY): 17%
Health care (XLV): 8%
These four groups total 90% of the QQQ. Now let's check out these same groups on the S&P 500 (SPY):
S&P 500 (SPY):
Technology (XLK): 24%
Communication services (XLC): 11%
Consumer discretionary (XLY): 11%
Health care (XLV): 15%
These four sectors only represent 61% of the SPY (vs. 90% of the QQQ). So if you're wondering why the QQQ:SPY looks like the chart below, this is the reason:
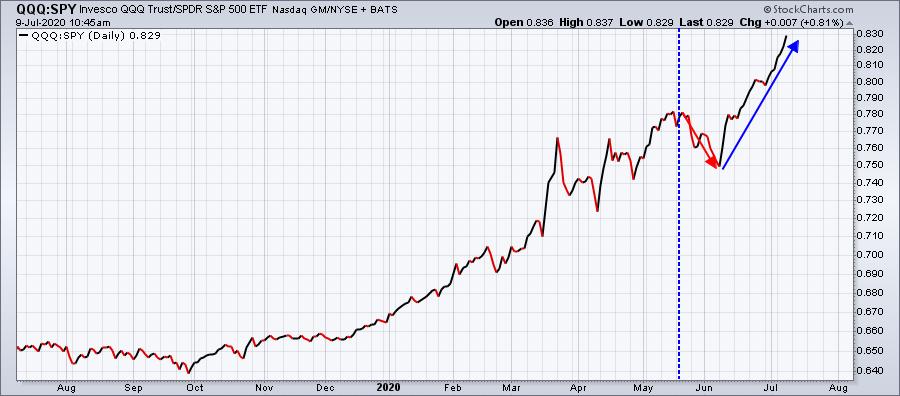
The blue-dotted vertical line represents May 19th, the date in which we selected all of our current portfolio stocks. If you want the reason why our portfolios have done so well, I'd like to say it's because of brilliant stock picking. But it's not. It's simply following the relative strength of the market, selecting leading stocks in leading industries. That concept is why we're seeing the QQQ crush the SPY, and it's also why our portfolios have performed so well. Like the QQQ, we are more concentrated in XLK, XLY, XLC, and XLV stocks. Those are the sectors that remain the leaders. Until that changes, we need to ride the coattails of these leaders.
ChartLists
I looked through our ChartLists quickly this morning, looking to see which stocks appear to breaking out or on the verge. Here are two defensive names that look interesting for a possible trade and should hold up better than the high flyers if we get that 5-10% pullback at some point:
KMB:
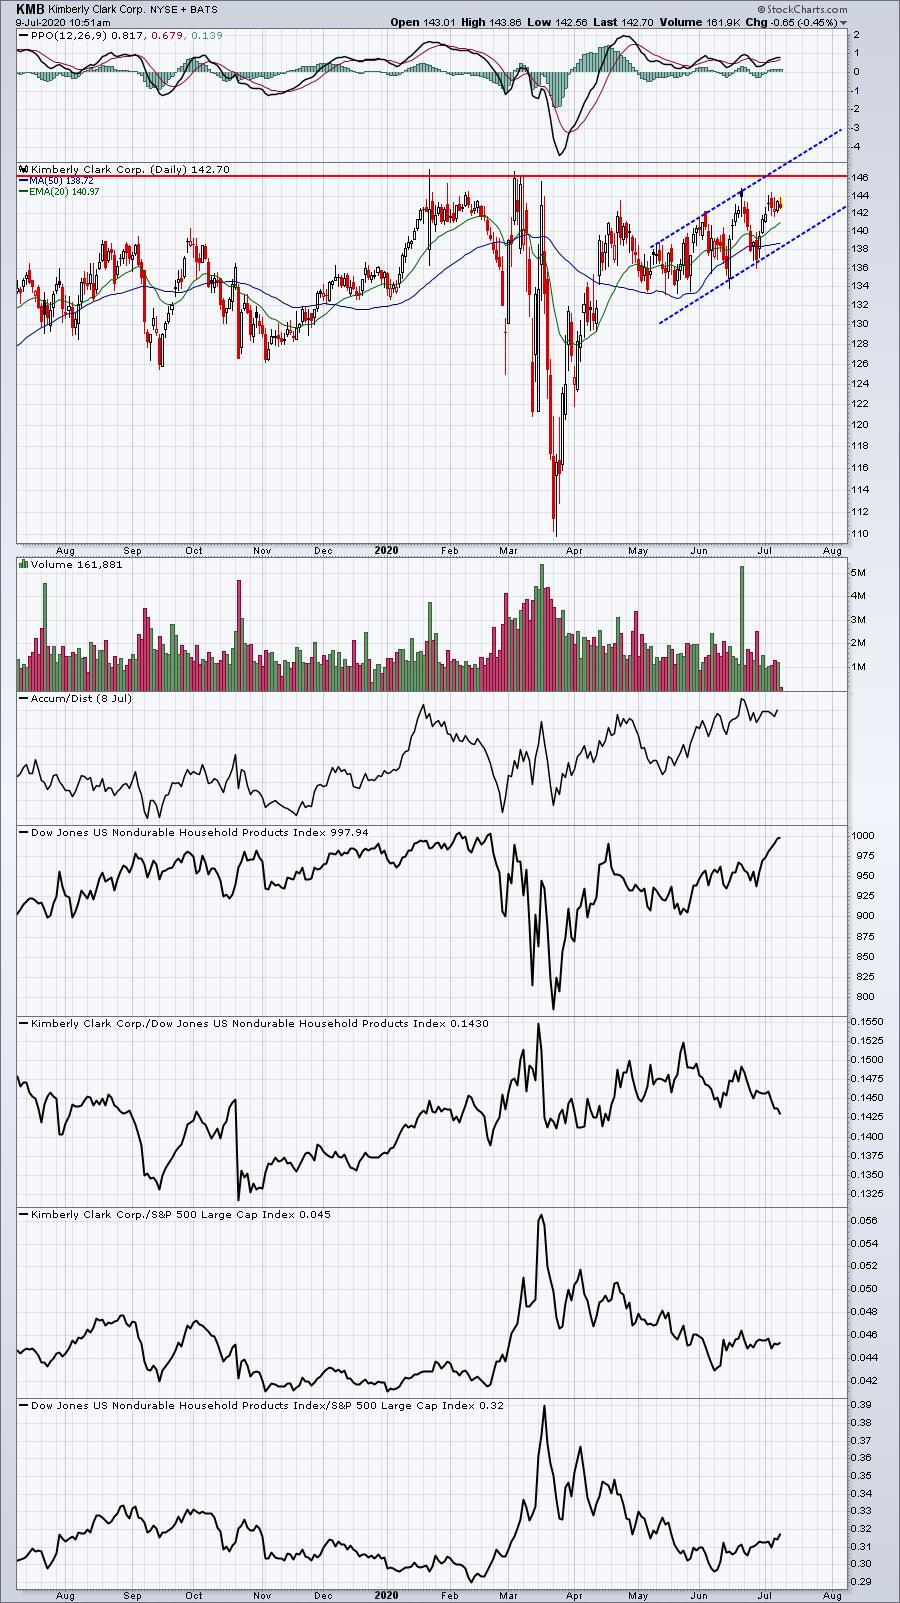
KMB hasn't made the breakout yet, but it's in a nice channel and seems destined to eventually make the breakout. I like this one either on that breakout or on weakness to test lower channel support.
DGX:
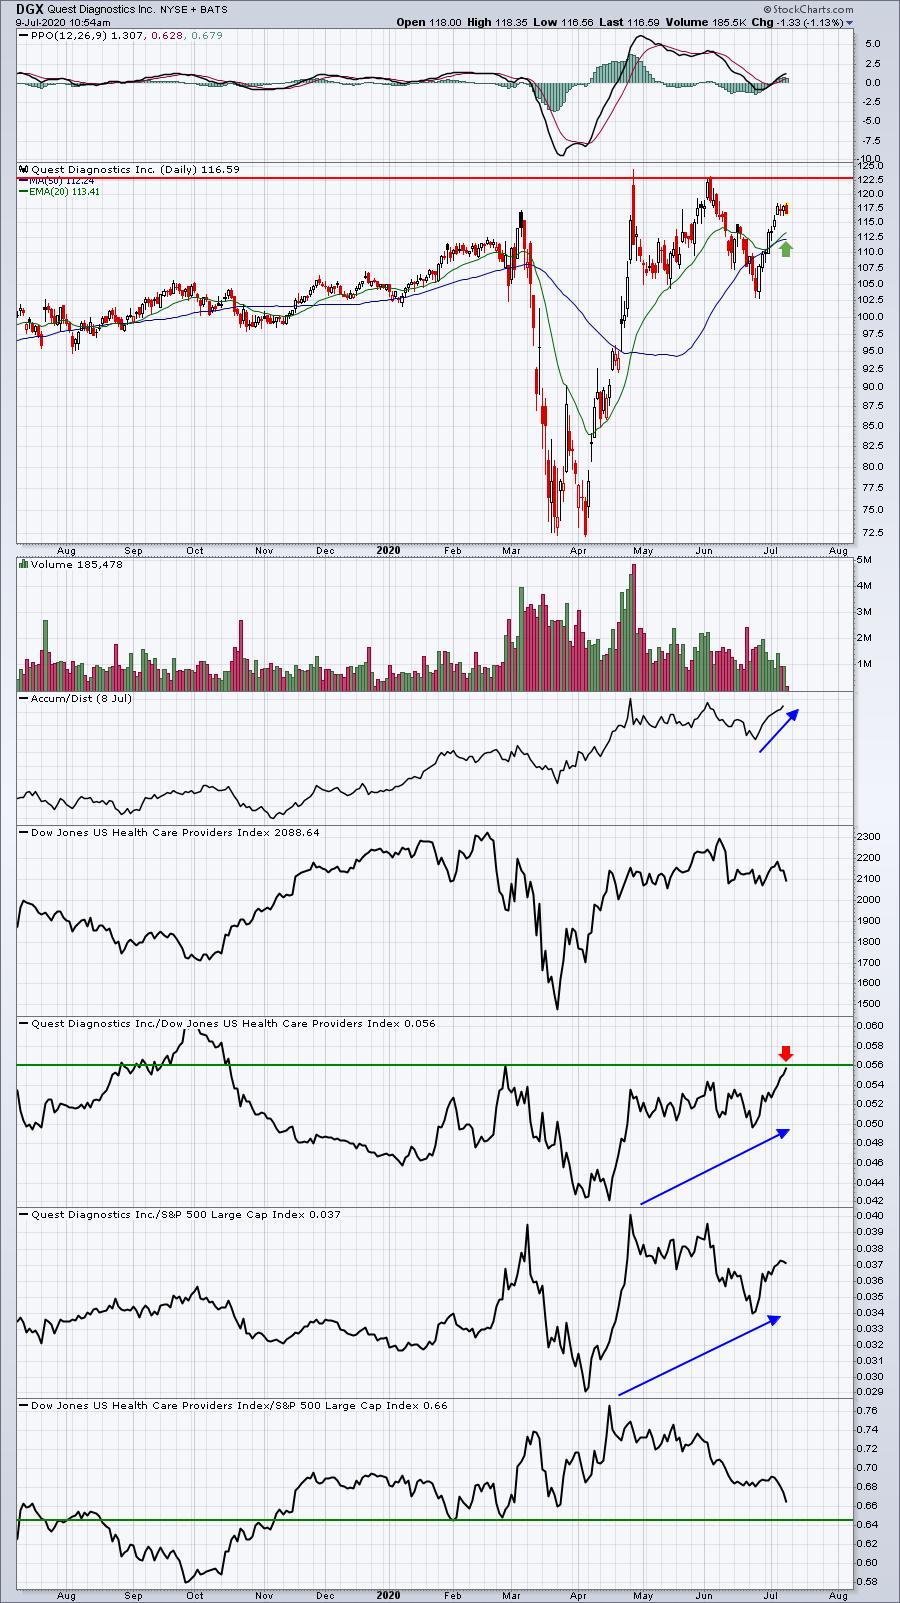
I like DGX coming off that PPO centerline support test and turning higher. With the health care providers ($DJUSHP) nearing relative support vs. the S&P 500 and DGX nearing relative resistance vs. its peers, this could be the perfect storm. I'd prefer to catch DGX either on a breakout or on a rising 20 day EMA test.
Earnings Reports
Here are the key earnings reports for today and tomorrow, featuring stocks with market caps of more than $10 billion. I also include a few select companies with market caps below $10 billion. Finally, any portfolio stocks (or active trade alerts) that will be reporting results are highlighted in BOLD. If you decide to hold a stock into earnings, please understand the significant short-term risk that you are taking. Please be sure to check for earnings dates for any companies you own or are considering owning:
Thursday, July 9:
WBA, HELE, WDFC
Friday, July 10:
INFY, SJR
Economic Reports
Initial jobless claims: 1,314,000 (actual) vs. 1,375,000 (estimate)
May wholesale inventories: -1.2% (actual) vs. -1.2% (estimate)
Happy trading!
Tom