
EB Daily Market Report - Friday, July 10, 2020
Executive Market Summary
- Futures were slightly lower at the open and after early morning selling, the bulls are back at it today
- Strength, however, has returned on a relative basis to the Dow Jones and S&P 500
- Small caps ($SML) are actually the best performing among our major indices, up nearly 2%
- Airlines ($DJUSAR), cruise lines, and oil & gas names are littering the S&P 500's top performer list
- Netflix (NFLX) is surging as well, up more than 9% on the session
- Tesla (TSLA) hits another record high and is nearing $1500
- Financials (XLF), energy (XLE), and utilities (XLU) are leading an upside down leaderboard where recent relative laggards have turned the tables
- Crude oil ($WTIC) has jumped 2.42% to $40.58 per barrel
- Asian markets were lower overnight, while European markets rallied today
- Positive COVID-19 news from Gilead Sciences seems to be spurring the return of investors into stocks that have struggled the most during the virus outbreak
Market Outlook
I don't like being a Debbie Downer, but there are warning signs building as we approach one of the most interesting earnings seasons in our history. The biggest short-term threat to this rally is sentiment. The 5 day moving average of the equity put/call ratio ($CPCE) closed below 45 yesterday for only the second time in the past 3 years. The other time was in June, just before the NASDAQ 100 ($NDX) dropped 7% in 2 trading sessions. I'm bullish so it's hard for me to build cash just before some huge earnings reports are likely to be released, but at a minimum, we should all at least recognize with every push higher, the risk of a significant short-term period of selling grows. The following chart shows that CPCE 5 day moving average and the 5 day moving average of the Volatility Index - CBOE NASDAQ 100 ($VXN), along with the NDX chart:
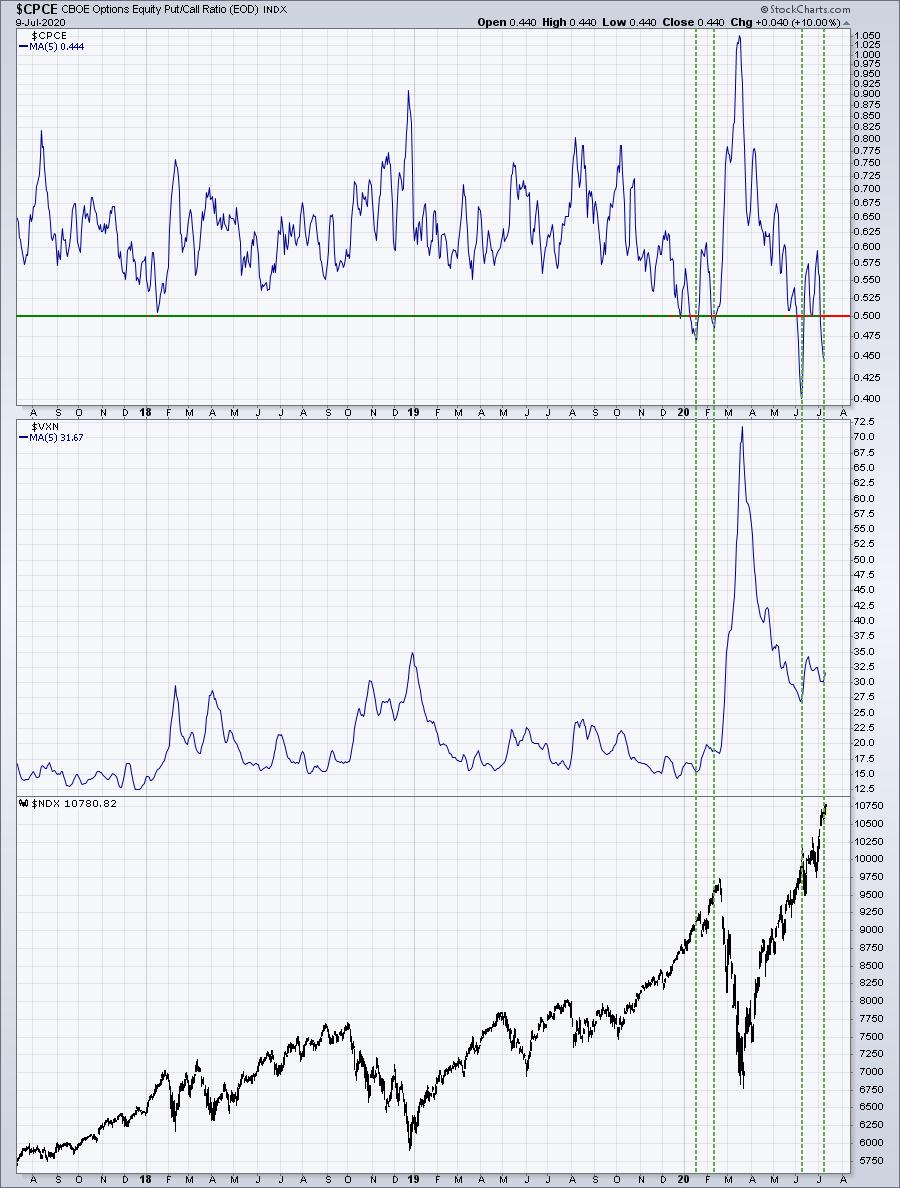
This chart tells me 3 things:
(1) The move in the 5 day moving average of the CPCE below .50 has been a fairly strong warning sign recently
(2) At each one of those levels, the 5 day moving average of the VXN has been higher, indicative of rising fear
(3) Call buyers are willing to pay extraordinarily high call premiums, chasing stocks that are already wildly overbought in the near-term
This usually doesn't end well. Make no mistake, I remain very bullish. I'm just issuing extreme short-term caution.
Sector/Industry Focus
Beaten down sectors are leading the charge today, and maybe that will mark a short-term shift in that regard. Financials (XLF) are having a superb day as the 10 year treasury yield ($TNX) reverses off of a gap down to 0.58% at today's open. Banks ($DJUSBK) are a primary beneficiary:
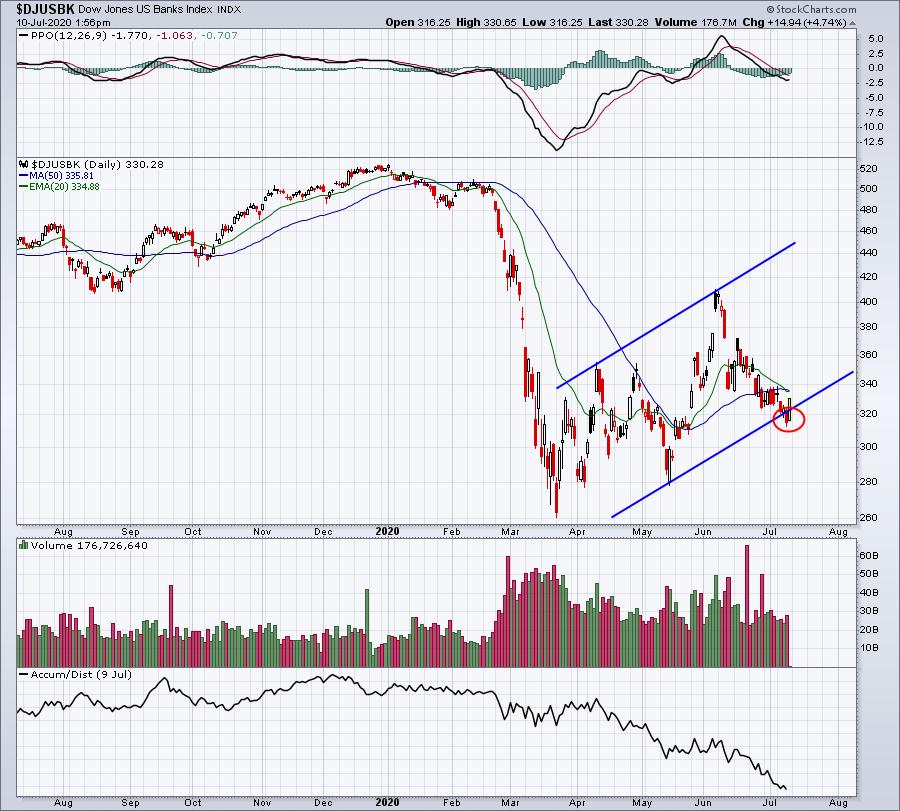
Be careful if we reverse late in the day. But for now, it appears that banks may have reached a short-term bottom. Consider using 312 as a closing stop if you decide to trade any banks.
ChartLists
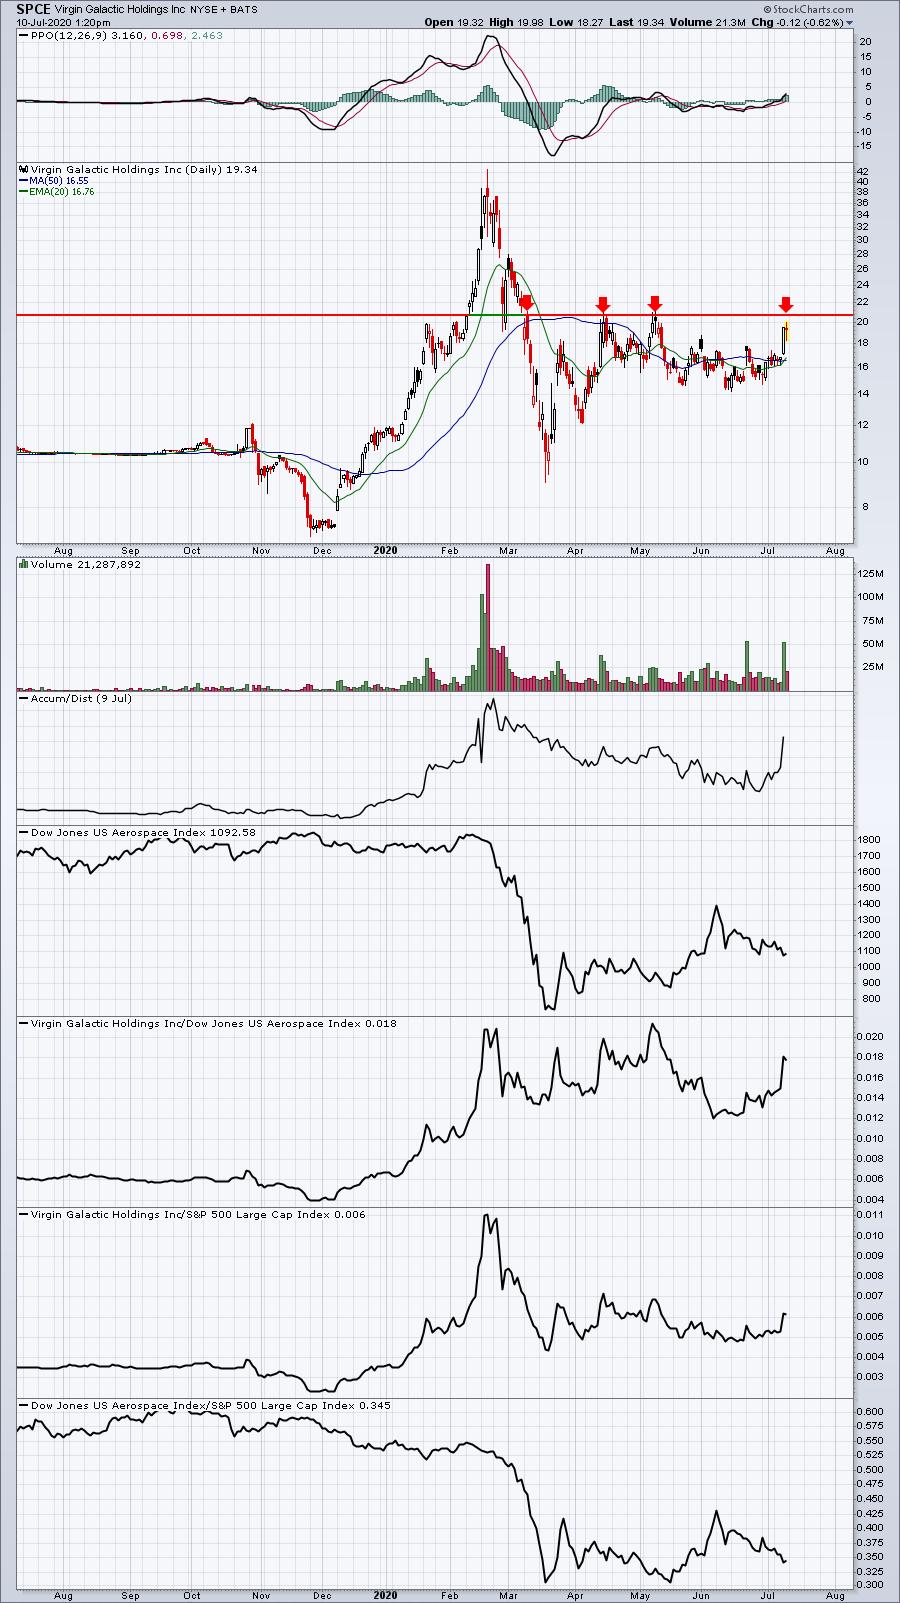
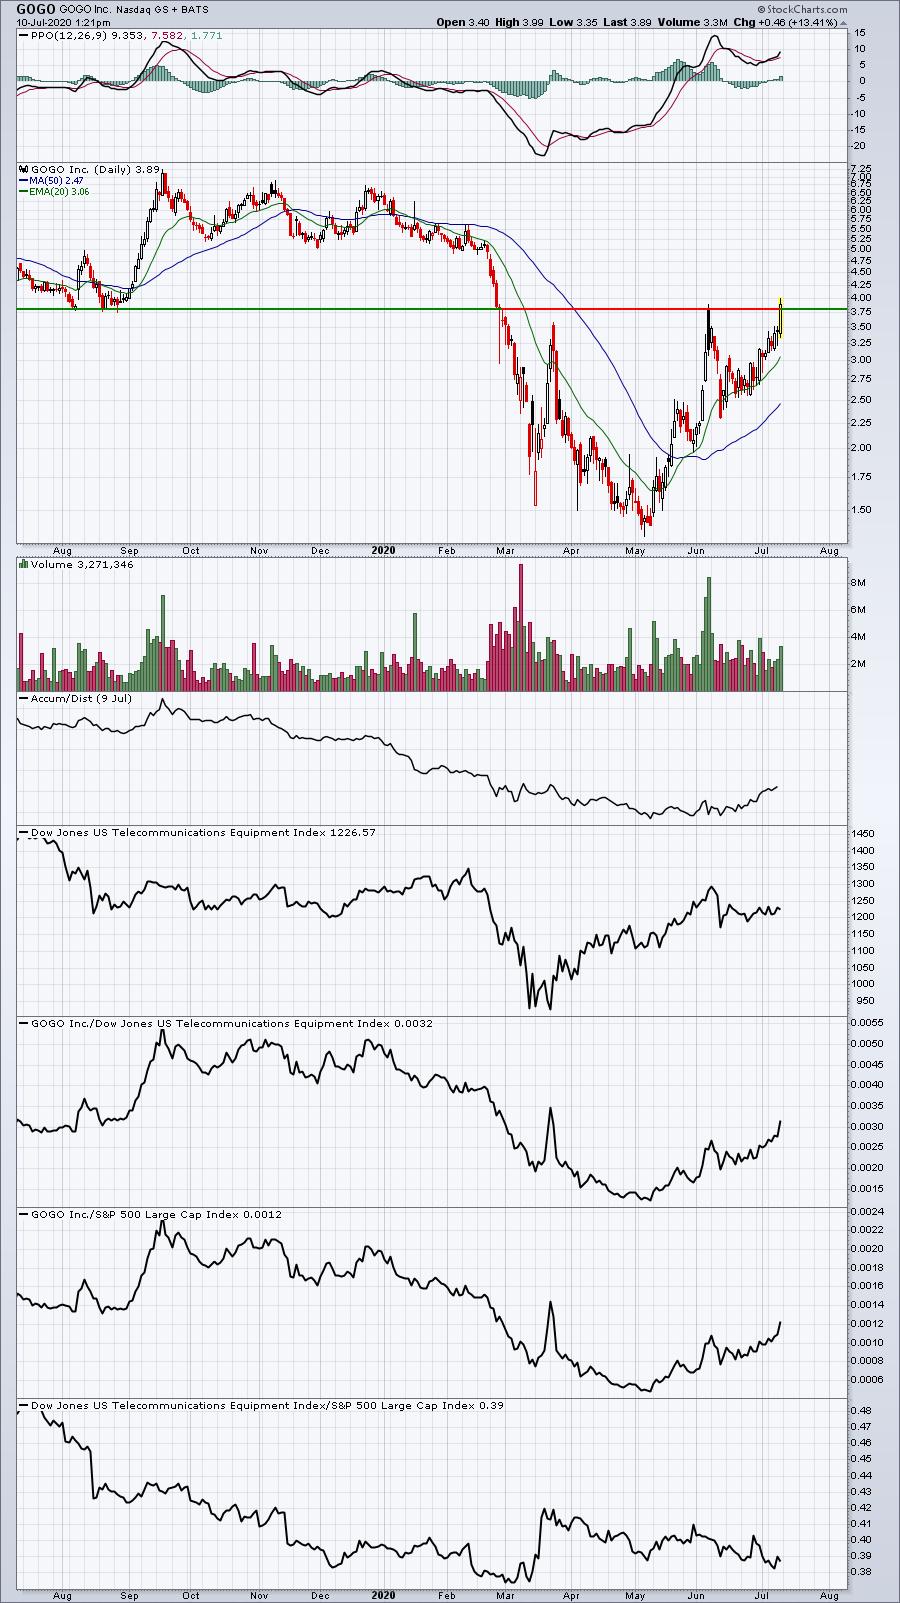
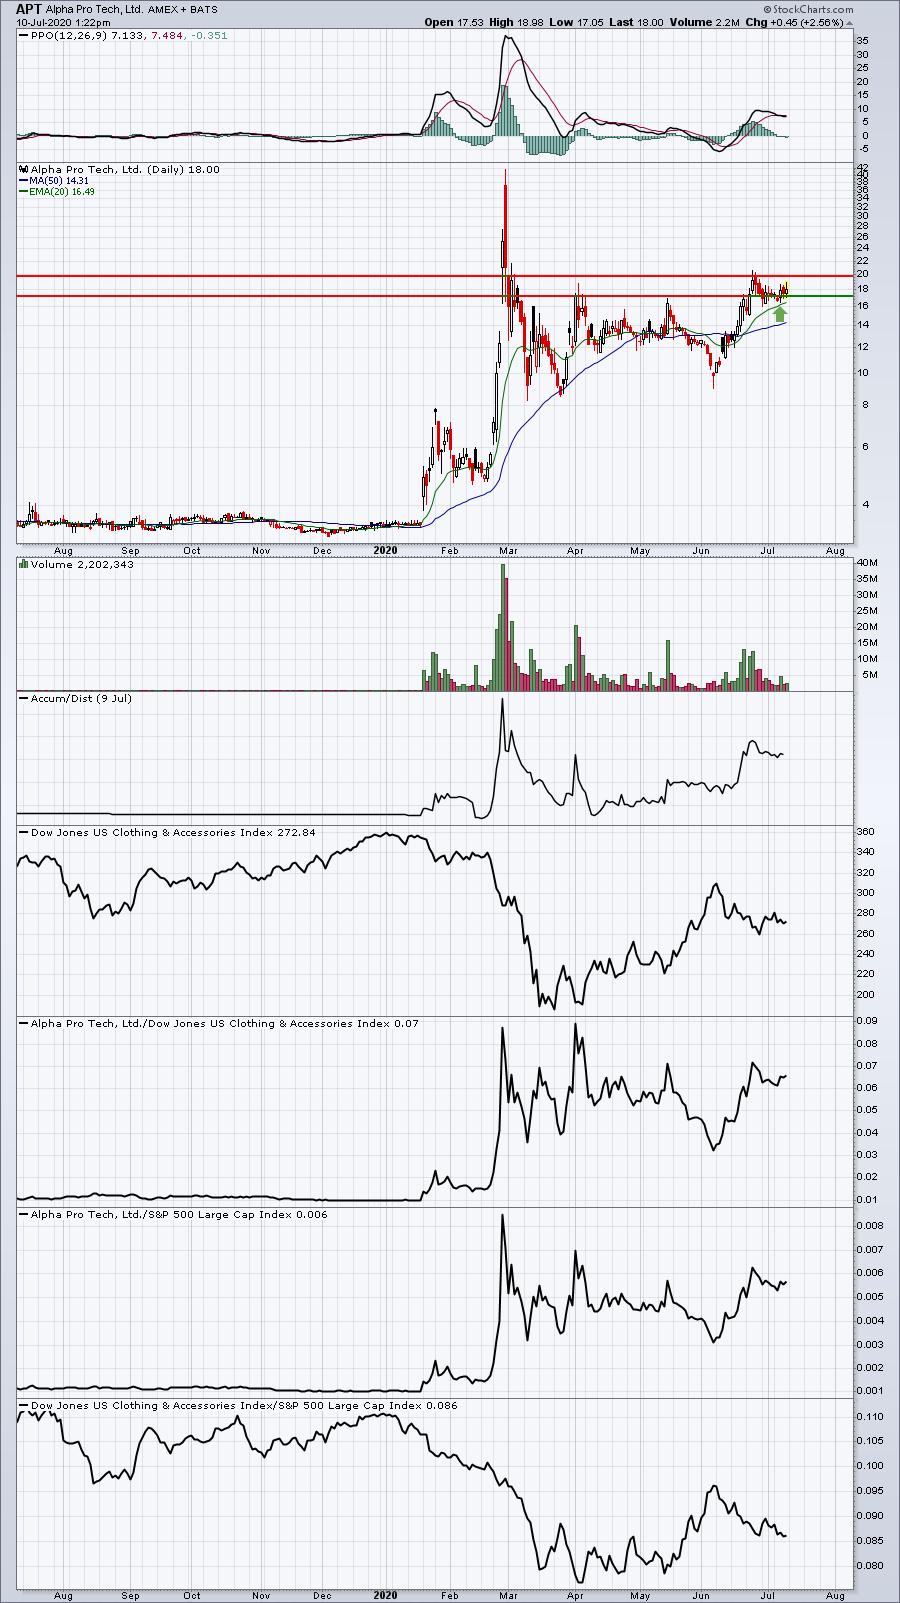
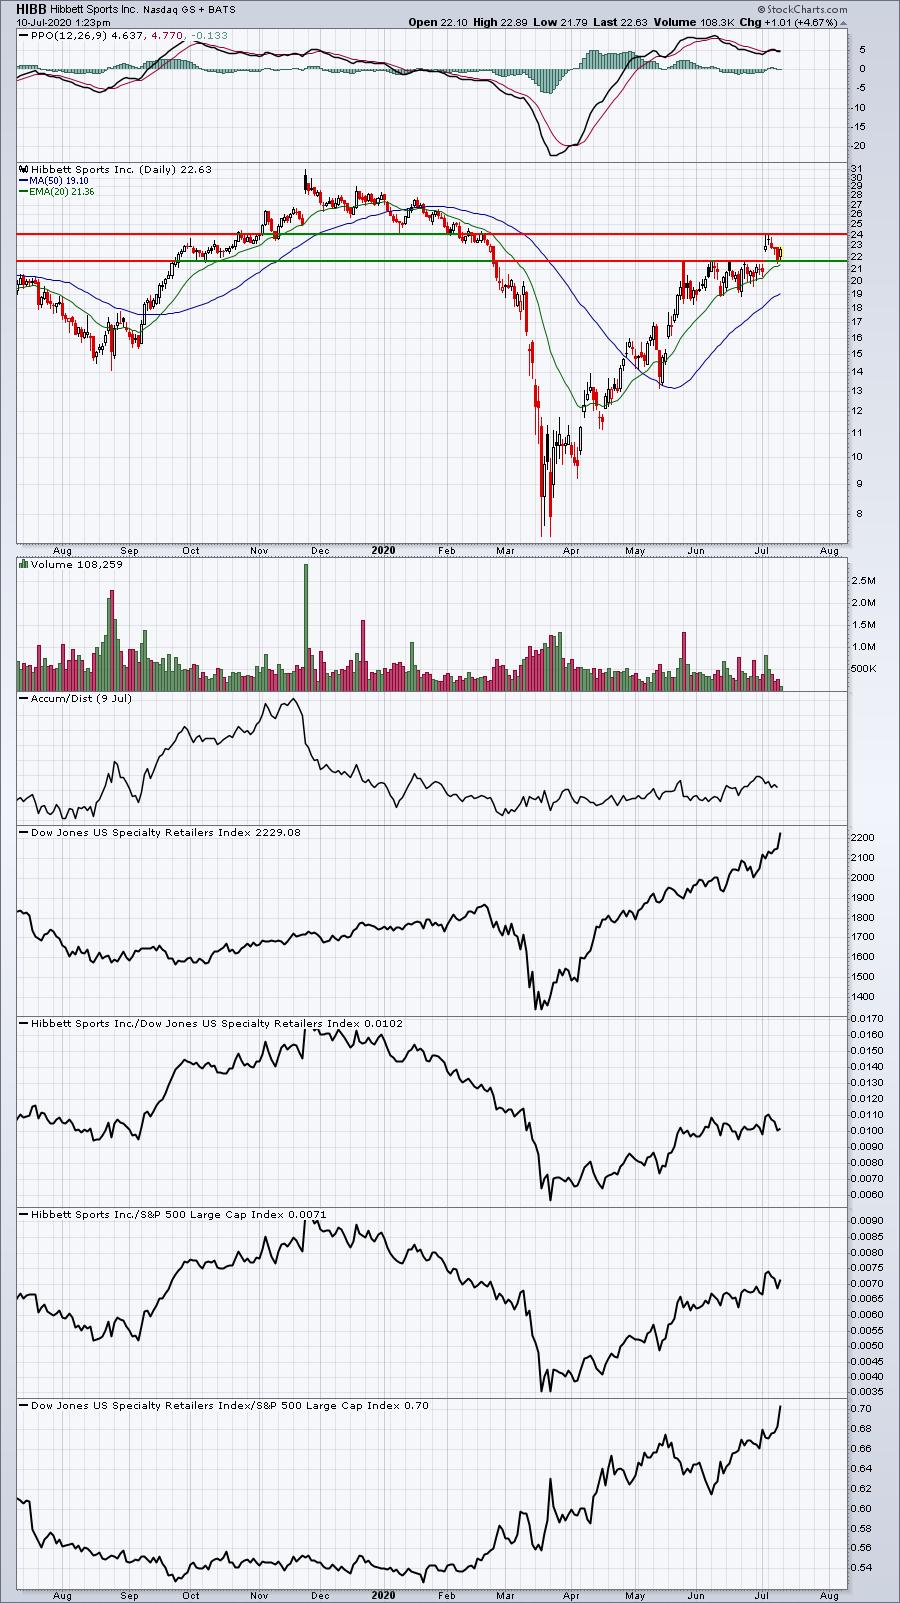
I reviewed the Short Squeeze ChartList (SSCL) and I'd be interested if any of the following stocks are able to clear price resistance with increasing volume:
SPCE:
GOGO:
APT:
HIBB:
AAOI:
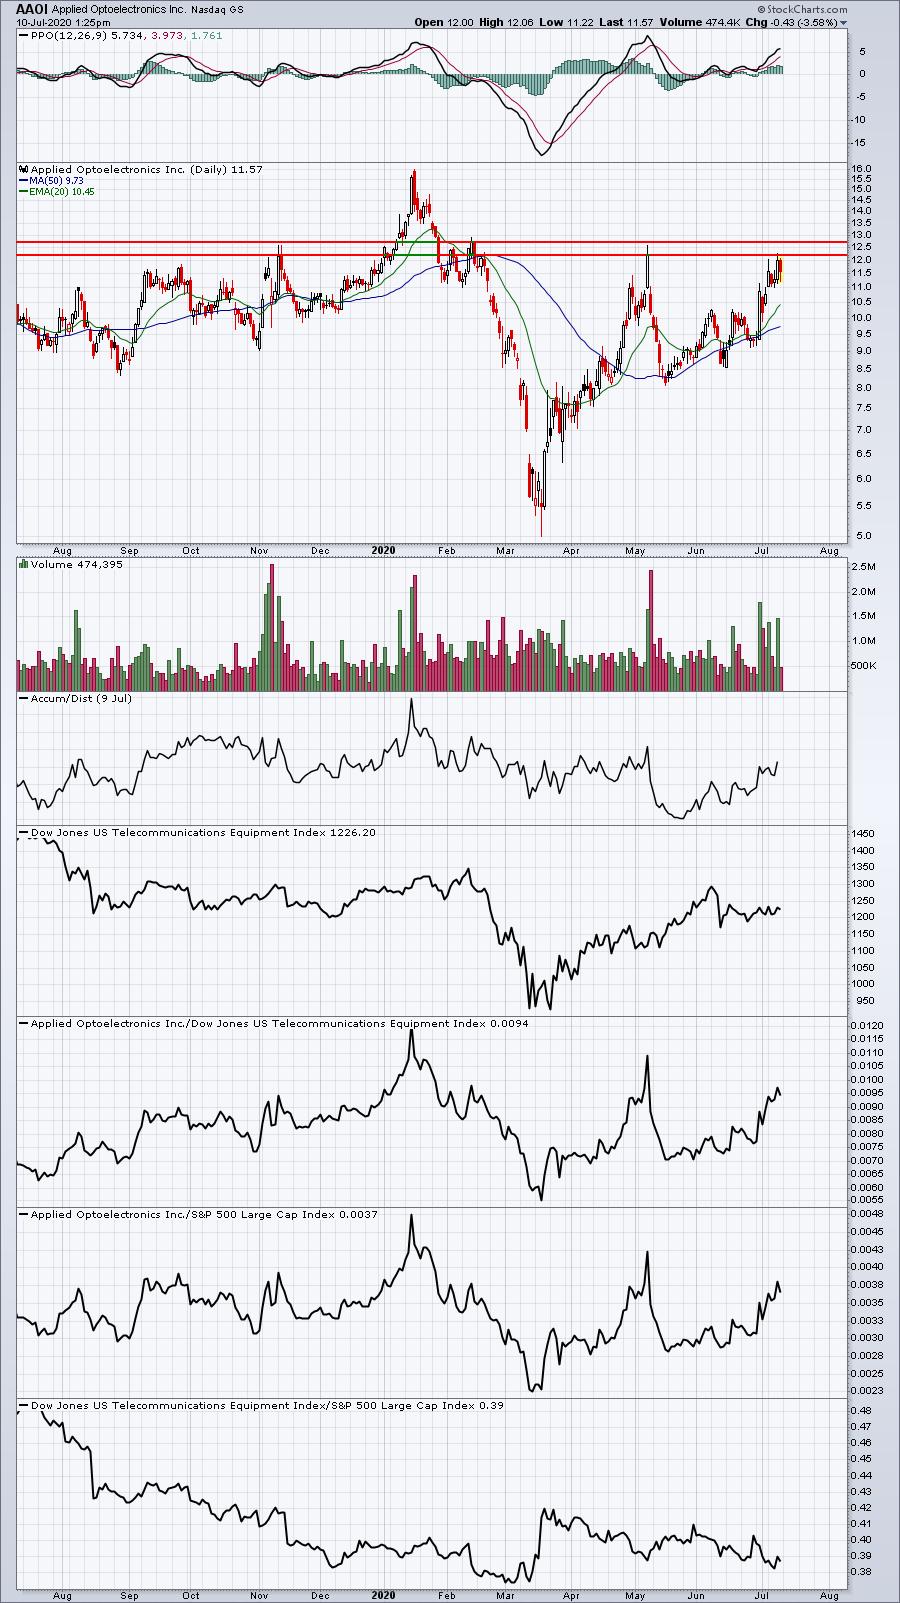
Stocks on the SSCL typically are not strong technically and, many times, there's a very good reason they're being heavily shorted. So we're only looking for stocks if they're showing bullish characteristics - uptrends, high volume breakouts, improving relative strength, etc. The above charts are definitely showing most of these characteristics, but perhaps missing that definitive breakout that triggers significant short covering.
Earnings Reports
Here are the key earnings reports for today and tomorrow, featuring stocks with market caps of more than $10 billion. I also include a few select companies with market caps below $10 billion. Finally, any portfolio stocks (or active trade alerts) that will be reporting results are highlighted in BOLD. If you decide to hold a stock into earnings, please understand the significant short-term risk that you are taking. Please be sure to check for earnings dates for any companies you own or are considering owning:
Friday, July 10:
SJR
Monday, July 13:
PEP
Economic Reports
June PPI: -0.2% (actual) vs. +0.4% (estimate)
June Core PPI: -0.3% (actual) vs. +0.1% (estimate)
Happy trading!
Tom