
EB Daily Market Report - Tuesday, July 14, 2020
Today's Event
We will be hosting our "Max Pain" event later this afternoon at 4:30pm ET. This is a regular monthly webinar that we host three days before monthly options expire (monthly options always expire the 3rd Friday of the month). This event clearly has more meaning to short-term traders than to long-term investors as it simply represents one of the many reasons why the stock market's short-term can be extremely inefficient. As traders, we look to take advantage of that - or at least be aware of it. I hope you can join me. Here's the link to join (the room should be open by 4:00pm ET):
https://us02web.zoom.us/j/81761562720
A recording will be available to all of you that are unable to make the live event.
Executive Market Summary
- Futures were lower across the board, but the Dow Jones has established leadership throughout the session
- Earnings are moving to center stage as several large banks kicked off the season
- JP Morgan (JPM) and Citigroup (C) both beat revenue and EPS estimates; meanwhile, Wells Fargo (WFC) disappointed
- Banks ($DJUSBK, -1.80%) have failed to sustain their recent rally, despite mostly positive results
- Financials (XLF), partly due to bank woes, is the only sector in negative territory today
- Energy (XLE, +2.52%) and materials (XLB, +1.55%) are the two leaders, buoyed by a weaker dollar (UUP)
- Renewable energy ($DWCREE, +4.51%) is having a very strong day
- Most commodities are close to their flat lines
- One negative today is the 10 year treasury yield ($TNX), which has dropped 3 basis points to 0.61%, also a negative today for banks and financials
Market Outlook
If the very near-term, we need to be careful with the NASDAQ 1o0 ($NDX). We saw tremendous underperformance on Monday and it's occurring again today. The NDX has moved below PPO centerline support and its 20 hour EMA on its 60 minute chart and needs to regain both in order to reverse its current short-term downtrend. The initial support level to watch is around 10300:
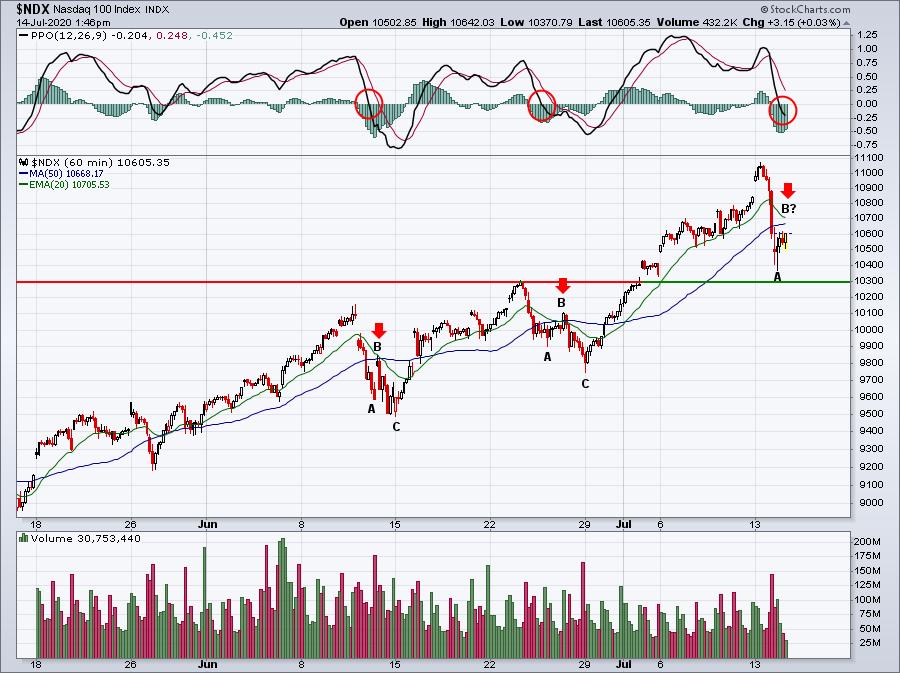
This appears to be a potential short-term A-B-C correction. We've seen this play out a couple other times during this uptrend, but we'll need more information to see if the bulls can contain the selling before we break below 10300.
The daily chart would also confirm this 10300 level as key short-term support. Check this out:
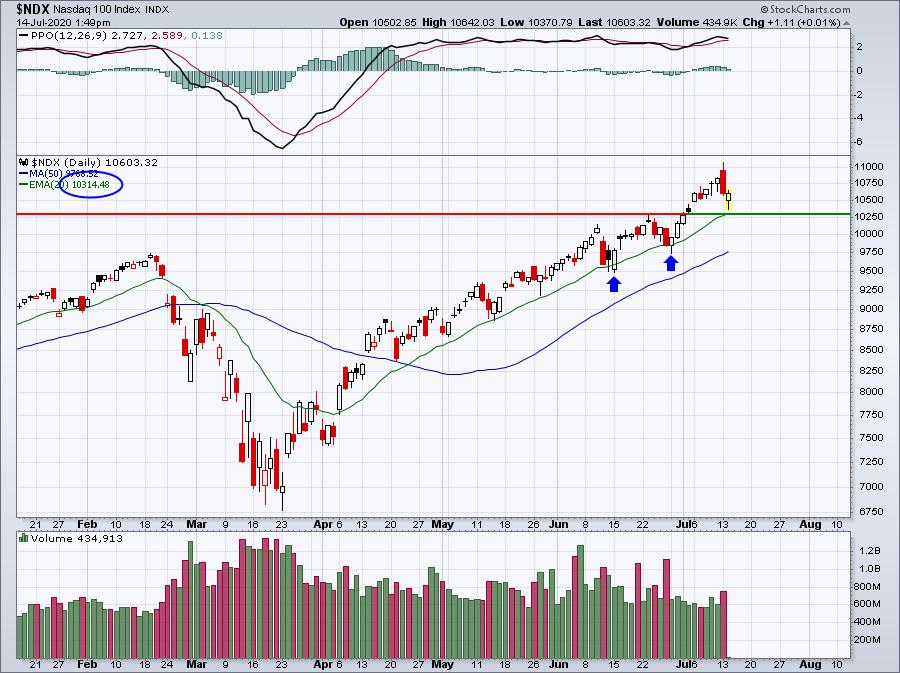
The blue arrows on this daily chart mark 20 day EMA tests and coincide with the June 15th and June 29th A-B-C corrections reflected on the 60 minute chart earlier. Currently, the 20 day EMA is at 10313, which may again coincide with the "C" in an A-B-C correction on the 60 minute chart. If 10300 is violated and we close below it, that would open up the potential for much more short-term selling, so let's watch this level carefully as earnings are released.
Sector/Industry Focus
Home construction ($DJUSHB) and home improvements ($DJUSHI) are the two leading industry groups today within consumer discretionary (XLY). While the DJUSHB is approaching a key breakout level, the DJUSHI is above it on an intraday basis. We need to see this confirm on today's close:
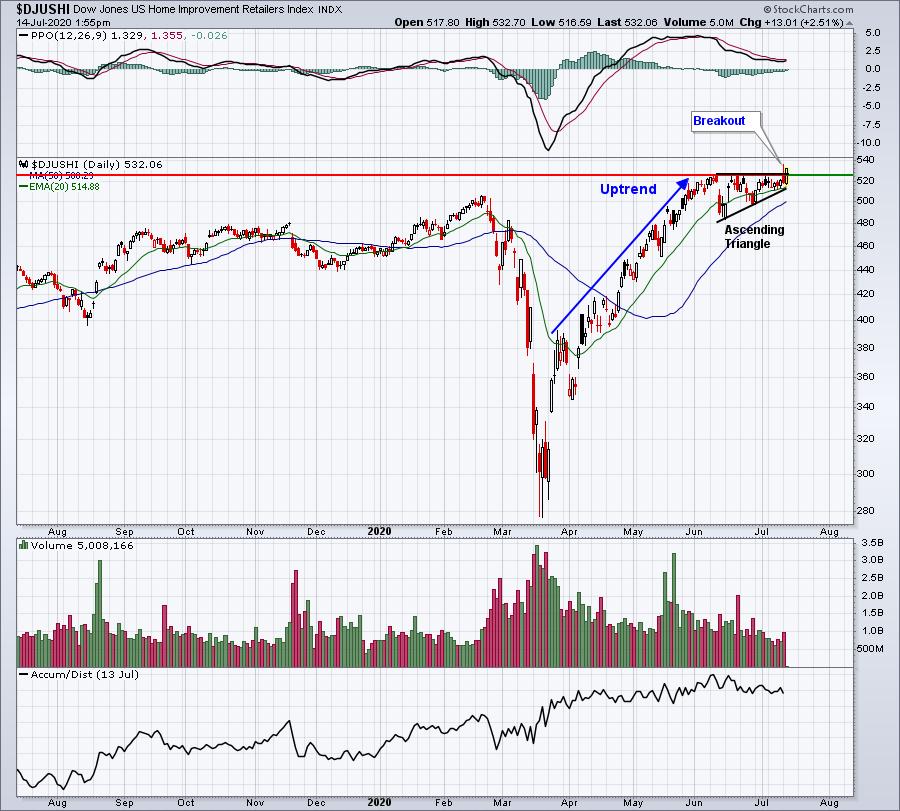
The measurement of this ascending triangle breakout would be roughly 20 points, or 4% higher. We saw a failure at this level on Monday, so the last thing we want to see is another failure today. If that occurs, we could be setting a short-term top. I believe, however, that this group is breaking out today.
ChartLists
ChartList Updated: The Strong Earnings ChartList (SECL) has been updated and the new list is available on our website. Go to "ChartLists" under the "Member" section and follow the instructions to download this updated ChartList into your StockCharts.com account (if you're an Extra member or above there). If you're not an Extra member or above, you can still view the charts on the ChartList by scrolling one at a time, but you cannot save them, scan them, or otherwise work interactively with them. If you're not a member at all at StockCharts.com, I'd recommend trying their service by taking advantage of their 30-day free trial. Combining your EarningsBeats.com membership with a StockCharts.com membership will truly provide you the best experience as an EarningsBeats.com member. We receive no compensation whatsoever from StockCharts.com for any subscriptions there by our members.
I'm once again showing the relative performance of our various ChartLists. I believe it's very important from a trading perspective to be aware which areas of the market are favored. Currently, the weak pandemic stocks that are on our Weak AD ChartList are showing a slight advantage for the third straight day. I'm not a fan of buying and holding these, but short-term trades are fine when rotation favors them. Here's today's relative performance broken down by performance category:
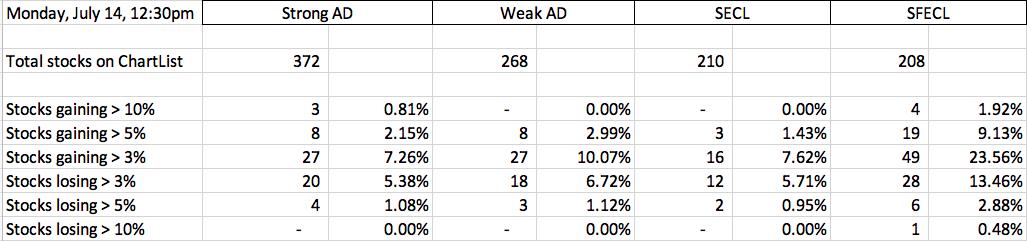
The Strong Future Earnings ChartList (SFECL) is actually performing best, but that ChartList will be undergoing an update very soon. My intention is to update this ChartList any time a significant update is made to the Strong Earnings ChartList (SECL). The reason is that as companies are removed from the SECL, they immediately qualify for the SFECL. The idea is to have ZERO stocks that are on both ChartLists simultaneously. The SFECL should represent the leading stocks (SCTRs above 80) from the leading industry groups (certain criteria must be met using the Industry Group Relative Strength ChartList) that DO NOT CURRENTLY RESIDE on the SECL.
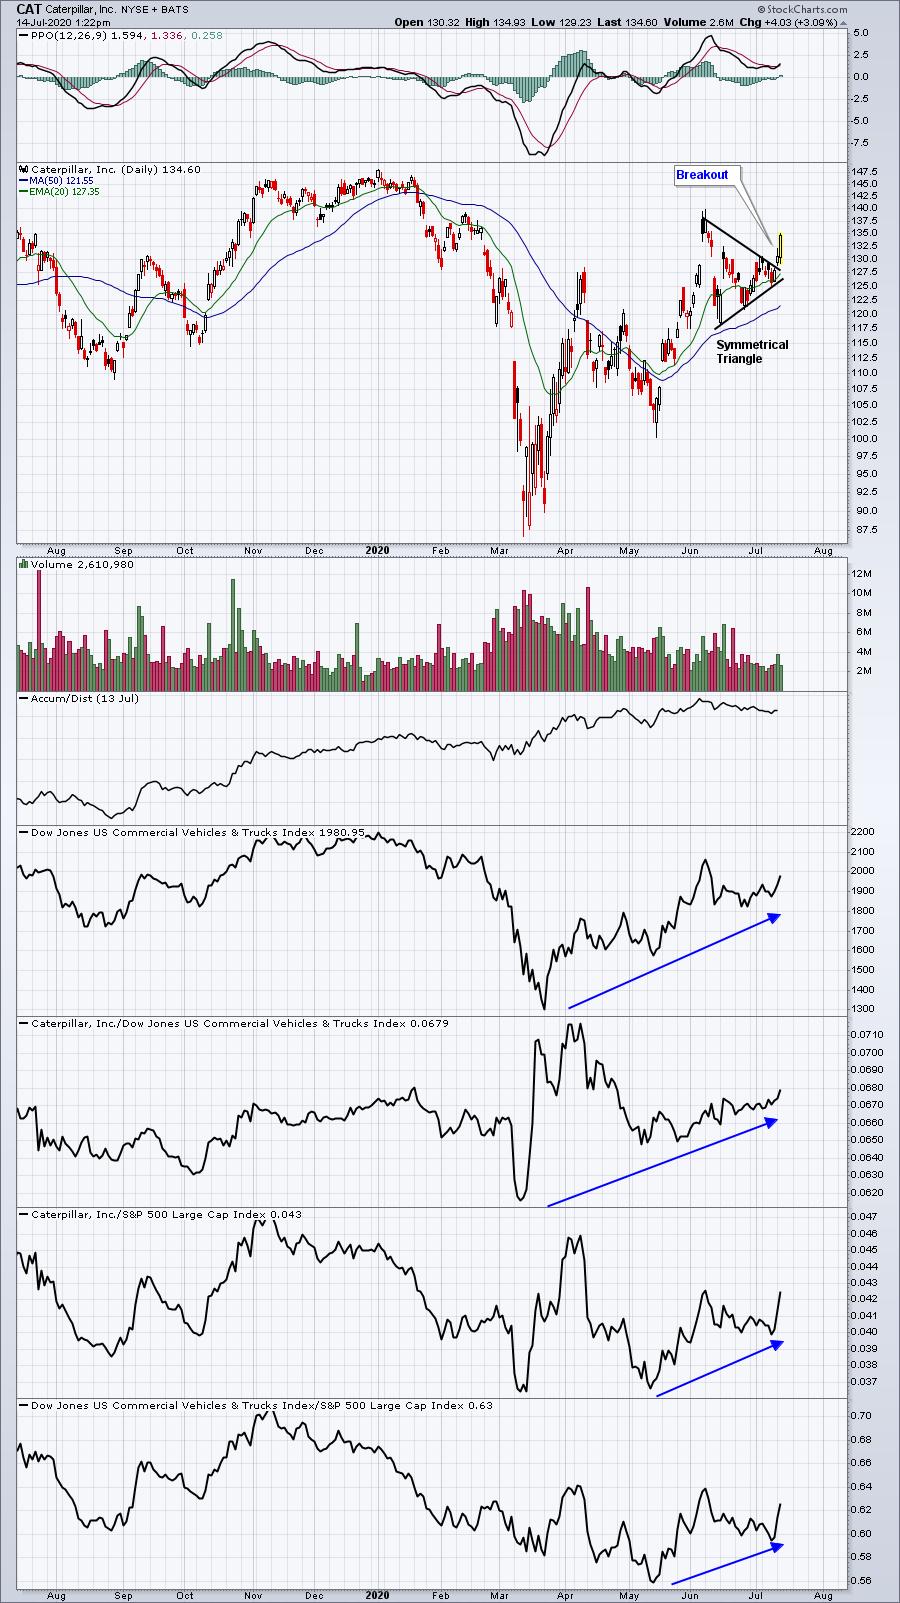
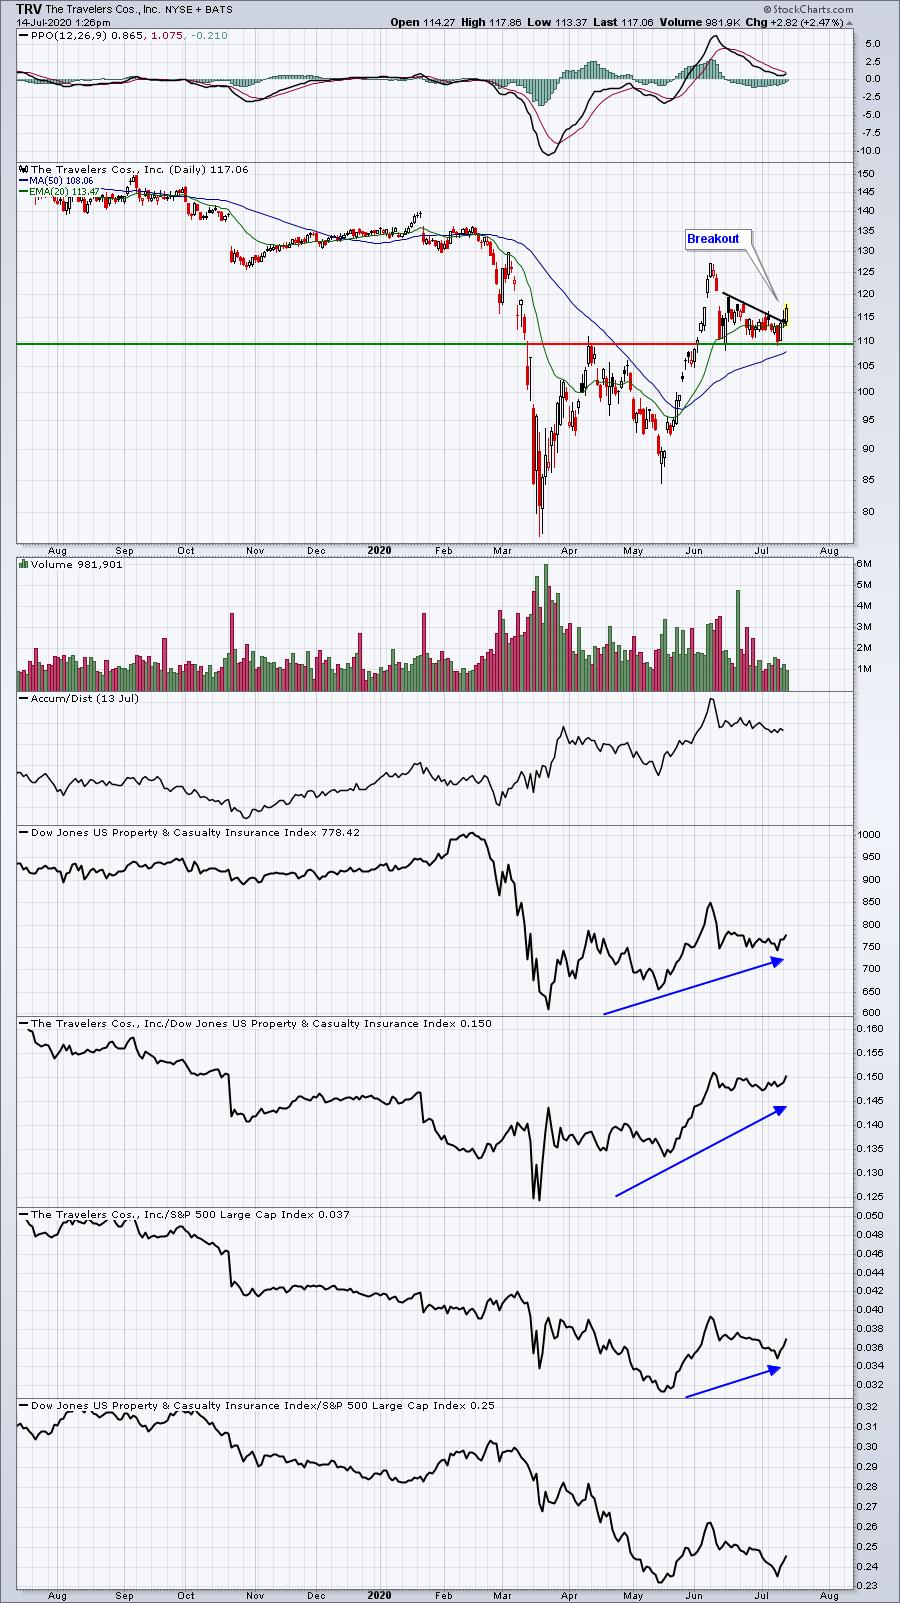
The Dow Jones is outperforming today, so I thought I'd provide a couple Dow charts that I believe look much more bullish today than a week ago:
CAT:
TRV:
UNH:
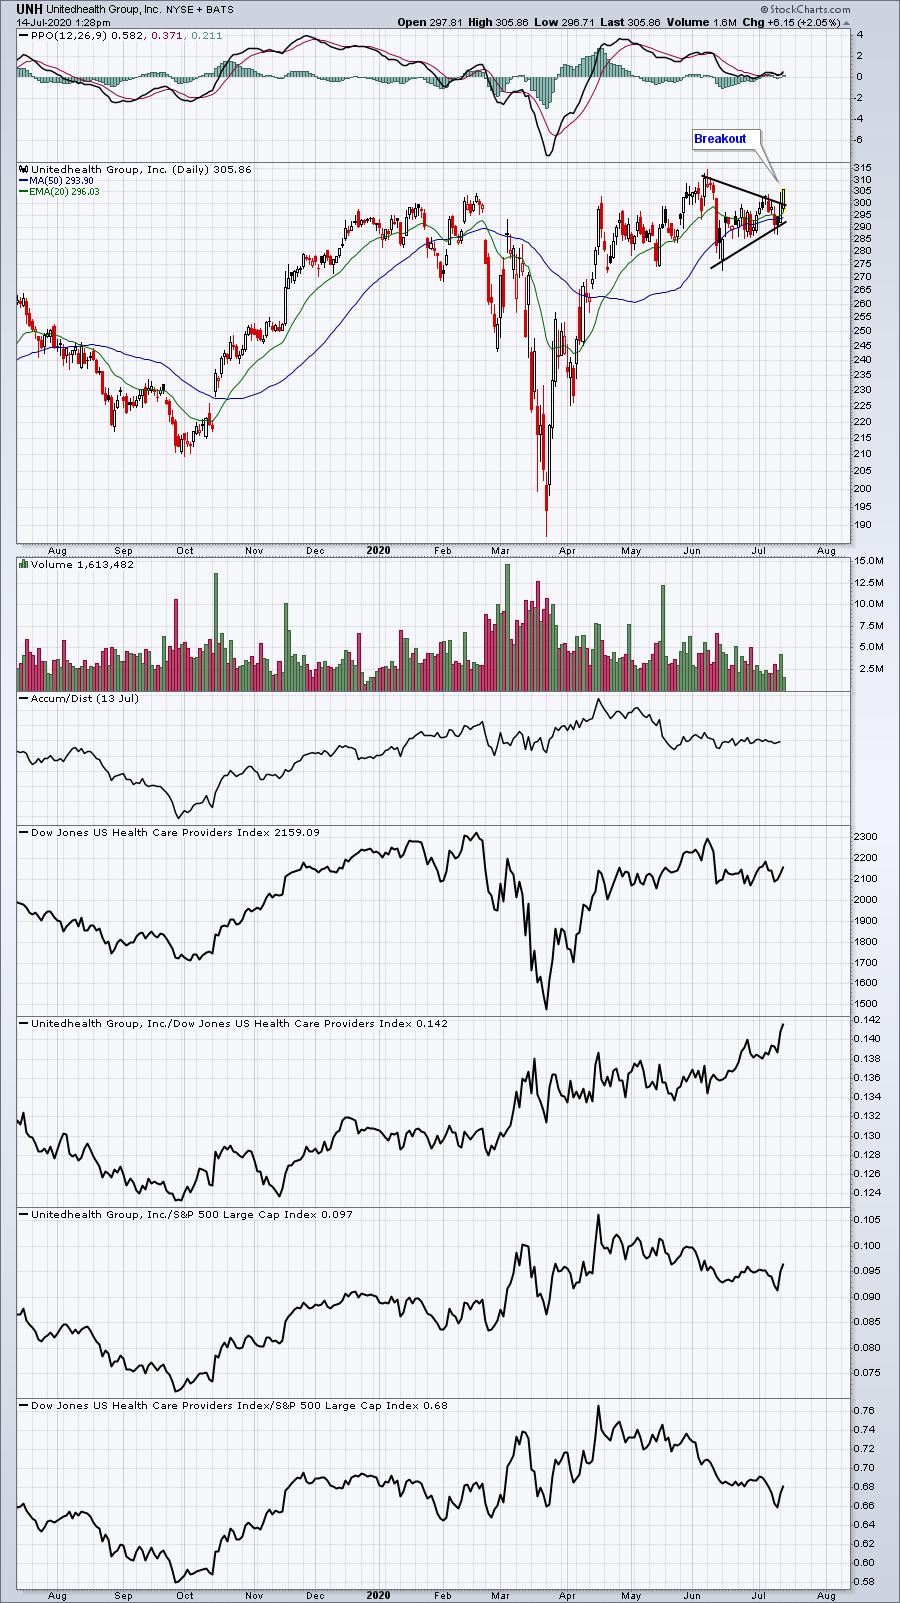
All 3 of these Dow stocks has turned more bullish. Not only are we seeing breakouts on all 3 stocks, but volume is increasing (especially with CAT), which, in my opinion, adds to the bullish case and suggests institutional accumulation.
Earnings Reports
Here are the key earnings reports for today and tomorrow, featuring stocks with market caps of more than $10 billion. I also include a few select companies with market caps below $10 billion. Finally, any portfolio stocks (or active trade alerts) that will be reporting results are highlighted in BOLD. If you decide to hold a stock into earnings, please understand the significant short-term risk that you are taking. Please be sure to check for earnings dates for any companies you own or are considering owning:
Tuesday, July 14:
JPM, C, WFC, FAST, FRC, DAL
Wednesday, July 15:
UNH, ASML, GS, USB, PGR, INFY, PNC, BK, AA, SNBR
Economic Reports
June CPI: +0.6% (actual) vs. +0.5% (estimate)
June Core CPI: +0.2% (actual) vs. +0.1% (estimate)
Happy trading!
Tom