
EB Daily Market Report - Wednesday, July 15, 2020
ChartLists Updated
We have updated two of our ChartLists. First, we updated the Strong Future Earnings ChartList (SFECL). This ChartList includes stocks that have SCTR scores above 80 and belong to the best performing industry groups (per our Industry Group Relative Strength ChartList) and are not included on the Strong Earnings ChartList (SECL). Next, we've added a ChartList for the Q2 Earnings - Sneak Preview webinar that we held on Monday evening. Both of these ChartLists can be downloaded into your StockCharts.com account (if you're an Extra member or above) by following the instructions on our website. Once logged in, our "ChartLists" can be found under "Members" in the left navigational panel.
Executive Market Summary
- Futures were higher today, with traders preferring both the Dow Jones and S&P 500 over the NASDAQ 100
- At last check, significant relative strength was being shown among small cap ($SML) and mid cap ($MID) stocks
- Commodity prices rose today as crude oil ($WTIC) jumped 2% to above $41 per barrel
- It's been a volatile day for treasuries; the 10 year treasury yield ($TNX) surged at the open, fell back near the flat level, and is now back up 2 basis points to 0.63%
- The S&P 500 is threatening a breakout above its June 8th close of 3232; at 2pm ET, this benchmark index touched 3230 after reaching 3238 this morning
- Rotation is clearly back toward the weaker pandemic stocks and the industry groups that have shown relative weakness since February
- Industrials (XLI, +2.55%) and materials (XLB, +1.63%) lead 10 of the 11 sectors higher
- Utilities (XLU, -0.17%) is the lone sector in negative territory
- Earnings are in focus as Goldman Sachs (GS, +1.12%) crushed revenue and EPS estimates; it was up nearly 5% in early action, but has since pulled back to approach gap support
- Moderna (MRNA, +9.37%) disclosed results from its Phase I vaccine trial, which showed that all 45 patients demonstrated strong immune responses to COVID-19
Market Outlook
The market is getting a lift from beaten-down names no doubt. That theme presented itself on Friday and hasn't let up since. If anything, the disconnect between the strong pandemic stocks and weak pandemic stocks has only grown wider today. I look for further strength in Dow components based on the following chart:
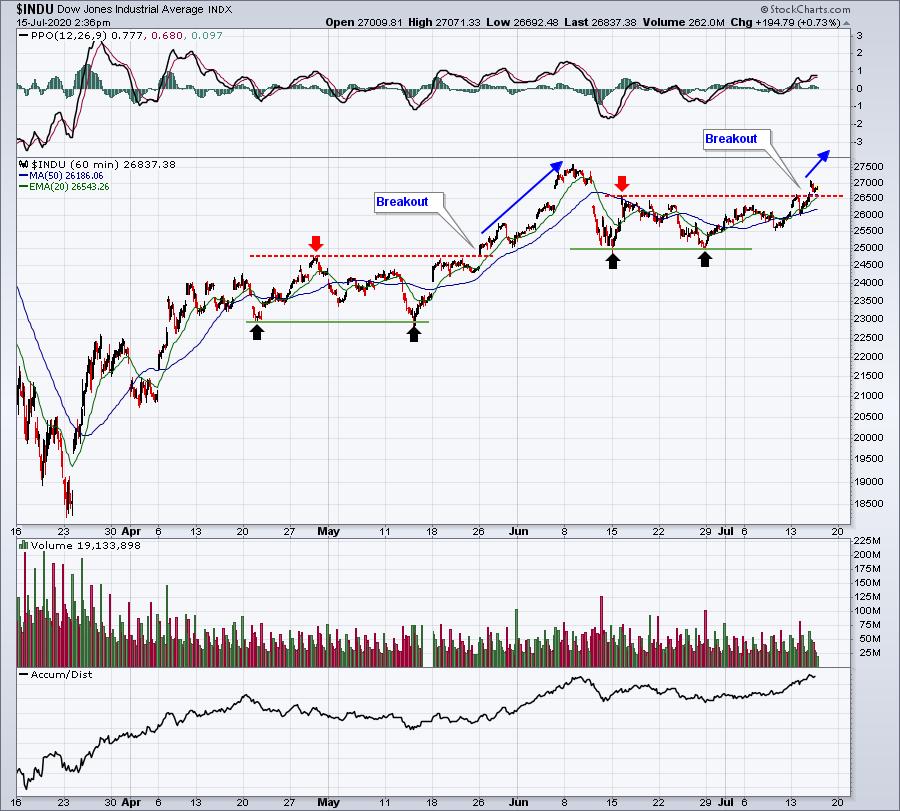
Technical analysis never provides us any guarantees, but there are a couple factors that suggest the rotation into Dow Jones component stocks will continue. First, many of these components have not had the run ups like Apple (AAPL) and Microsoft (MSFT), so as we head toward options expiration, max pain is not an issue for many Dow stocks. Second, check out the above chart. The black arrows mark double bottoms. When the high (red arrow) between these bottoms is eventually cleared, it's generally a technical signal to buy. We enjoyed a nice advance higher in May when this occurred and I believe we could see it again now. I expect at least a push higher to test the June 8th intraday high of 27580. That would be another 3% higher from the current index value.
Sector/Industry Focus
Recreational services ($DJUSRQ), especially cruise lines, are seeing massive gains today. Moderna's (MRNA) news of an excellent immune response from all 45 patients to their COVID-19 trial has lit a fire under stocks that have been stagnant, or even worse, during this pandemic. That opened the flood gates to buyers in that area of the market. Check out today's gains in the top 5 S&P 500 performers - Royal Caribbean (RCL), Norwegian Cruise Line (NCLH), Carnival Corp (CCL), American Airlines (AAL), and United Airlines (UAL):
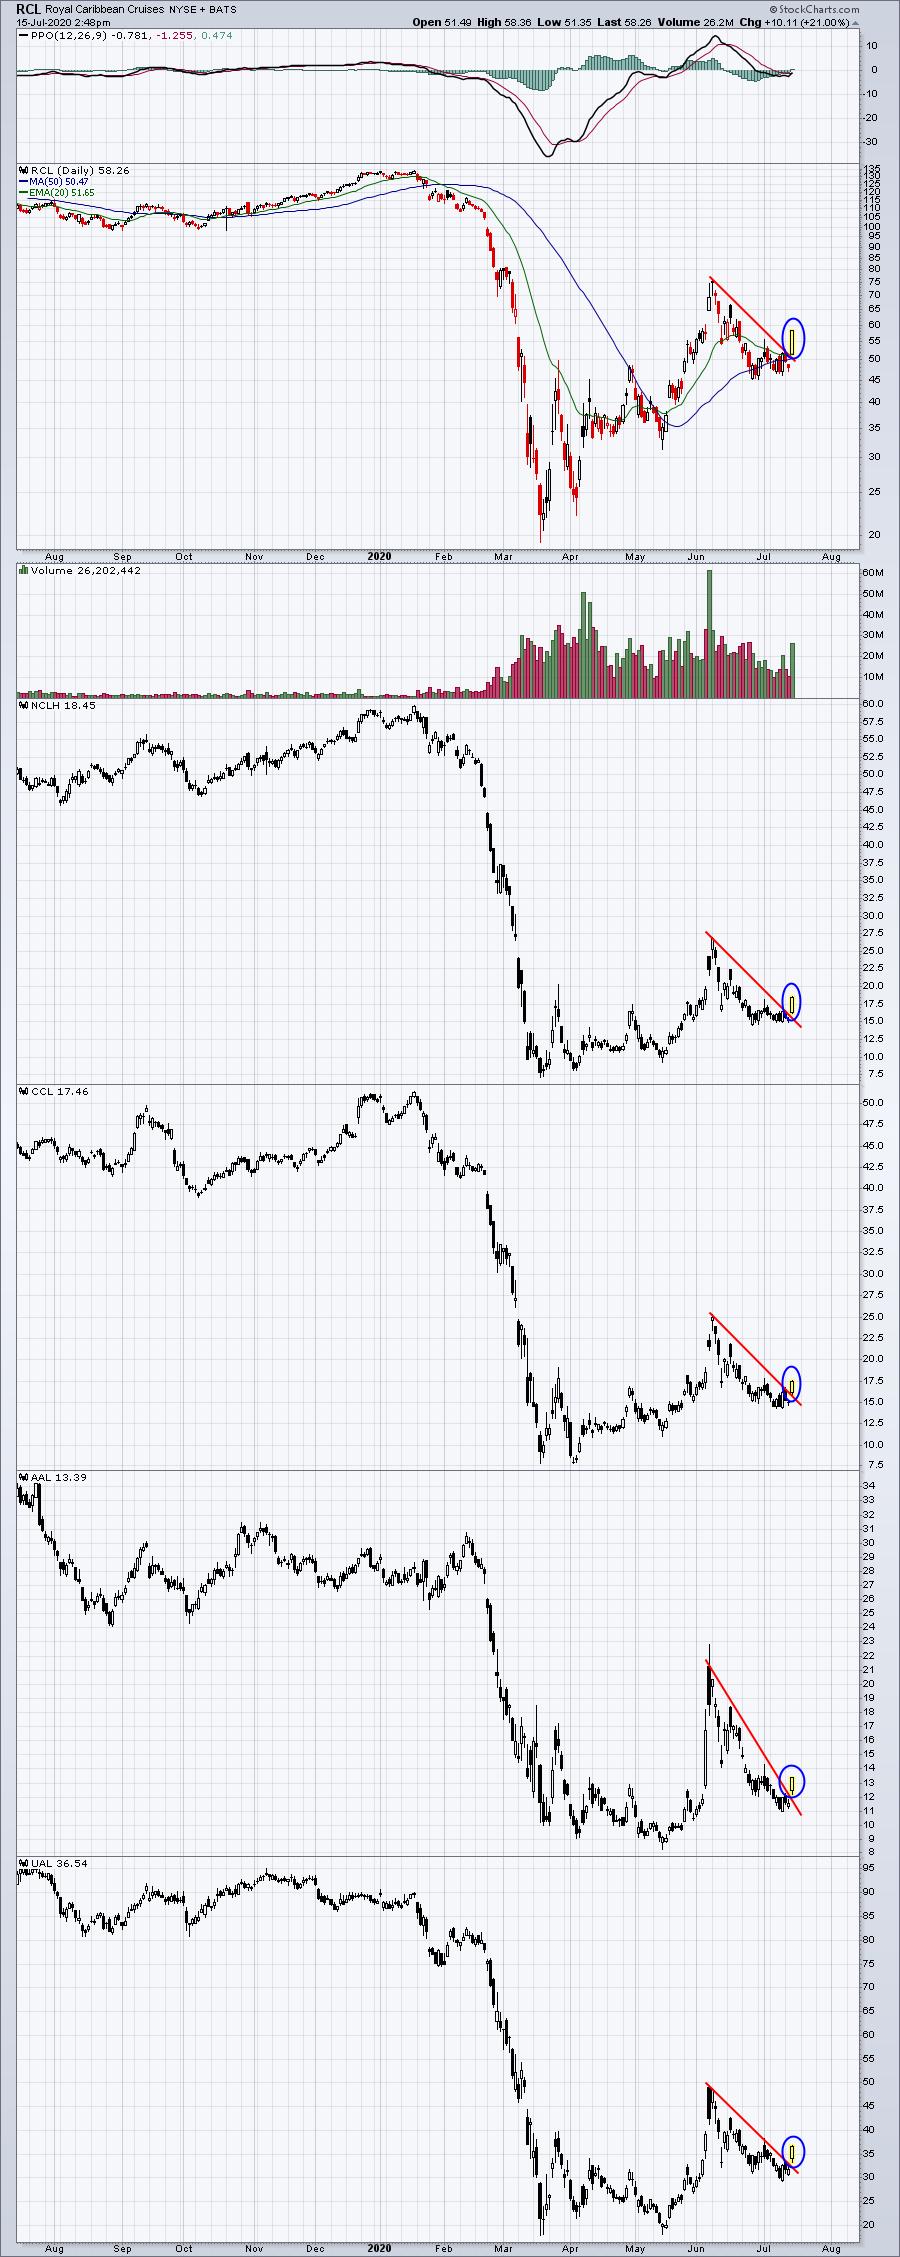
All 5 are breaking recent downtrends AND they all had significant net in-the-money put premium on the table heading into the final three days before July monthly options expire. I believe we could see additional short-term strength from all 5 stocks, although I'd still avoid them all on a longer-term basis. There remains a ton of uncertainty, not just with regard to the virus and how long it lasts, but also with the psyche of travelers across the globe. Even with a proven vaccine, it's still very questionable how willing consumers will be to go on a cruise or to fly.
ChartLists
To illustrate what I mean when I say that the weak pandemic stocks are leading, check out our ChartLists and their performance breakdown today:
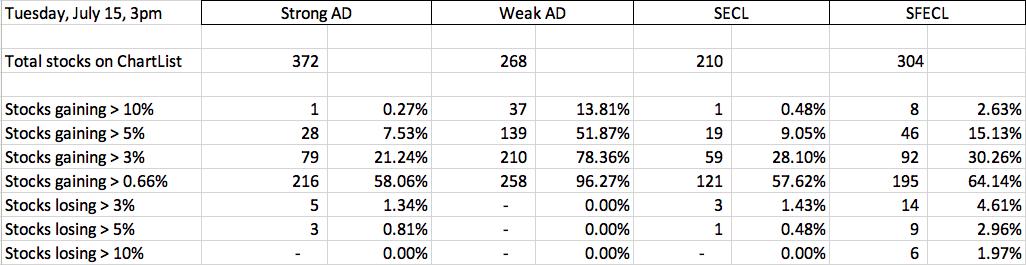
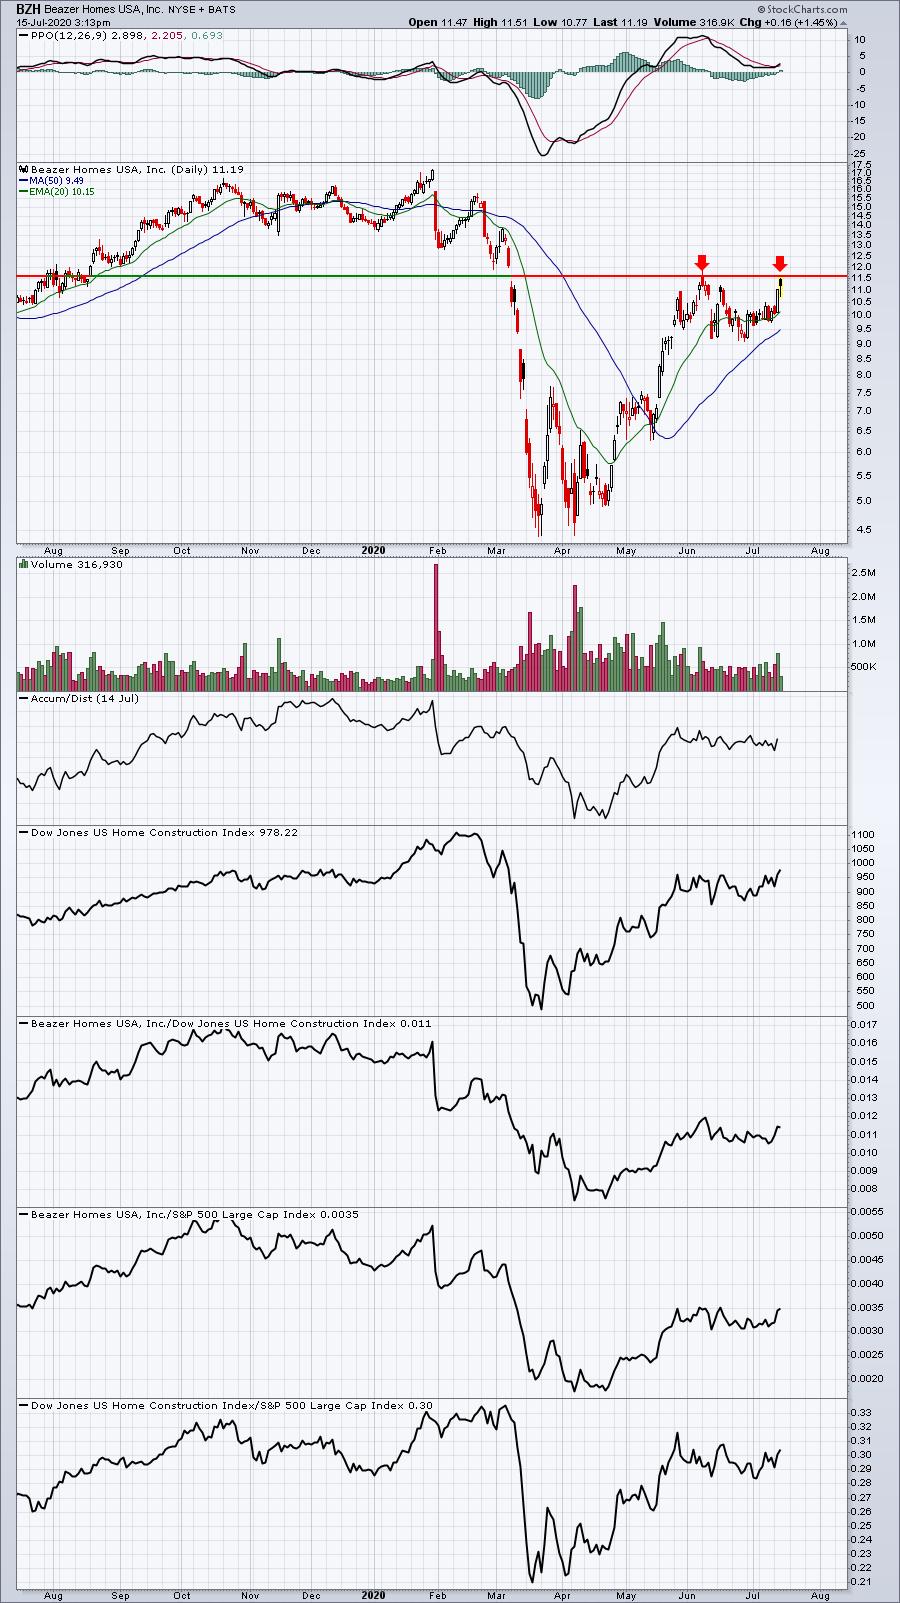
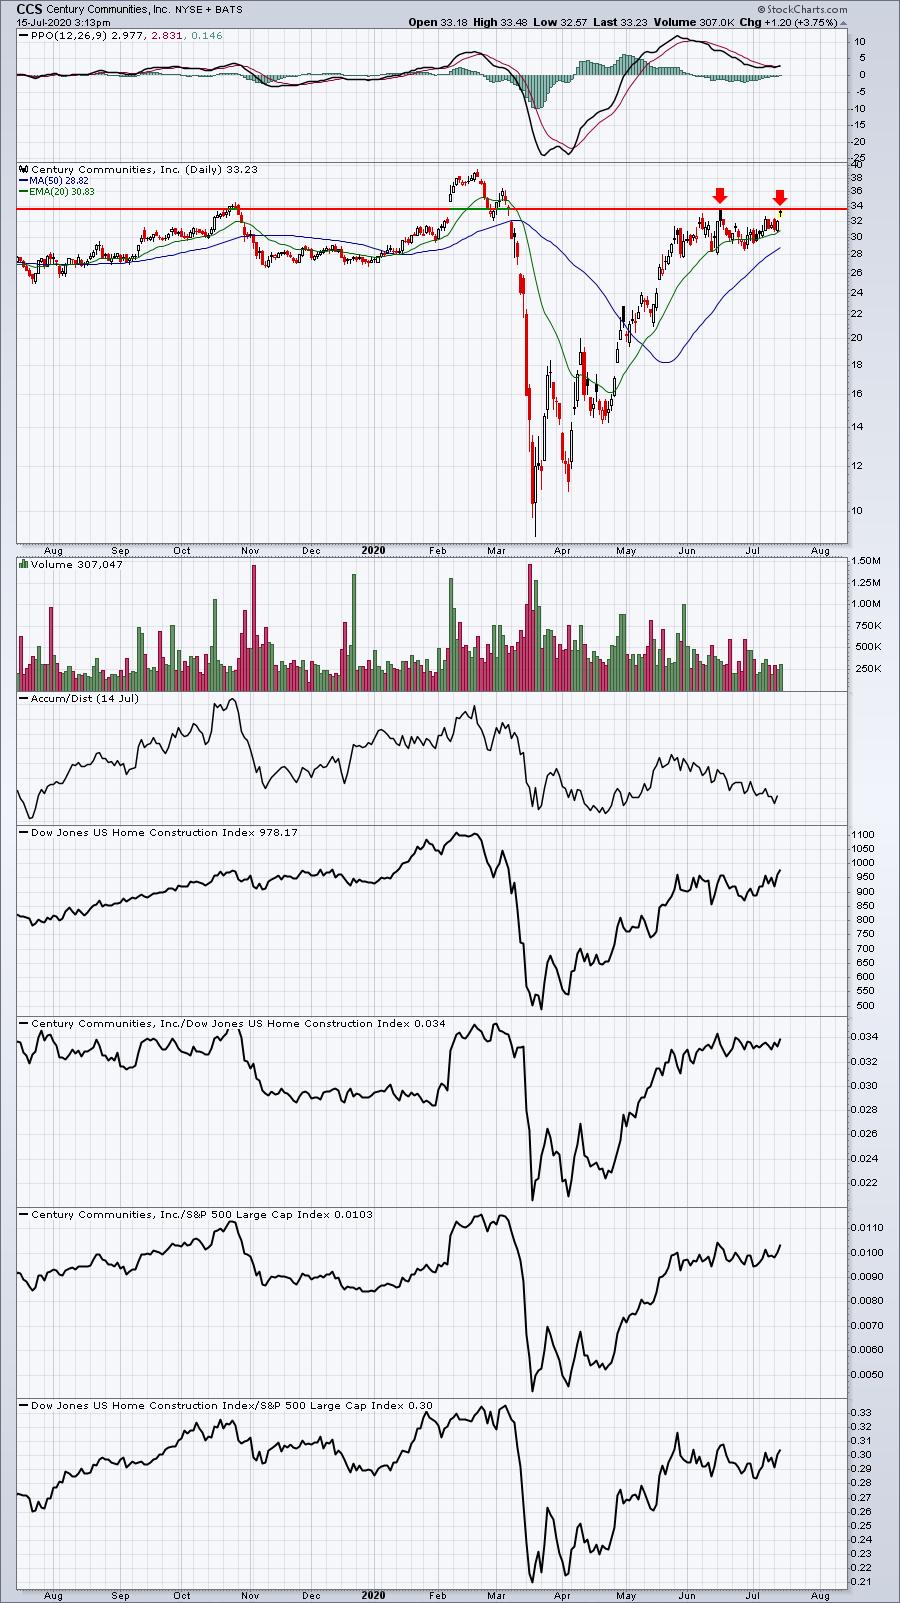
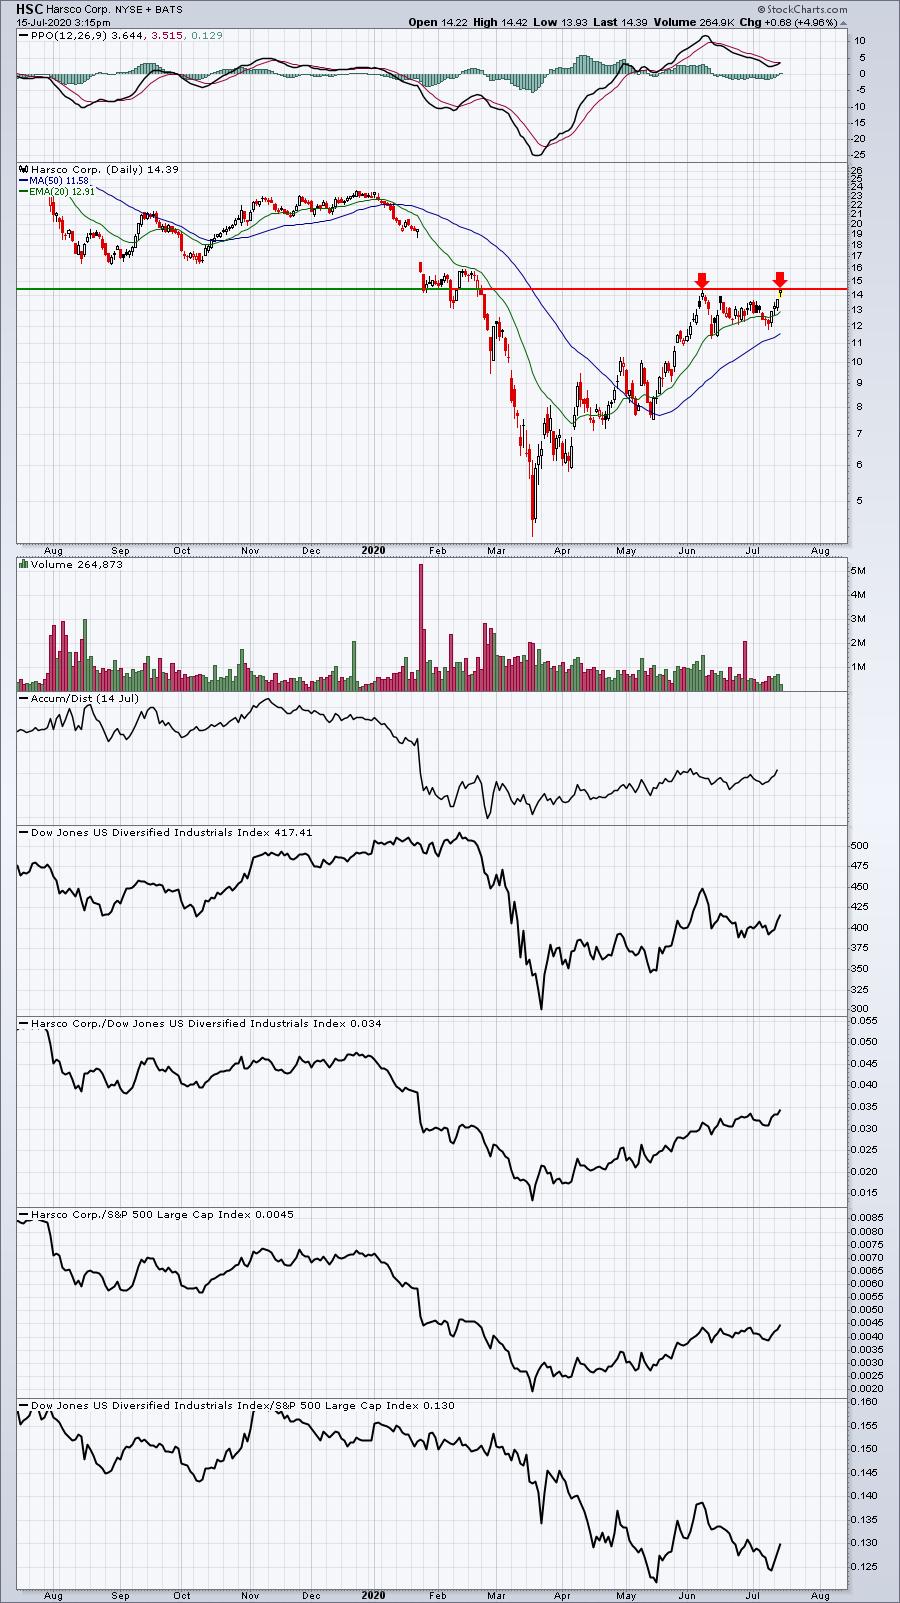
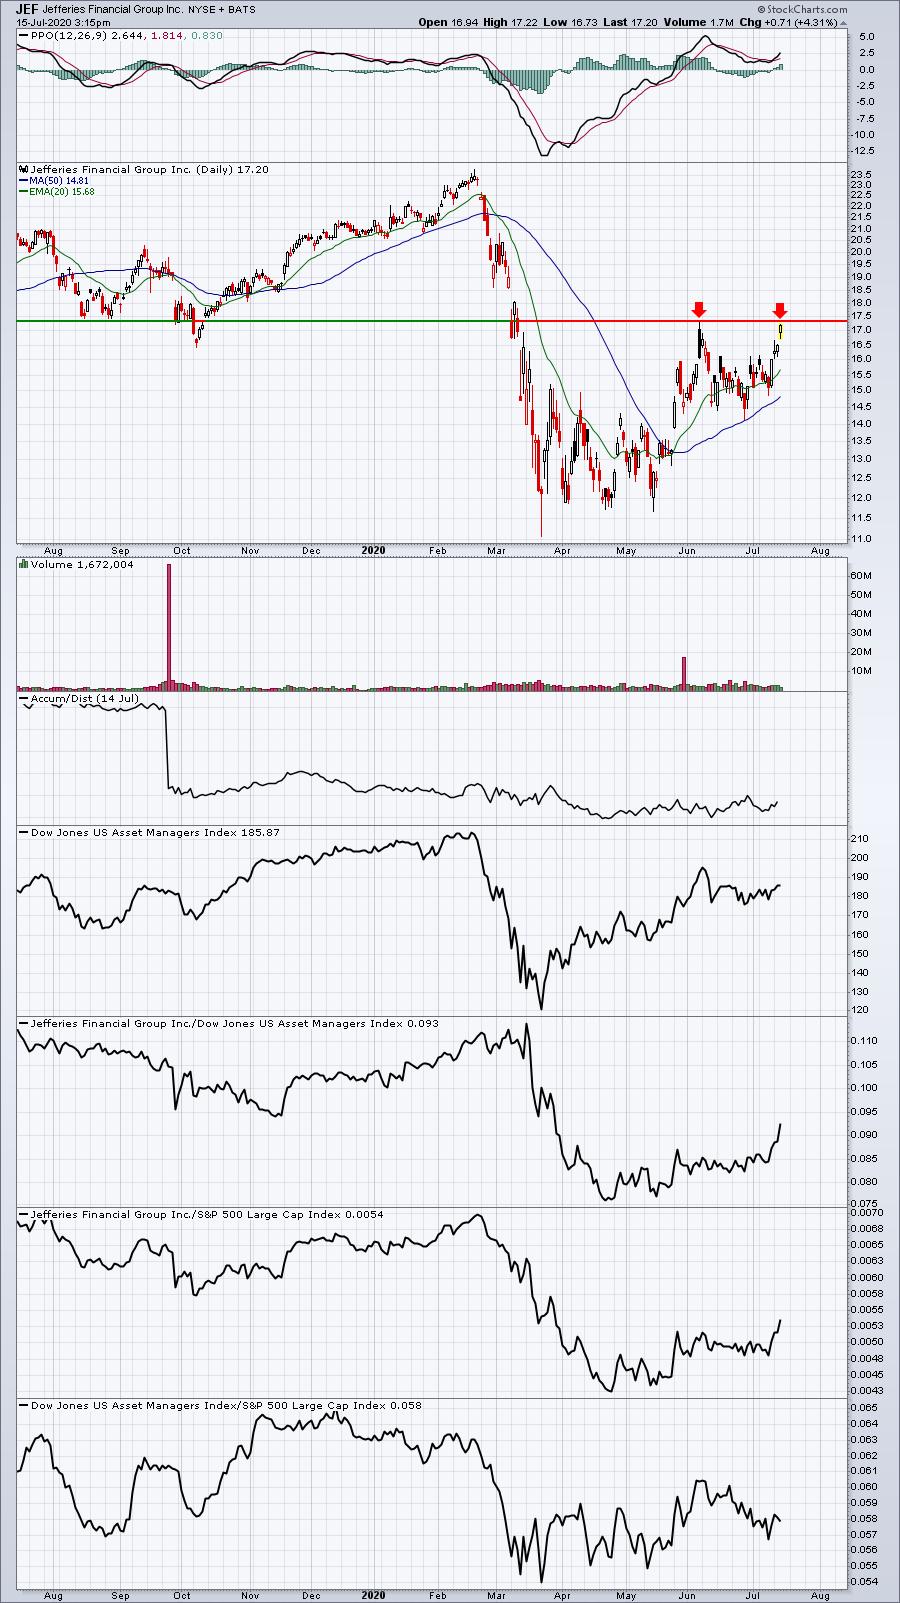
Notice I added one line item, "Stocks gaining > 0.66%". The S&P 500 was up 0.66% as I prepared this breakdown. So this particular line item tells us the percentage of stocks within each ChartList that is outperforming the benchmark S&P 500. Three of our ChartLists range from 57% to 64%, but check out the Weak AD ChartList. 96% of its stocks have outperformed the S&P 500 today. Almost 52% have gained at least 5%. This is the importance of recognizing whether the market is favoring the strong pandemic stocks or the weak pandemic stocks. The following Weak AD ChartList stocks are worth considering given technical developments today:
BZH:
CCS:
HSC:
JEF:
WCC:
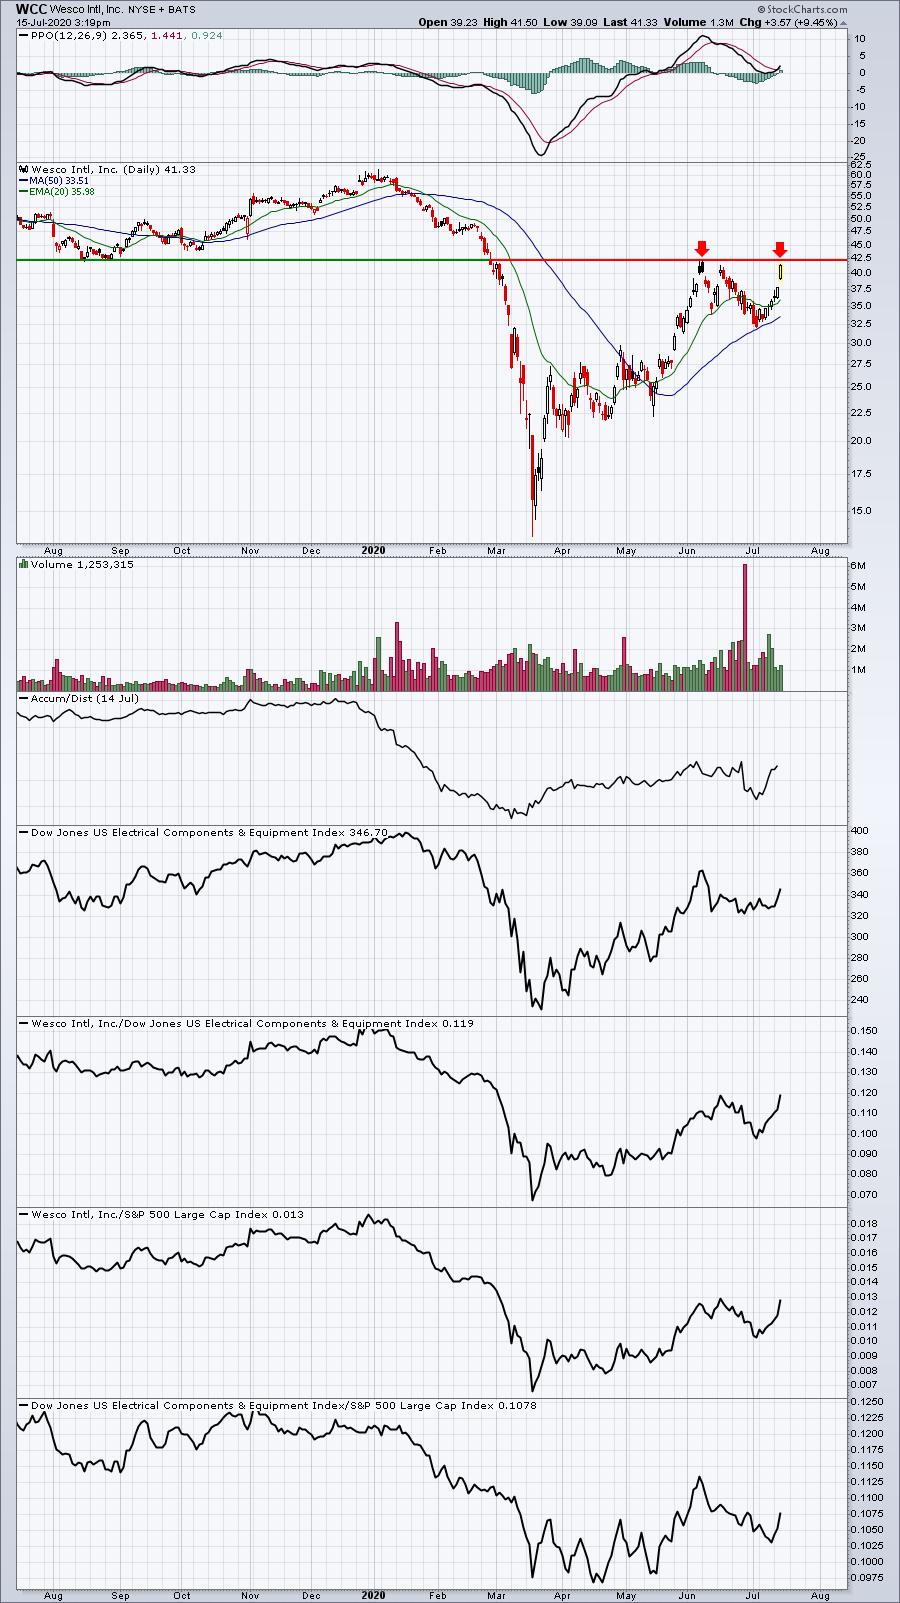
When you look at all the Weak AD stocks, most of them look nearly identical - topping back on June 8th and downtrending since then. Many are breaking those downtrends this week, but the 5 stocks above are already challenging that June high, which demonstrates relative strength in this group. I'd consider trading breakouts if we get them, especially if volume confirms.
Earnings Reports
Here are the key earnings reports for today and tomorrow, featuring stocks with market caps of more than $10 billion. I also include a few select companies with market caps below $10 billion. Finally, any portfolio stocks (or active trade alerts) that will be reporting results are highlighted in BOLD. If you decide to hold a stock into earnings, please understand the significant short-term risk that you are taking. Please be sure to check for earnings dates for any companies you own or are considering owning:
Wednesday, July 15:
UNH, ASML, GS, USB, PGR, INFY, PNC, BK, AA, SNBR
Thursday, July 16:
JNJ, TSM, NFLX, BAC, ABT, MS, TFC, PPG, DPZ, JBHT, SON, HTLD, MRTN
Economic Reports
July empire state manufacturing survey: 17.2 (actual) vs. 8.9 (estimate)
June industrial production: +5.4% (actual) vs. +4.4% (estimate)
June capacity utilization: 68.6% (actual) vs. 68.1% (estimate)
Happy trading!
Tom