
EB Daily Market Report - Thursday, July 16, 2020
Executive Market Summary
- Futures were lower this morning, although the NASDAQ was again taking the brunt of the early selling
- Retail sales, not nearly as strong as last month's record gain, still jumped 7.5%, well ahead of estimates
- Weak pandemic stocks continue to hold the edge in terms of positive rotation this week
- Airlines and cruise lines leading the S&P 500 yesterday have reversed course today and are laggards
- Technology (XLK, -1.61%) is the weakest sector; software ($DJUSSW) is down more than 2%
- Home construction ($DJUSHB) is up close to 2% after a surprisingly strong housing market index this morning
- Bank of America (BAC) managed to beat EPS expectations, despite providing for another $4 billion in loan loss reserves
- Asian markets were very weak overnight, while losses in Europe are more moderate today
- Netflix (NFLX) gets set to report its quarterly results after the bell today
Market Outlook
The stock market still faces a problem in that sentiment, namely the equity put call ratio ($CPCE), remains incredibly bullish. The constant and relentless bullishness in the options world is what we need to worry about - in the short-term. On the chart below, I'm once again showing the 5 day moving average of the CPCE. It's this moving average that underscores the relentlessness of call buyers, in my opinion:
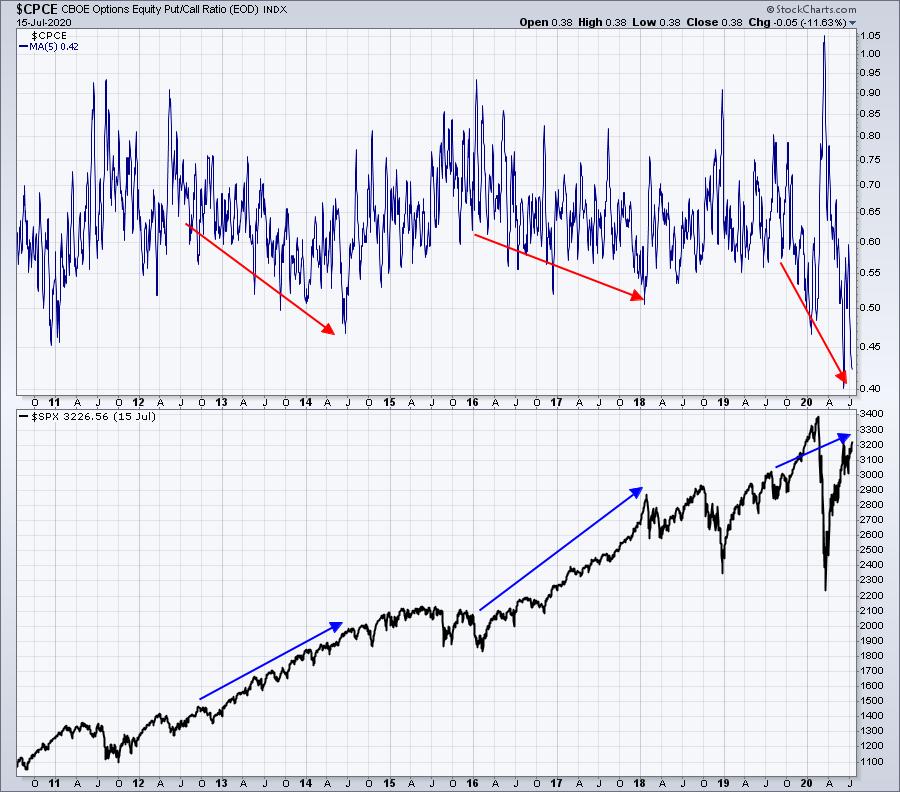
As we saw in 2013/2014 and again throughout 2017, rally after rally after rally changed the psyche of traders. They grew incredibly complacent and that can spell trouble. The bearish camp can certainly argue that the crazy bullishness right now is greater than what we saw during either of those two previous periods. But the big difference this year is that this complacency has come on the heels of incredibly volatility, as opposed to straight-up rallies. Look at the swings in that 5 day moving average. Off the charts panic in March followed by extreme complacency in July. How will this end? Honestly, it's very difficult to predict because it's never happened before. One side of me says we do need to be careful because complacency combined with historically-weak summer returns could lead to consolidation at best. But my fundamental accounting side says if growth companies can prove that their earnings growth is sustainable, they deserve much higher valuations.
In a nutshell, that's the battle that lies before us. I'm still expecting the bifurcation that we've seen since February (strong pandemic stocks vs. weak pandemic stocks) to continue throughout the summer. Since early this morning, we've begun to see money rotate back into the stronger pandemic stocks. It could be in anticipation of Netflix (NFLX) earnings later today. The rotation tomorrow will be more important.
Sector/Industry Focus
Semiconductors ($DJUSSC) are usually a good gauge of economic activity as more and more chips are found in every day "things". If we view the DJUSSC from a longer-term weekly perspective, you might be surprised to see that even March's panicked selloff fell exactly to its lower channel uptrend line using the Andrews Pitchfork tool at StockCharts.com:
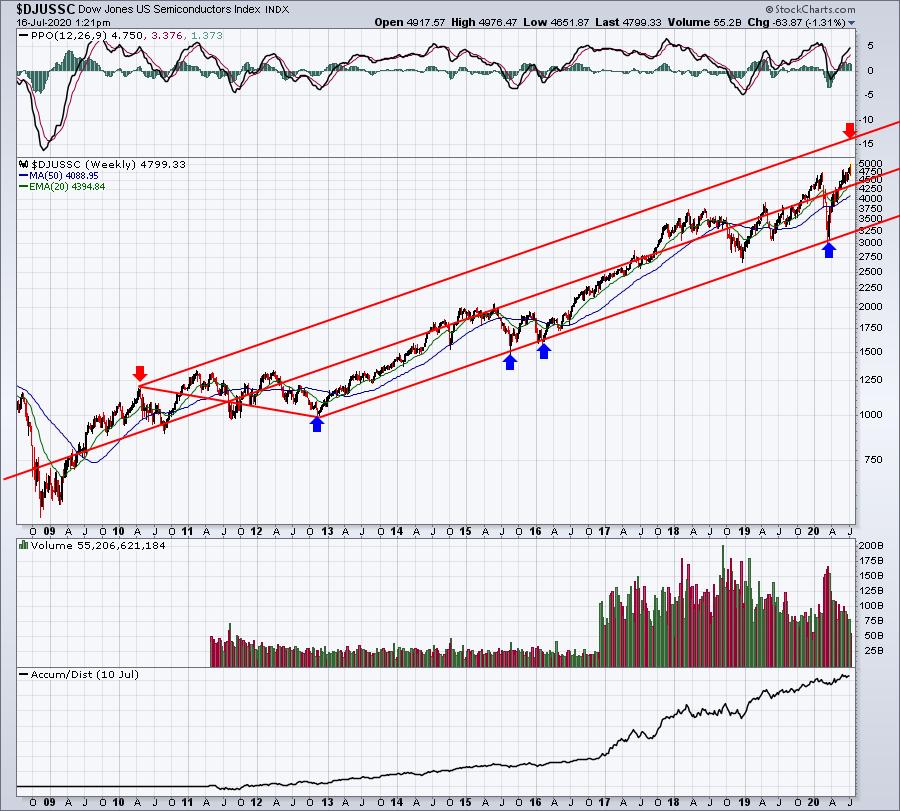
The upper channel uptrend line suggests this group could have much further to go, perhaps as much as 800-1000 additional points to reach that boundary. I'm not saying that we're heading there any time soon (although we could), but rather pointing out the technical boundary that I'd be aware of.
ChartLists
First, all of our ChartLists are actually performing similarly today. Earlier, our Weak AD ChartList had an advantage, but as the day has worn on, we're seeing more strength in NASDAQ shares. That could be the anticipation of the Netflix (NFLX) quarterly earnings report after hours today.
I ran a scan today of 20 day EMA tests, but added a filter for SCTR scores over 95. Here is what was returned:
LOVE, REGN, TTD, VEEV, ZS, NOW, PRNB, DXCM
Clearly, the idea here is to consider a trade of a very strong stock on a test of its 20 day EMA. Here is one of the better charts:
TTD:
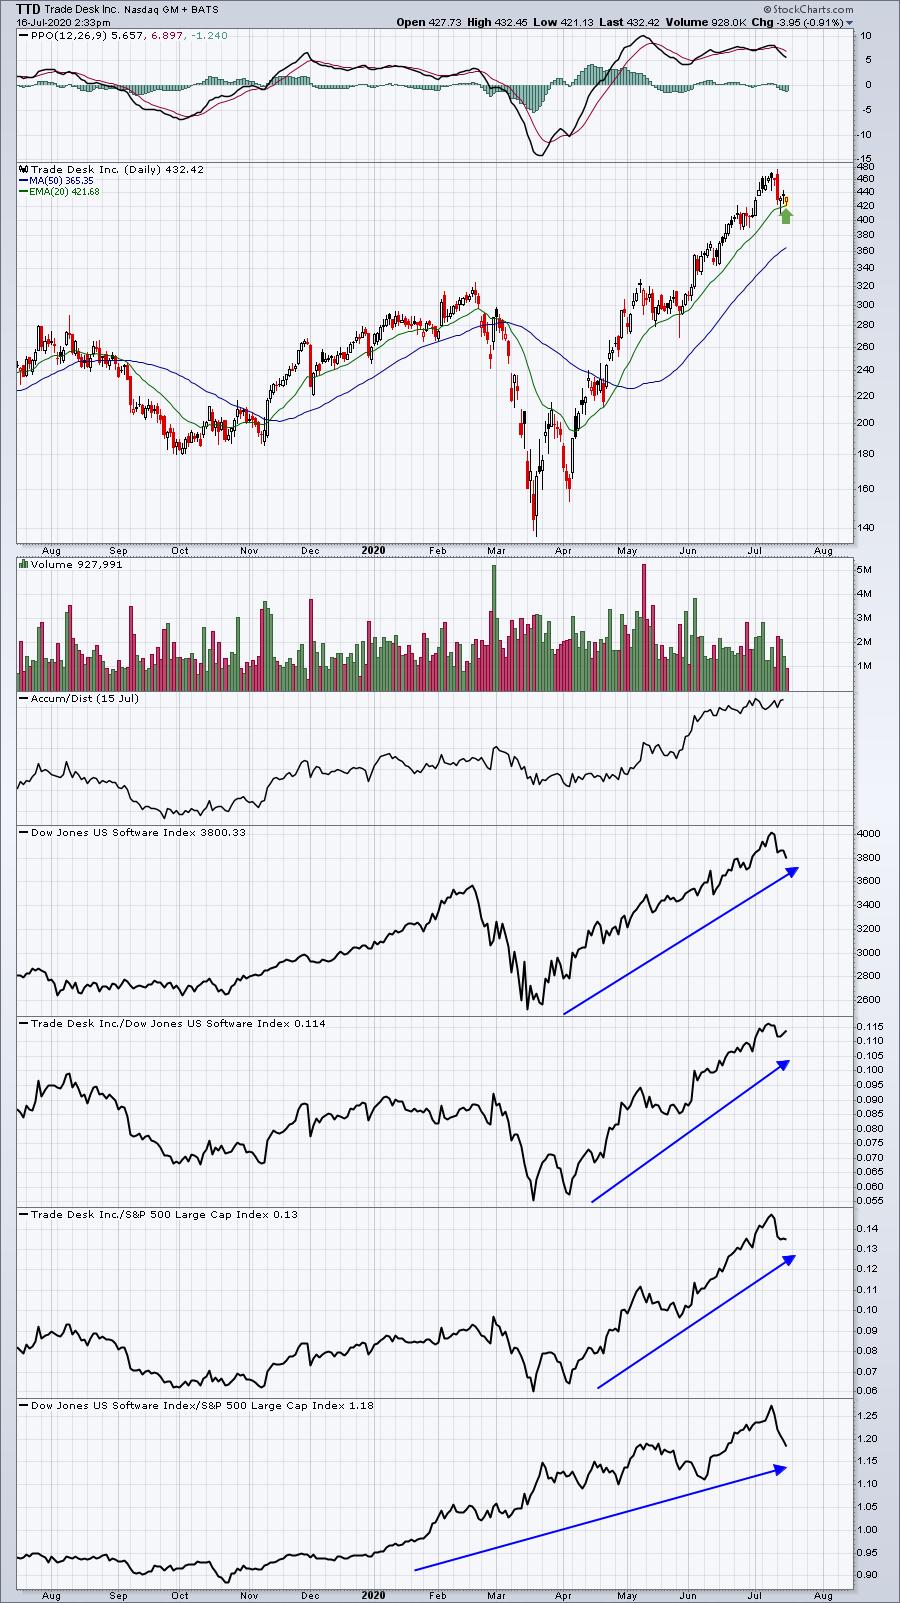
At some point, these 20 day EMA tests won't work. But TTD has not closed below its 20 day EMA in over 3 months.
I also noticed that Medical Equipment ($DJUSAM) is breaking out. I looked through our ChartLists to see which medical equipment stock might have great potential.
GNMK:
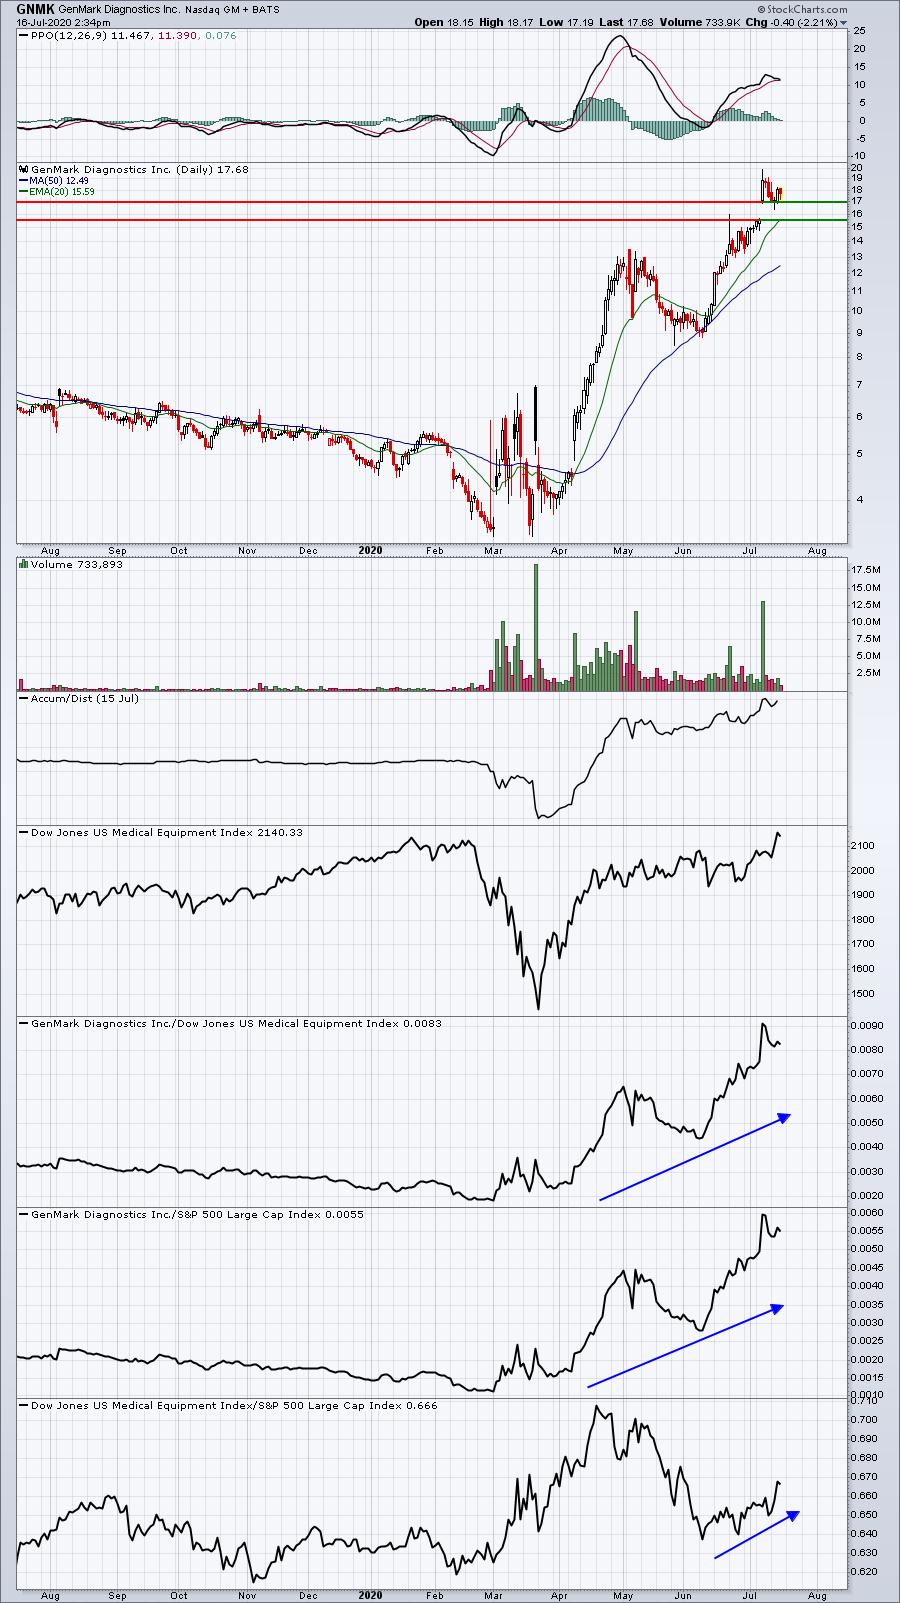
I like the top of gap support holding here. This is an aggressive trade, but leaders are leaders for a reason. I expect higher prices. A partial position with another position if the bottom of gap support is tested might make sense for some. Those who are ultra-conservative might want to avoid these riskier growth plays.
Earnings Reports
Here are the key earnings reports for today and tomorrow, featuring stocks with market caps of more than $10 billion. I also include a few select companies with market caps below $10 billion. Finally, any portfolio stocks (or active trade alerts) that will be reporting results are highlighted in BOLD. If you decide to hold a stock into earnings, please understand the significant short-term risk that you are taking. Please be sure to check for earnings dates for any companies you own or are considering owning:
Thursday, July 16:
JNJ, TSM, NFLX, BAC, ABT, MS, TFC, PPG, DPZ, JBHT, SON, HTLD, MRTN
Friday, July 17:
BLK, ERIC, STT, KSU, CFG, RF, ALLY, ALV
Economic Reports
Initial jobless claims: 1,300,000 (actual) vs. 1,288,000 (estimate)
June retail sales: +7.5% (actual) vs. +5.2% (estimate)
June retail sales less autos: +6.7% (actual) vs. +5.0% (estimate)
July Philadelphia Fed Survey: 24.1 (actual) vs. 20.0 (estimate)
May business inventories: -2.3% (actual) vs. -2.3% (estimate)
July housing market index: 72 (actual) vs. 60 (estimate)
Happy trading!
Tom