
EB Daily Market Report - Monday, July 20, 2020
Today's Event
It's time! Our "Q2 Earnings" webinar will start promptly at 4:30pm ET. Believe me, there will be PLENTY to discuss. In addition to reviewing some of the best earnings reports to date, I'll provide you my analysis of many of the biggest earnings reports to be delivered over the next 2-3 weeks. And, if that's not enough, I'll also discuss our latest research product, our Raised Guidance ChartList (RGCL), and how you can use it to uncover great trading opportunities!
Our webinar room will be open by 4:00pm ET and you can join us using the link below:
https://us02web.zoom.us/j/83194002926
I hope to see you there! (But if you can't make it, no worries. All of our webinars are recorded and available for viewing shortly after the webinar ends.)
Executive Market Summary
- Futures were mixed with relative strength in the technology-laden NASDAQ
- Earnings season will accelerate this week, although economic reports will be sparse
- The 10 year treasury yield ($TNX) is down 1 basis point to 0.62%
- The S&P 500 is trading just above critical closing price resistance at 3232; a breakout could result in another leg higher
- Halliburton (HAL) posted better than expected EPS and leads the S&P 500, up 6.57% at last check
- Technology (XLK) and consumer discretionary (XLY) are leading today, while utilities (XLU) lag
- Broadline retail ($DJUSRB), renewable energy ($DWCREE), and software ($DJUSSW) are the best industry groups today
Market Outlook
Is it time to consider materials stocks (XLB)? This sector has been climbing the sector leaderboard in terms of both absolute and relative strength. From the table below, it's quite obvious that materials are seeing lots of dollars rotating into the group:
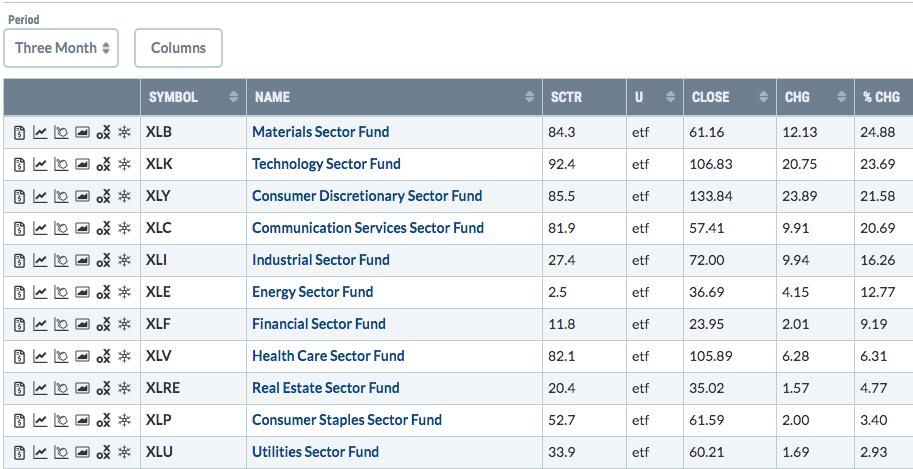
That's a look at the last three months. Materials is #1, ahead of technology (XLK), consumer discretionary (XLY), and communication services (XLC). Its SCTR is now at 84.3, nearly tied with the XLY, and really only trailing the XLK. But is it the best sector?
I say no - or at least NOT YET. The relative strength in materials is highly dependent on a falling dollar ($USD). That's quite evident when looking at the following chart:
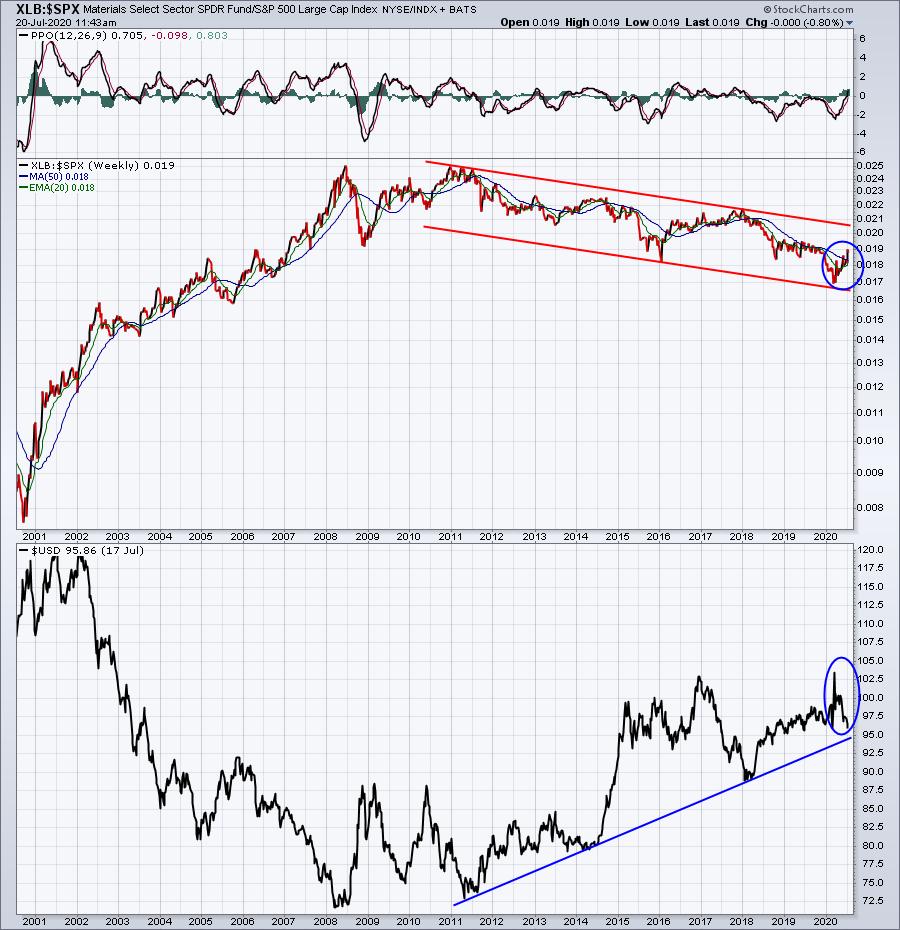
The trendlines show the BIG PICTURE, which is that of a rising dollar and relatively weak materials group. The blue circles highlight what all the recent excitement is about. Listen, we're in a bull market. Just about everything is going higher on an absolute basis. It's the relative strength that we need to be most concerned about. Do you see a long-term breakdown in the dollar above? Do you see a long-term breakout in the relative strength of materials? If you look back, we have had previous periods of relative strength in the XLB, but it doesn't last. Will it last this time? My gut says NO, but I'll be open to the alternative if the BIG PICTURE confirms it.
Sector/Industry Focus
To follow up on the materials question posed above, I think it's useful to review intermarket relationships that can help us determine which way the dollar will move. If the U.S. economy strengthens faster than foreign economies, the dollar should rise. If the opposite is true, the dollar should fall. The best way to determine relative strength in economies is to look at relative strength in treasury yields. In terms of correlation, I've found Germany to be the most useful vs. the U.S. So the following chart highlights the difference in our two countries' 10 year treasury yields over time ($UST10Y-$DET10Y):
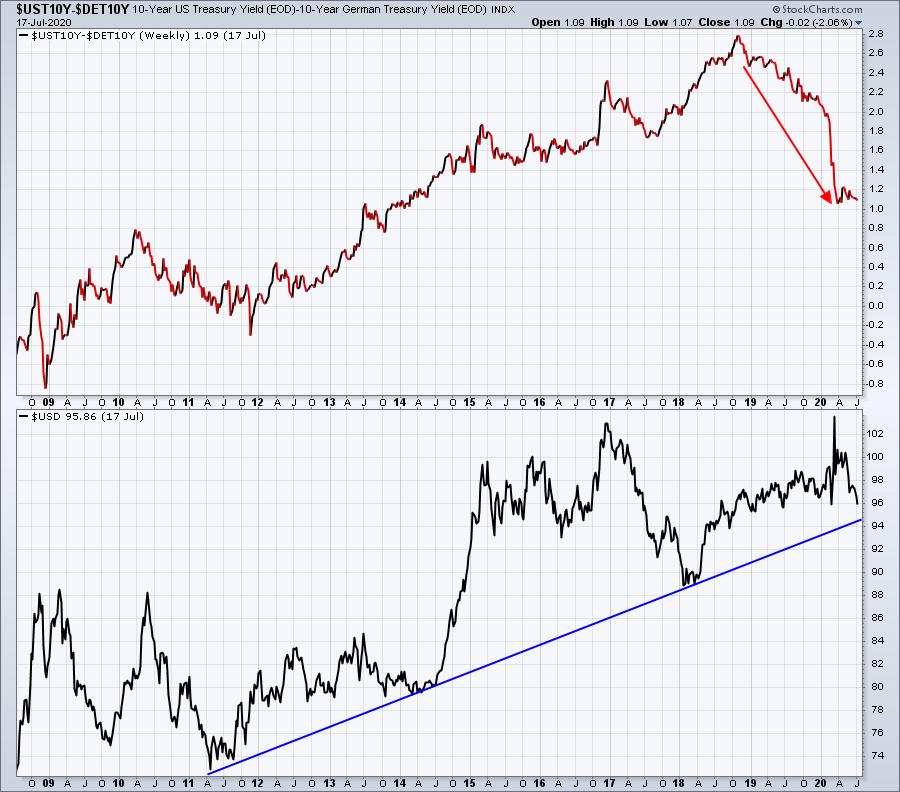
The top part of this chart tells us that U.S. treasury yields are declining rapidly vs. German treasury yields. That suggests a weaker dollar and relative strength in materials. But, as mentioned in earlier, that dollar index has not broken its long-term uptrend. Until that happens, I'd view the relative strength in materials with caution.
ChartLists
We've unveiled yet another ChartList! This time, it's our Raised Guidance ChartList (RGCL), featuring companies where management teams are executing at a high level and raising previous guidance. While that's always a good thing to track, it might be even more appealing in a pandemic environment. I will be discussing this new feature and how we can best use it at this afternoon's webinar.
In the meantime, it's worth mentioning that we have clearly seen rotation back into the strong pandemic stocks - those that showed very strong AD lines during the March/April period. As proof, here are the percentage of stocks in our Strong and Weak AD ChartLists that are beating the S&P 500 today:
Strong AD ChartList: 56.91%
Weak AD ChartList: 9.74%
This underscores my belief that simply buying and holding the Weak AD ChartList stocks is a big, big mistake.
I'll just give one stock today that I'm watching. it's Fresenius Medical Care (FMS). I like the flag pattern after the huge rise. Also, accumulation/distribution is turning back up and it's turning back up vs. its health care provider ($DJUSHP) peers:
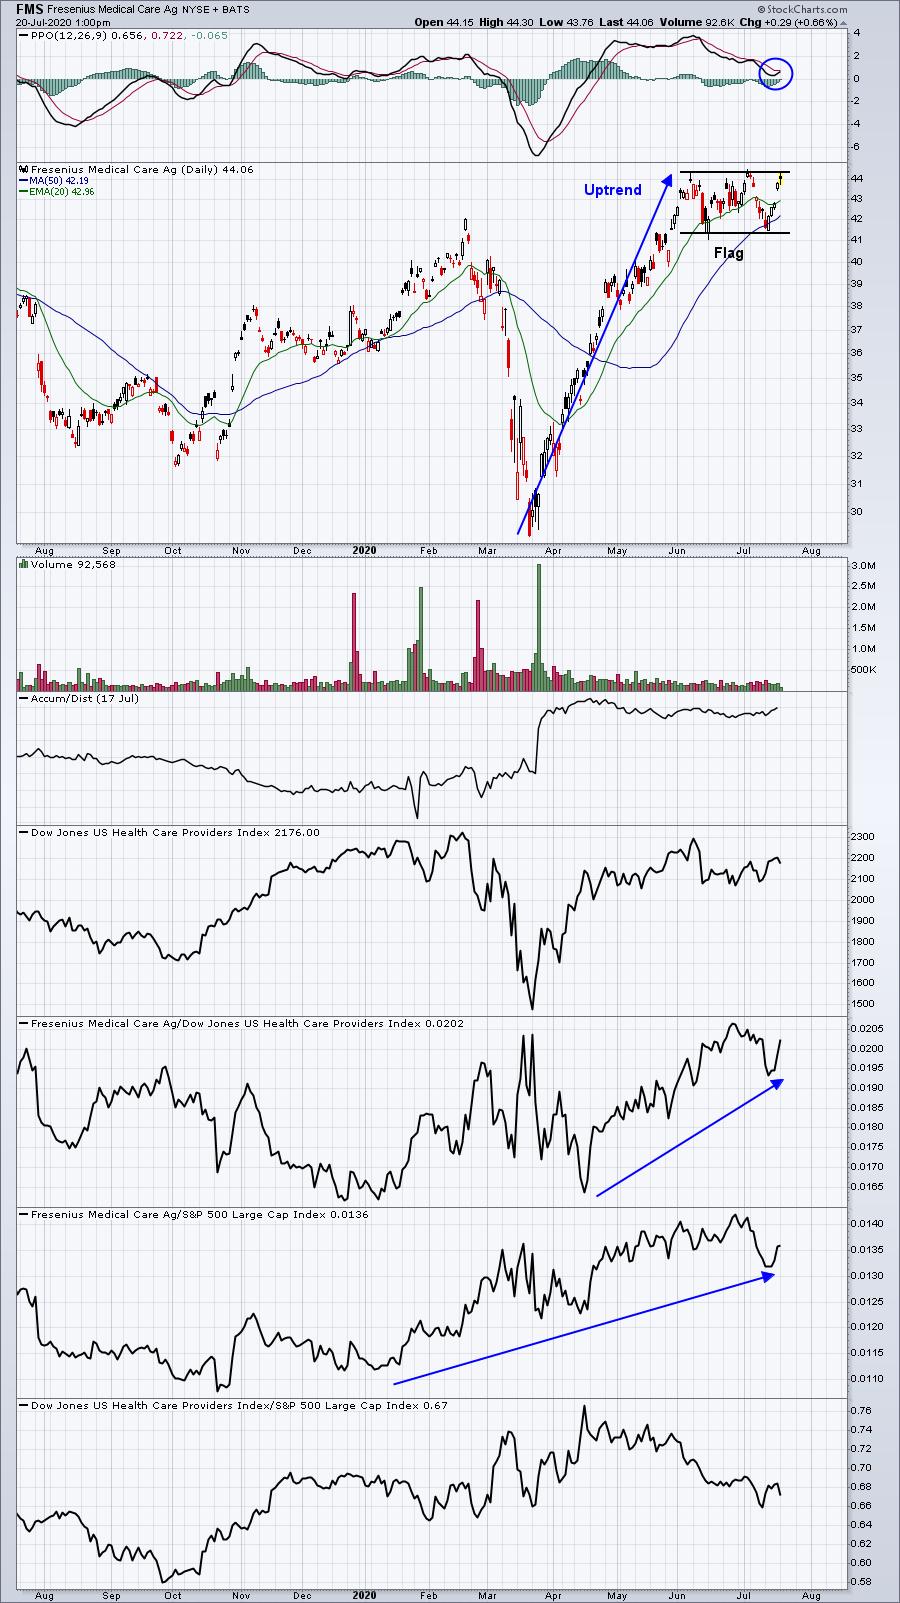
The early July high coincided with a much lower PPO, which is a negative divergence. FMS fell back to test its 50 day SMA after that, which is what I look for, printed a bullish engulfing reversing candle and is now back at resistance. That blue circle highlights the PPO now turning higher after nearly testing its centerline support. The only thing missing here is the breakout.....
Earnings Reports
Here are the key earnings reports for today and tomorrow, featuring stocks with market caps of more than $10 billion. I also include a few select companies with market caps below $10 billion. Finally, any portfolio stocks (or active trade alerts) that will be reporting results are highlighted in BOLD. If you decide to hold a stock into earnings, please understand the significant short-term risk that you are taking. Please be sure to check for earnings dates for any companies you own or are considering owning:
Monday, July 20:
IBM, CDNS, ELS, HAL, LOGI, LII, CCK, STLD, ZION, MAN, LLNW
Tuesday, July 21:
NVS, KO, TXN, PM, LMT, ISRG, PLD, CNI, UBS, SNAP, COF, PCAR, IBKR, AMTD, AGR, TER, SYF, WRB, UAL, IRBT
Economic Reports
None
Happy trading!
Tom