
EB Daily Market Report - Thursday, July 23, 2020
Executive Market Summary
- Futures were down this morning, despite strong widely-anticipated quarterly earnings results from MSFT and TSLA
- Weakness has accelerated as we've moved into the afternoon session
- The U.S. Dollar (UUP) remains under serious pressure, which resulted in early strength from materials (XLB)
- Currently, only consumer staples (XLP) is in positive territory
- Aggressive sectors are leading equities lower, including technology (XLK, -2.49%), communication services (XLC, -1.62%), and consumer discretionary (XLY, -1.46%)
- Computer hardware ($DJUSCR), software ($DJUSSW), automobiles ($DJUSAU), broadline retail ($DJUSRB), and internet ($DJUSNS) are among the weakest industry groups
- Selling after earnings in key stocks like NFLX, MSFT, and TSLA suggest perhaps a short-term top is in on the tech-laden NASDAQ
- Gold ($GOLD) is approaching $1900 per ounce as the 10 year treasury yield ($TNX) drops to 0.58%
Market Outlook
We're now in the heat of summer, which can coincide with a more unstable stock market. While this current week is historically quite bearish, we've managed to hold up well. Those trading NASDAQ shares might disagree as we have now given up all of Monday's huge gains. It's this rotation that's played havoc with traders this week. The following is a 5 month chart showing each sector relative to the benchmark S&P 500:
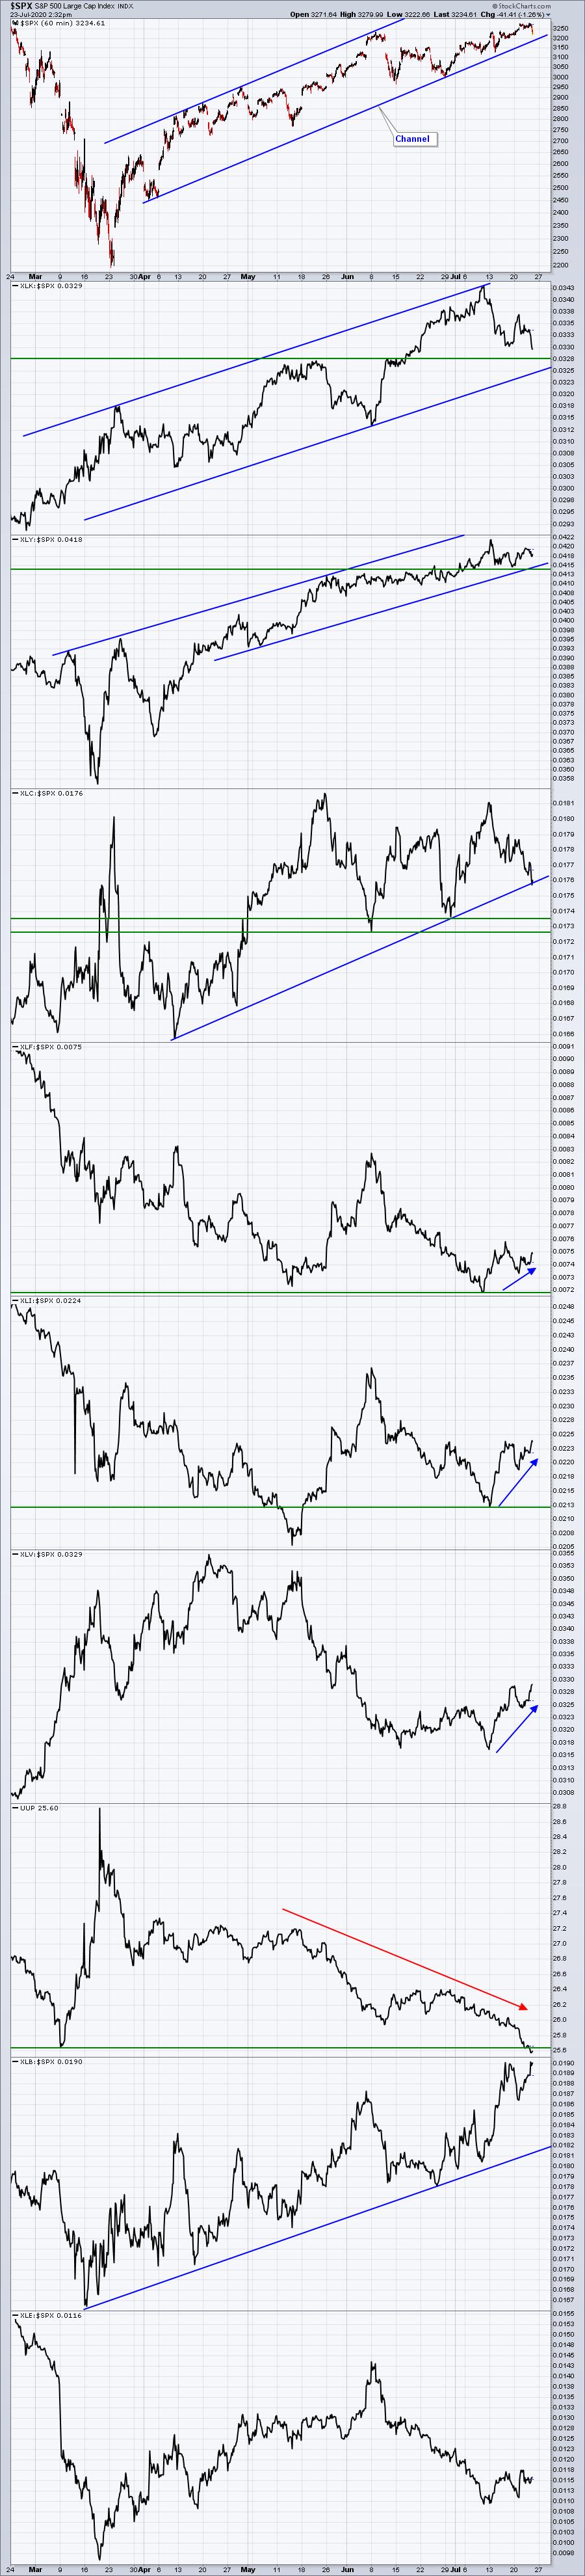
Remember, the first support level on the S&P 500 is 3232. That was the breakout above the June high. An initial selloff to that level should be considered quite normal. Materials (XLB) is definitely the best sector in the near-term. Unless the dollar (UUP) finds a bottom soon, this could be the start of an extended period of outperformance by materials, and definitely something that we'll be watching very closely.
Sector/Industry Focus
A week ago Friday, I mentioned that we began to see rotation in U.S. equities. That rotation continues. Yes, we've seen a brief period here or there where it appears we're rotating back, but it hasn't lasted. One of the best ways to visualize this rotation is to look at the NASDAQ 100 vs. the S&P 500 (NDX:SPX). Another is to view the growth vs. value chart (IWF:IWD). They're both saying the same thing right now:
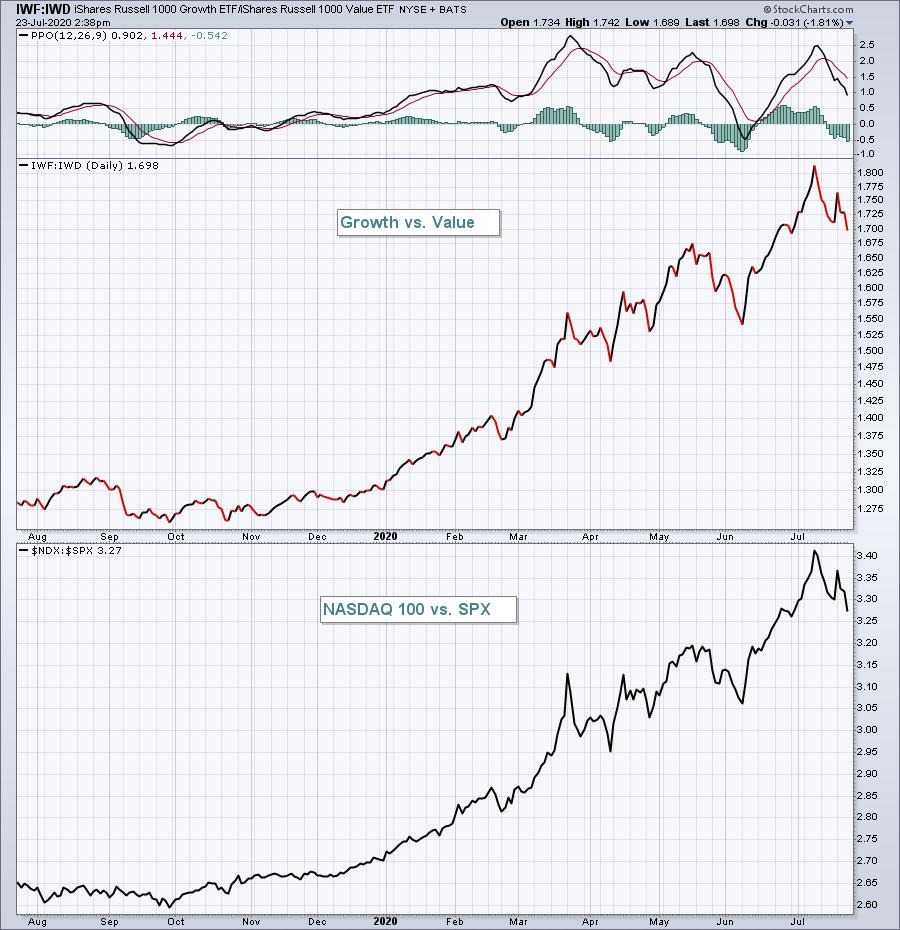
Both of these ratios topped just prior to Friday, July 10th. That is coinciding with the pause in relative strength in our portfolios. Right now, growth stocks are not in favor. I believe that will change again soon, but for now, we must trade what's here.
We've now seen earnings reports from Netflix (NFLX), Microsoft (MSFT), and Tesla (TSLA). All three are trading down after initial earnings reactions, which is suggesting that much of the good news may already be priced in. It's not a bad idea to remain a tad cautious.
ChartLists
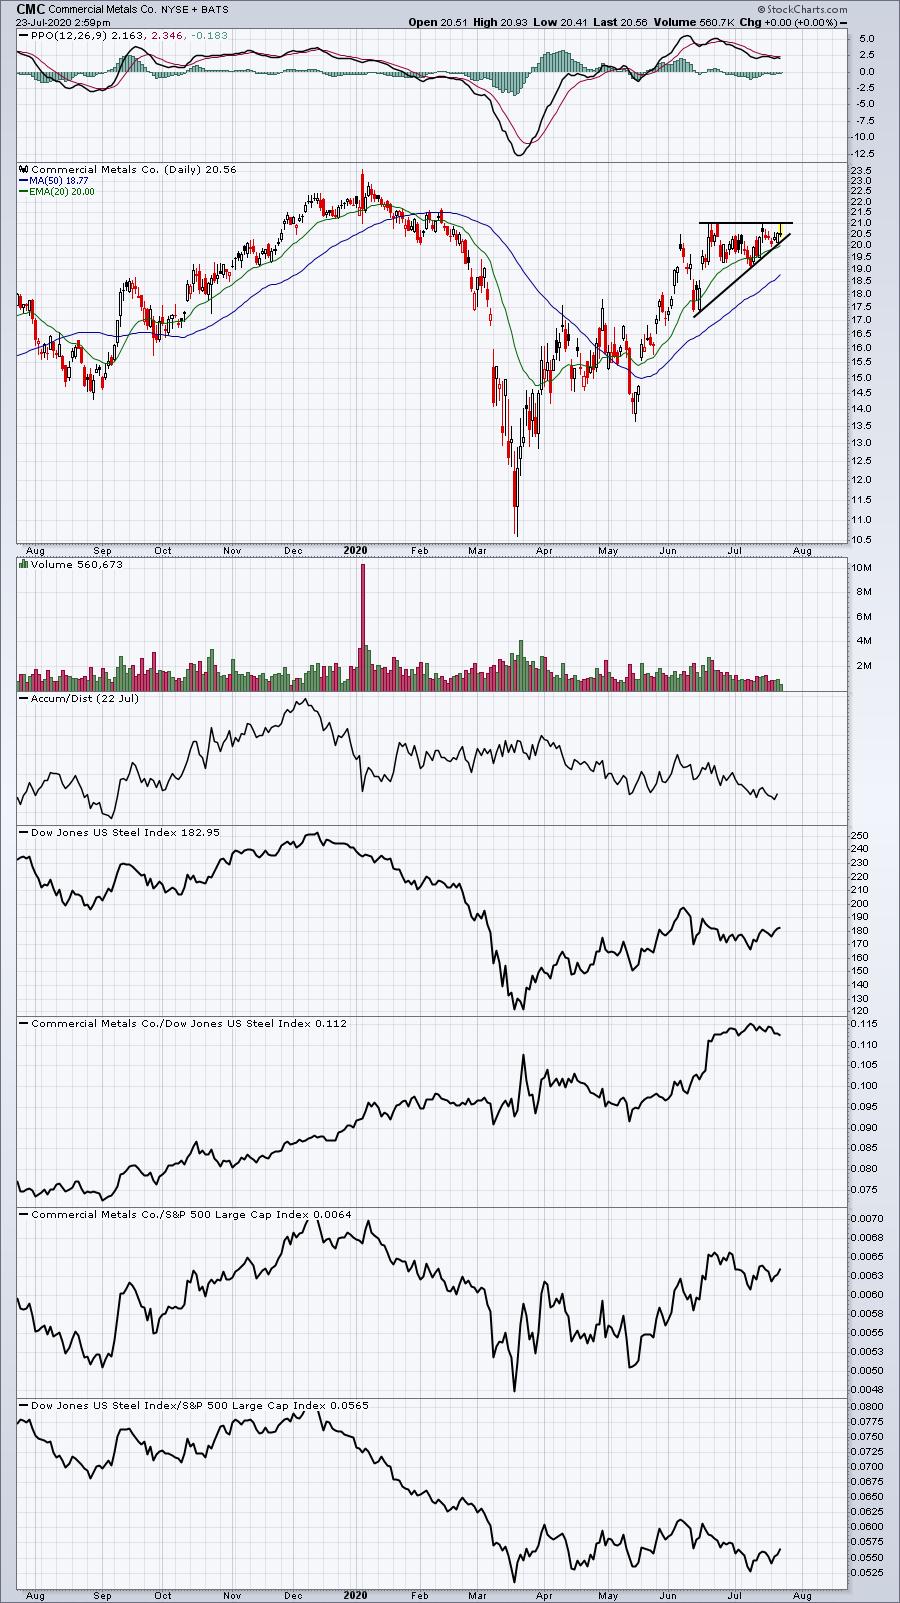
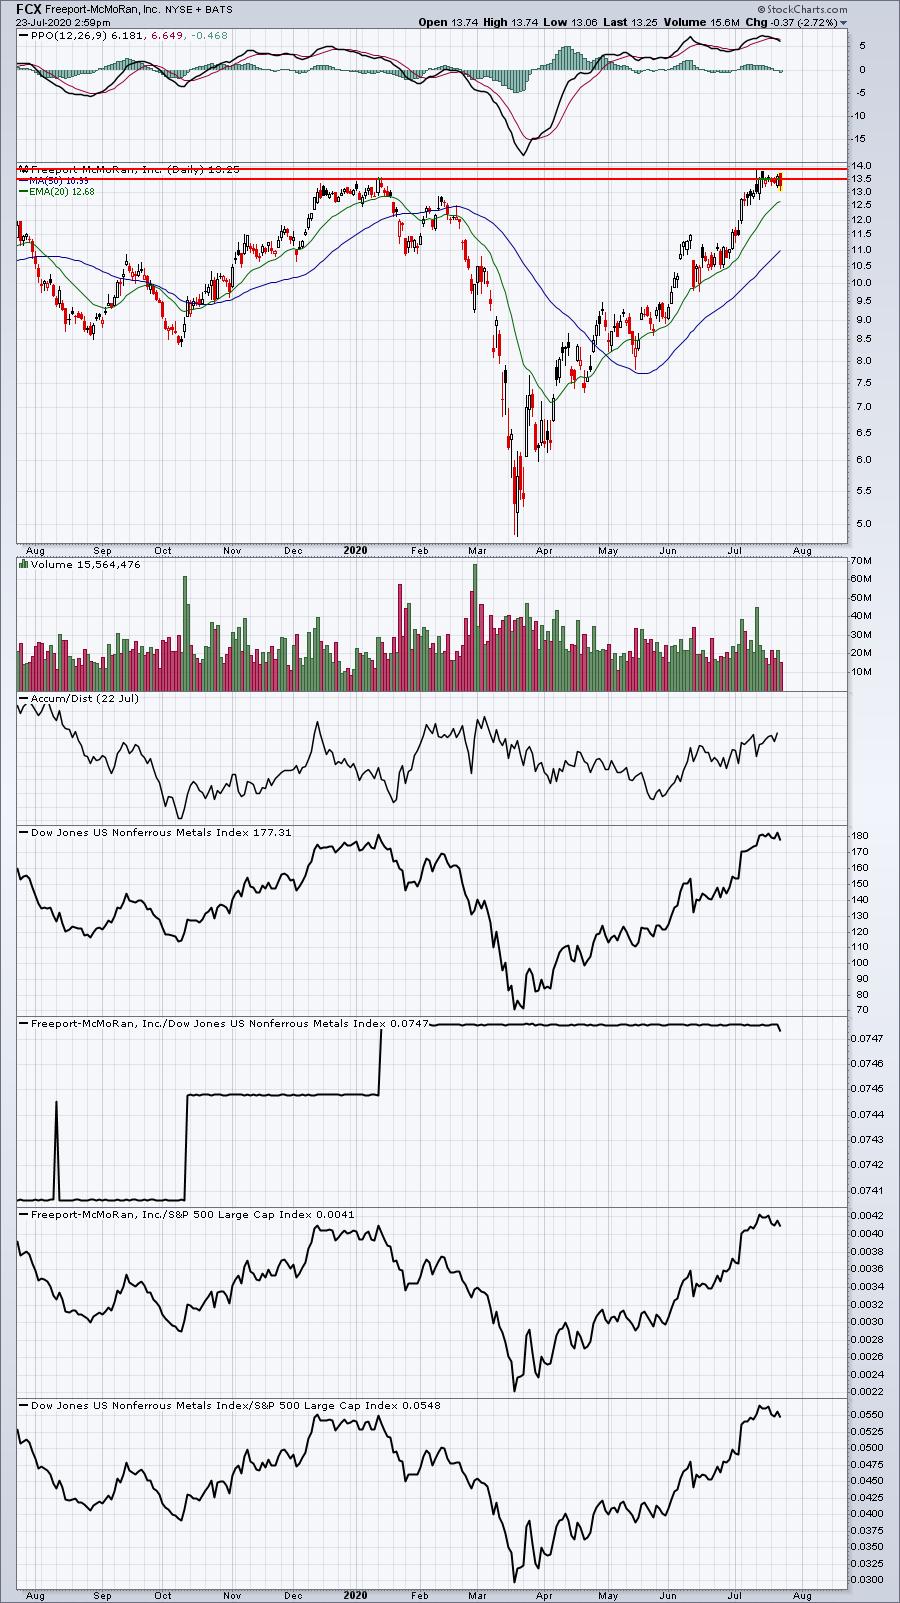
As the dollar (UUP) weakens further today, the U.S. Dollar Index ($USD) falls closer and closer to a major 9-year trendline support level. Should that support break, the recent rotation into materials (XLB) would likely accelerate. We can look to our various ChartLists for trading ideas within this space. If you decide to trade this sector, you must realize that the bullishness could change quickly and you don't want to hold long if the recent rotation trend reverses. In other words, make sure you keep stops tight. It's also meaningful to catch breakouts very close to their initial breakout point in order to minimize downside risk. With all of this in mind, I scoured our ChartLists looking for materials stocks that could interest us:
CMC:
FCX:
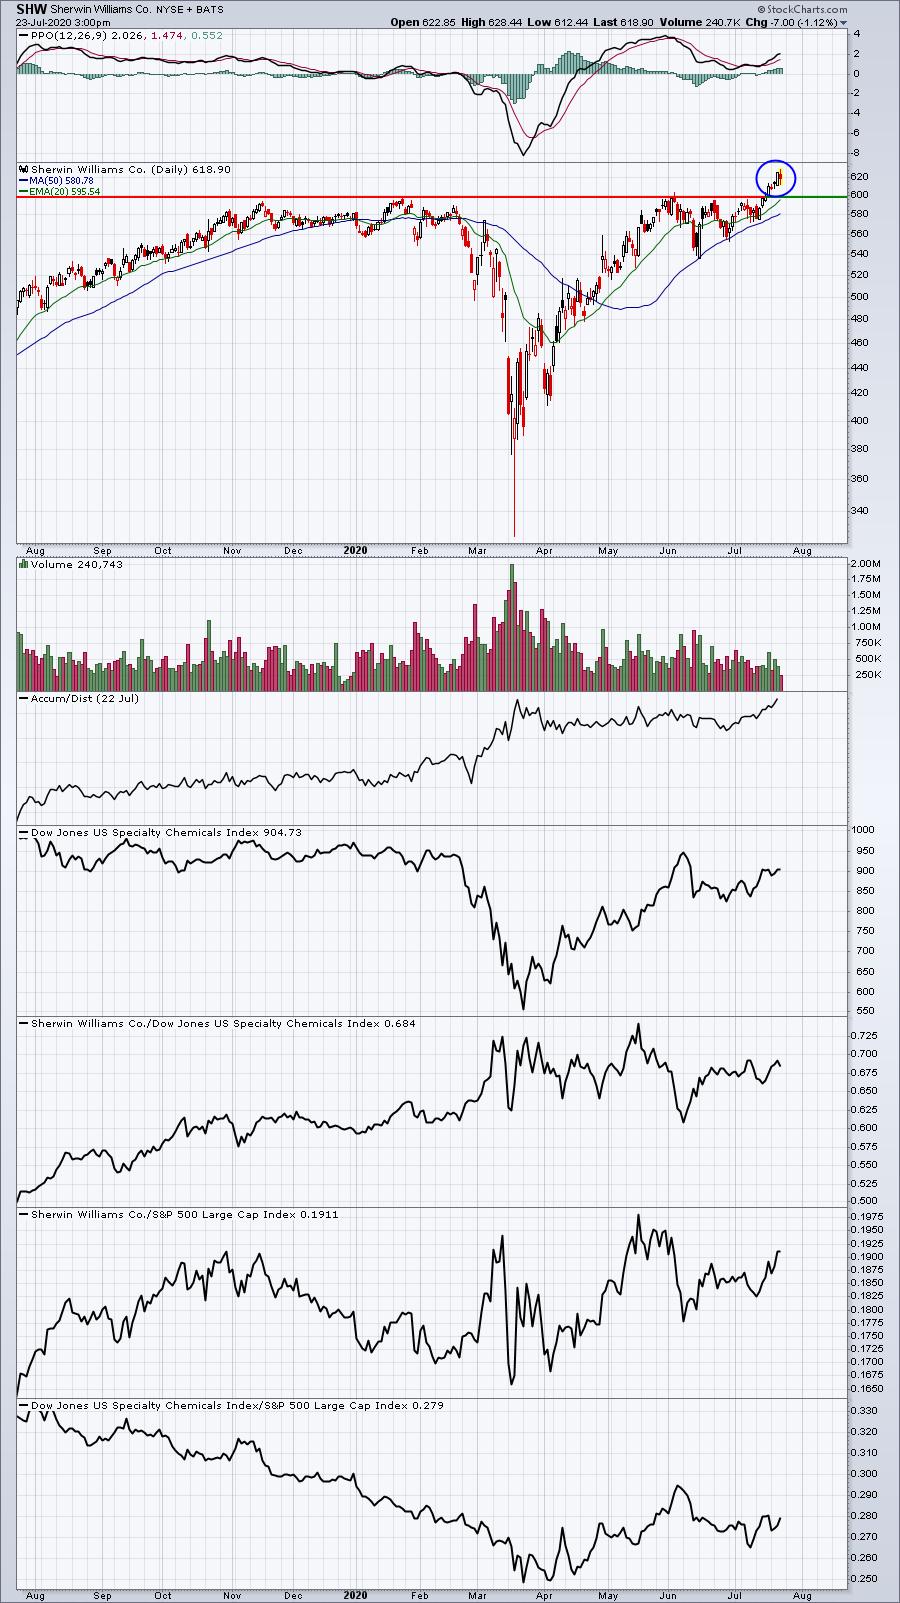
SHW:
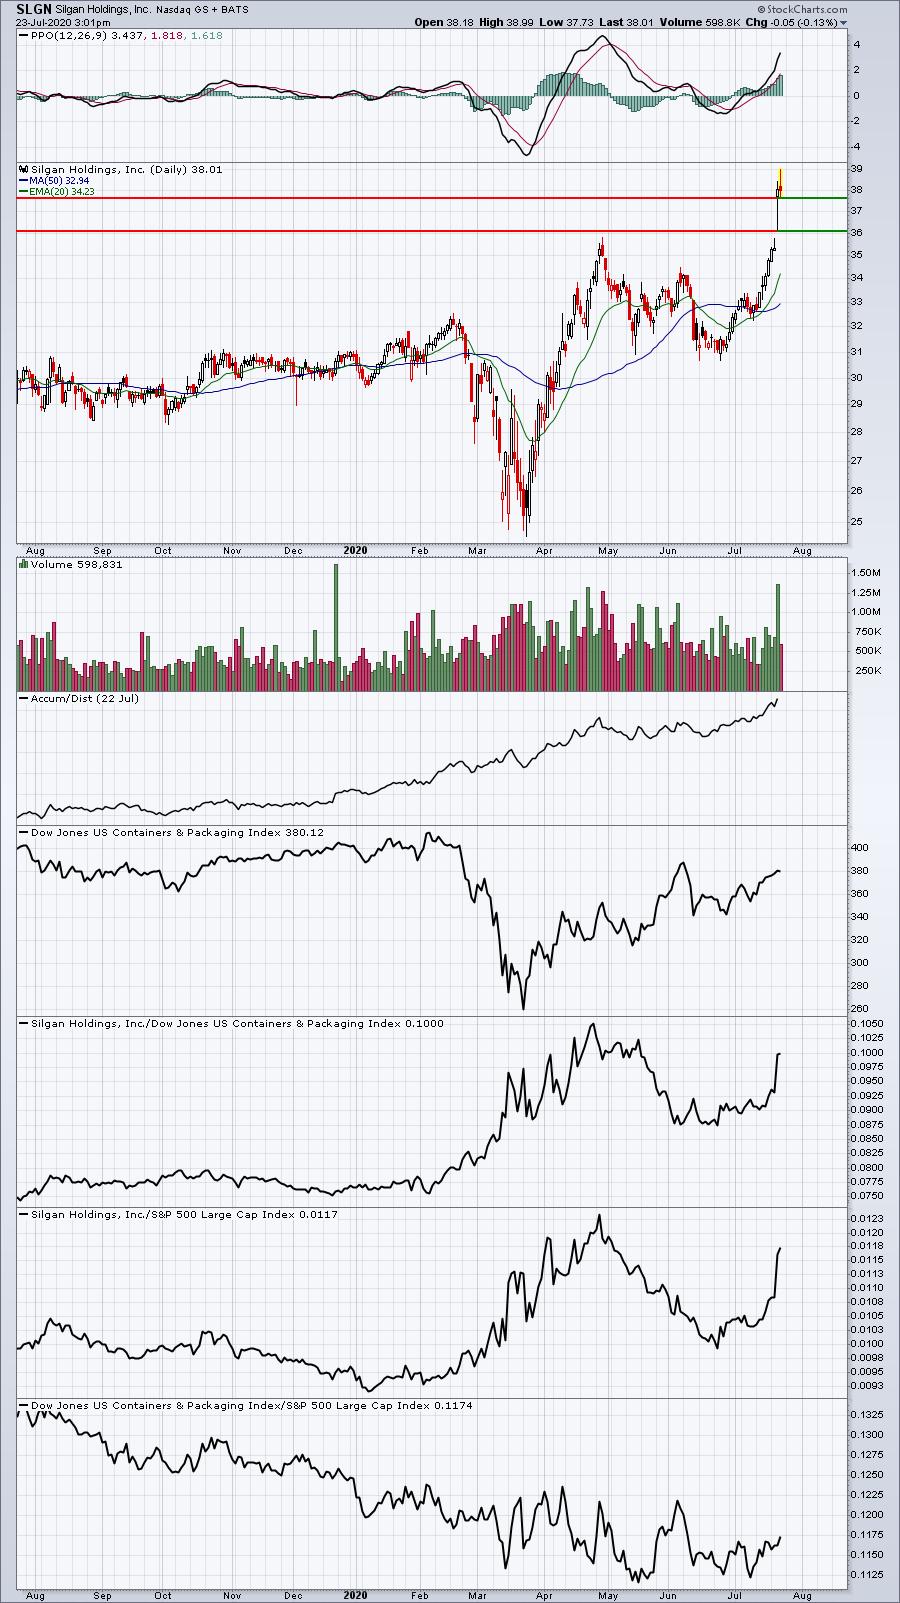
SLGN:
UNVR:
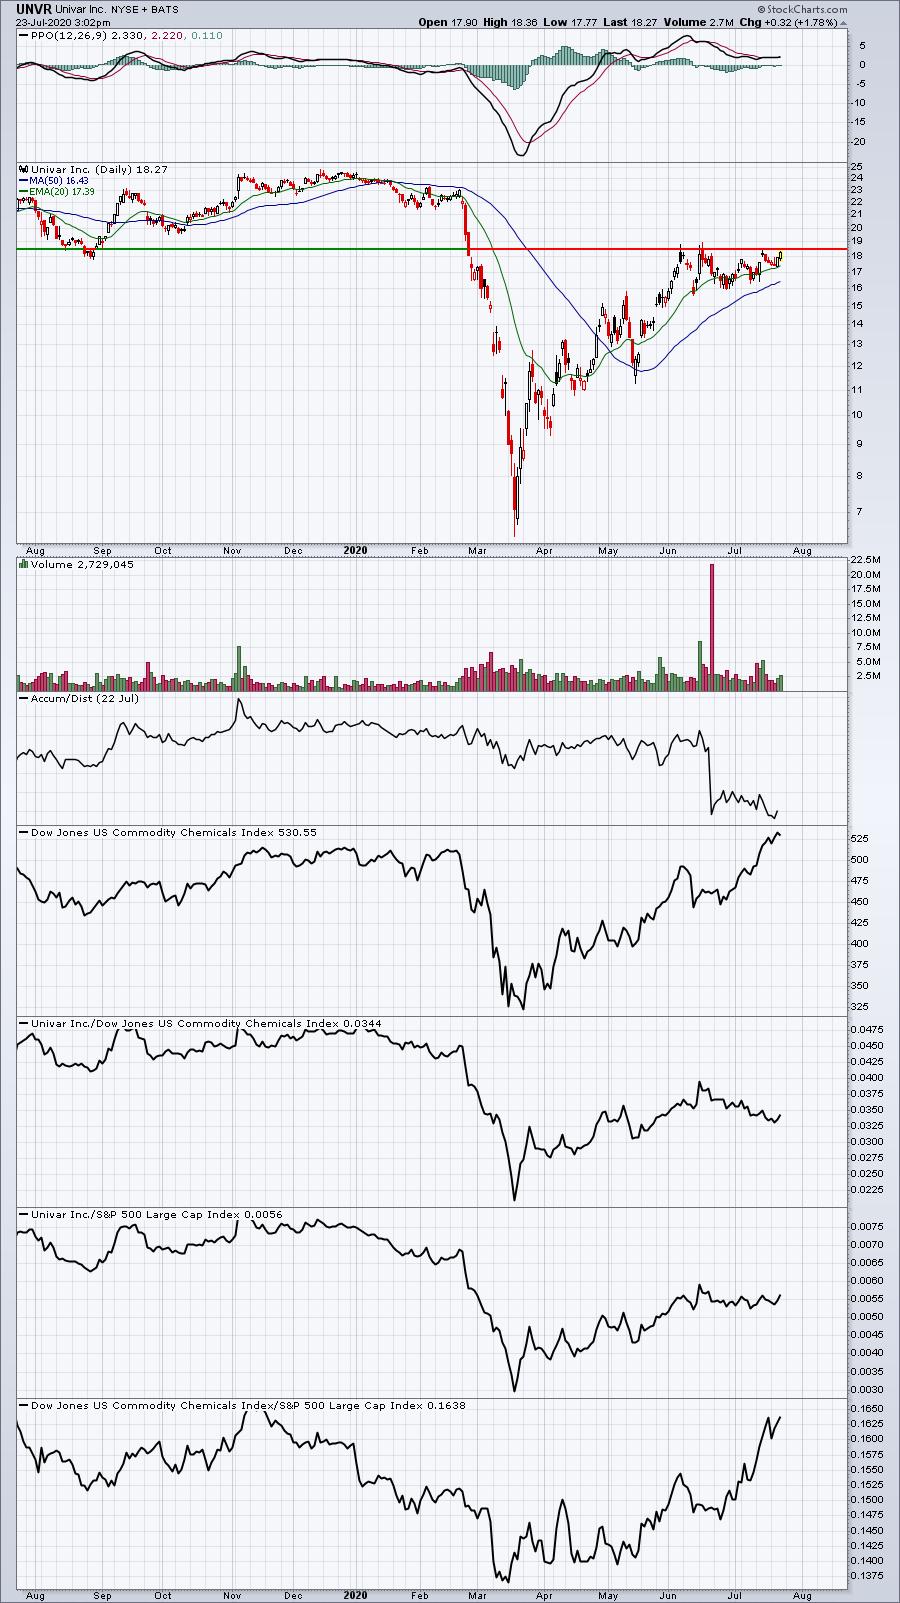
These are all stocks either prepping for a possible breakout or having just seen a breakout. I prefer SLGN and SHW since they've already made their breakouts, but the others seem poised to follow suit. All of these stocks should now have strong support at their rising 20 day EMAs.
Earnings Reports
Here are the key earnings reports for today and tomorrow, featuring stocks with market caps of more than $10 billion. I also include a few select companies with market caps below $10 billion. Finally, any portfolio stocks (or active trade alerts) that will be reporting results are highlighted in BOLD. If you decide to hold a stock into earnings, please understand the significant short-term risk that you are taking. Please be sure to check for earnings dates for any companies you own or are considering owning:
Thursday, July 23:
INTC, T, DHR, UNP, APD, KMB, EW, BX, DOW, TRV, TWTR, CTAS, STM, HSY, VRSN, SWKS, FE, CTXS, FCX, WST, GWW, CMS, DGX, LUV, TSCO, FITB, IEX, MTB, NUE, POOL, ETFC, SIVB, PHM, ENTG, MANH, RHI, AAL, SKX, AN, MAT, EHTH, MXL, GTLS
Friday, July 24:
VZ, NEE, HON, AXP, SLB, FMX, SHG, GNTX, CRI, TPH, BLMN
Economic Reports
Initial jobless claims: 1,416,000 (actual) vs. 1,308,000 (estimate)
June leading indicators: +2.0% (actual) vs. +2.5% (estimate)
Happy trading!
Tom