
EB Daily Market Report - Thursday, July 30, 2020
Executive Market Summary
- Despite a number of strong earnings reports, futures are lower this morning
- Dow futures are lower by nearly 300 points, but all our major indices are showing a loss of perhaps 1%
- Commodities are lower, including crude oil ($WTIC), which is down by more than 2.5% this morning
- The 10 year treasury yield ($TNX) is falling another 4 basis points to 0.55%; this will likely pressure the dollar further
- At the opening bell, the Dow fell over 300 points, but we've seen early relative strength in the NASDAQ
- Energy (XLE, -3.03%) is very weak to start the day, as is the financials group (XLF, -1.98%); the latter is doubt being hurt once again by falling treasury yields
- Q2 GDP was released this morning and showed exactly what everyone expected - a dismal quarter and a drop of more than 33% (slightly better than forecast)
- Energy stocks are hurting the Dow; however, Apache (APA, +18.42%) is the best performing S&P 500 stock
- QCOM, UPS, QRVO, HOLX, CTSH, PYPL, and ORLY were winners from quarterly earnings reports
Market Outlook
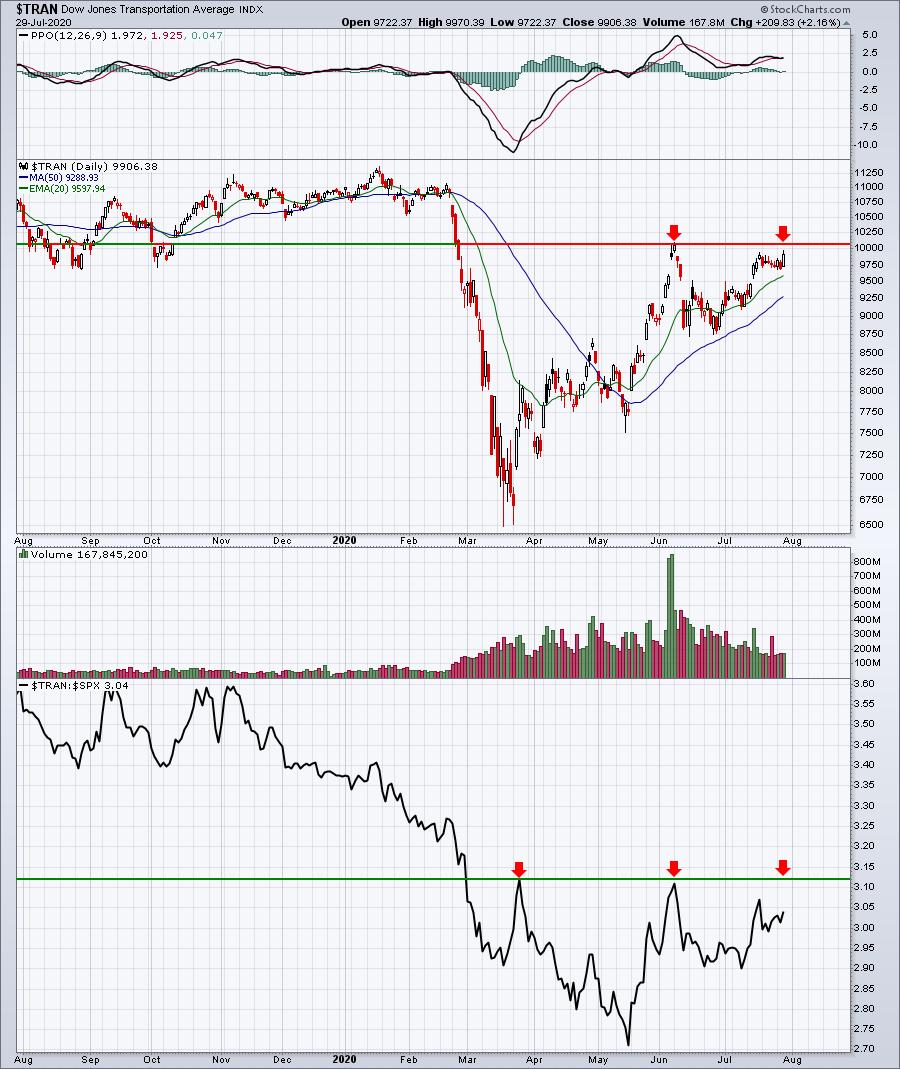
I'm keeping a close eye on transports ($TRAN) in terms of evaluating the sustainability of the current stock market advance. A strong transportation group almost always results in a strong stock market, because transports only go up for one of two reasons - either a strengthening economy or the anticipation of a strengthening economy. There's no doubt that the TRAN's relative strength has been weak, mostly because of airlines ($DJUSAR), but an absolute breakout could get things jumpstarted:
Truckers ($DJUSTK) have already broken out and are showing leadership, so the fate of the group overall likely comes down to the railroads, whose chart looks quite similar to the TRAN:
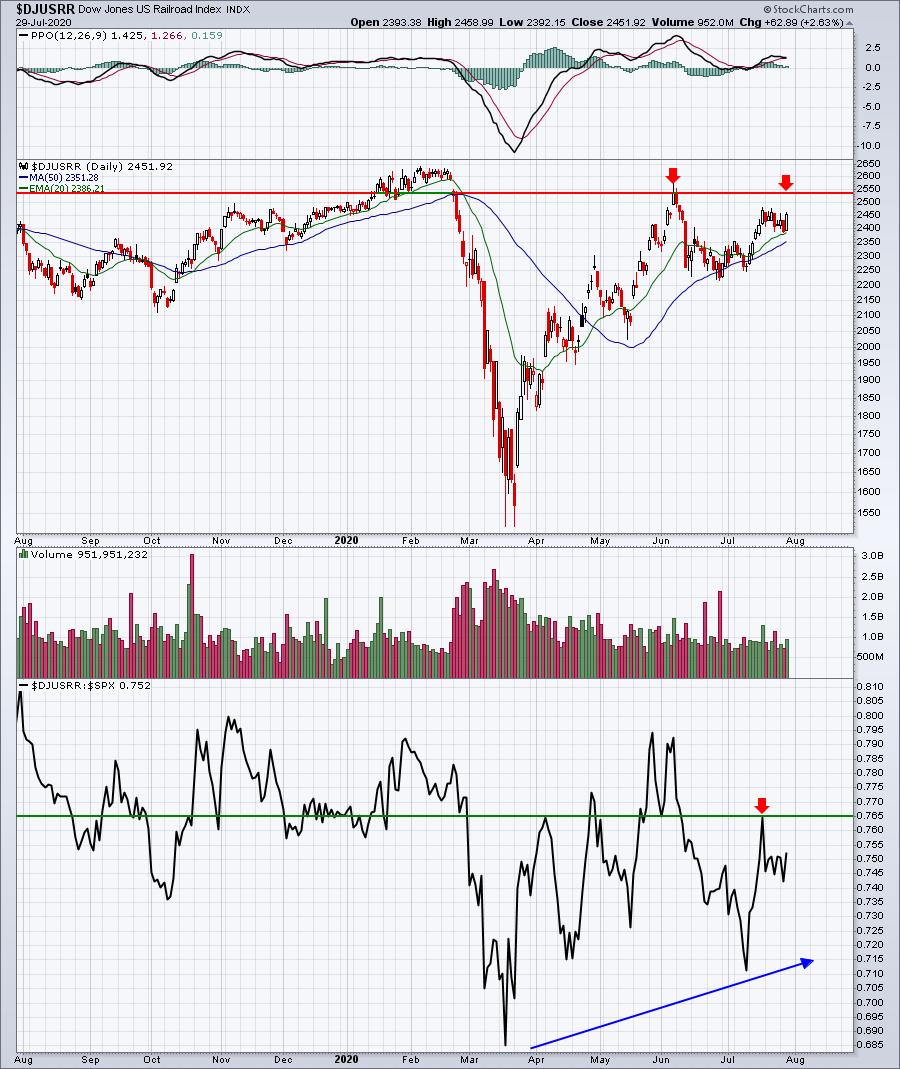
The relative strength of the DJUSRR is definitely stronger, though not strong by any stretch. But the absolute chart looks somewhat similar with the June closing high the immediate obstacle.
Sector/Industry Focus
The Dow Jones U.S. Specialized Consumer Services Index ($DJUSCS) gained 4.15% on Wednesday to clear its June closing high. Volume accelerated on this advance, which bodes well in the future. The rising 20 day EMA would represent the best buying opportunity in the group as its PPO is now rising off centerline support, which suggests accelerating bullish momentum:
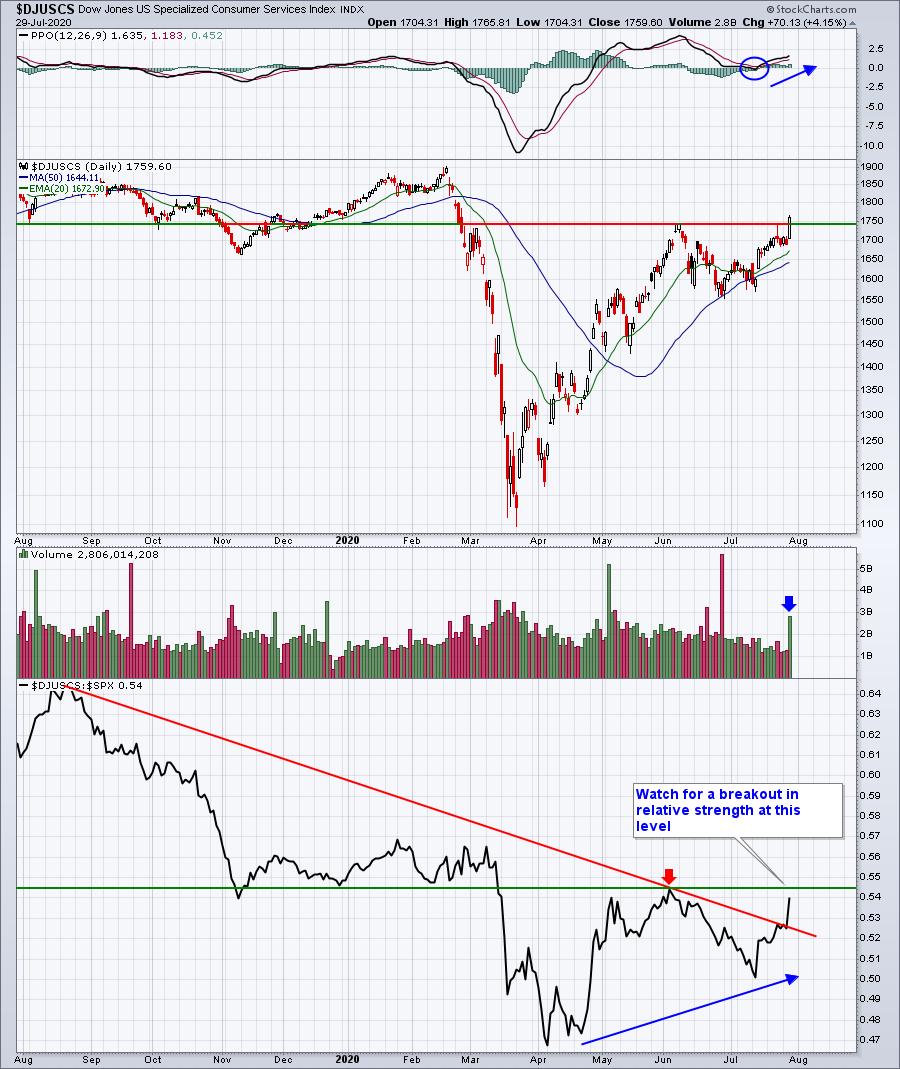
Stocks like K12 (LRN), Etsy Inc (ETSY), eBay Inc (EBAY), and Angie's List (ANGI) have been leading the charge. After its latest earnings report and positive reaction yesterday, we can add Aaron (AAN) to this list.
ChartLists
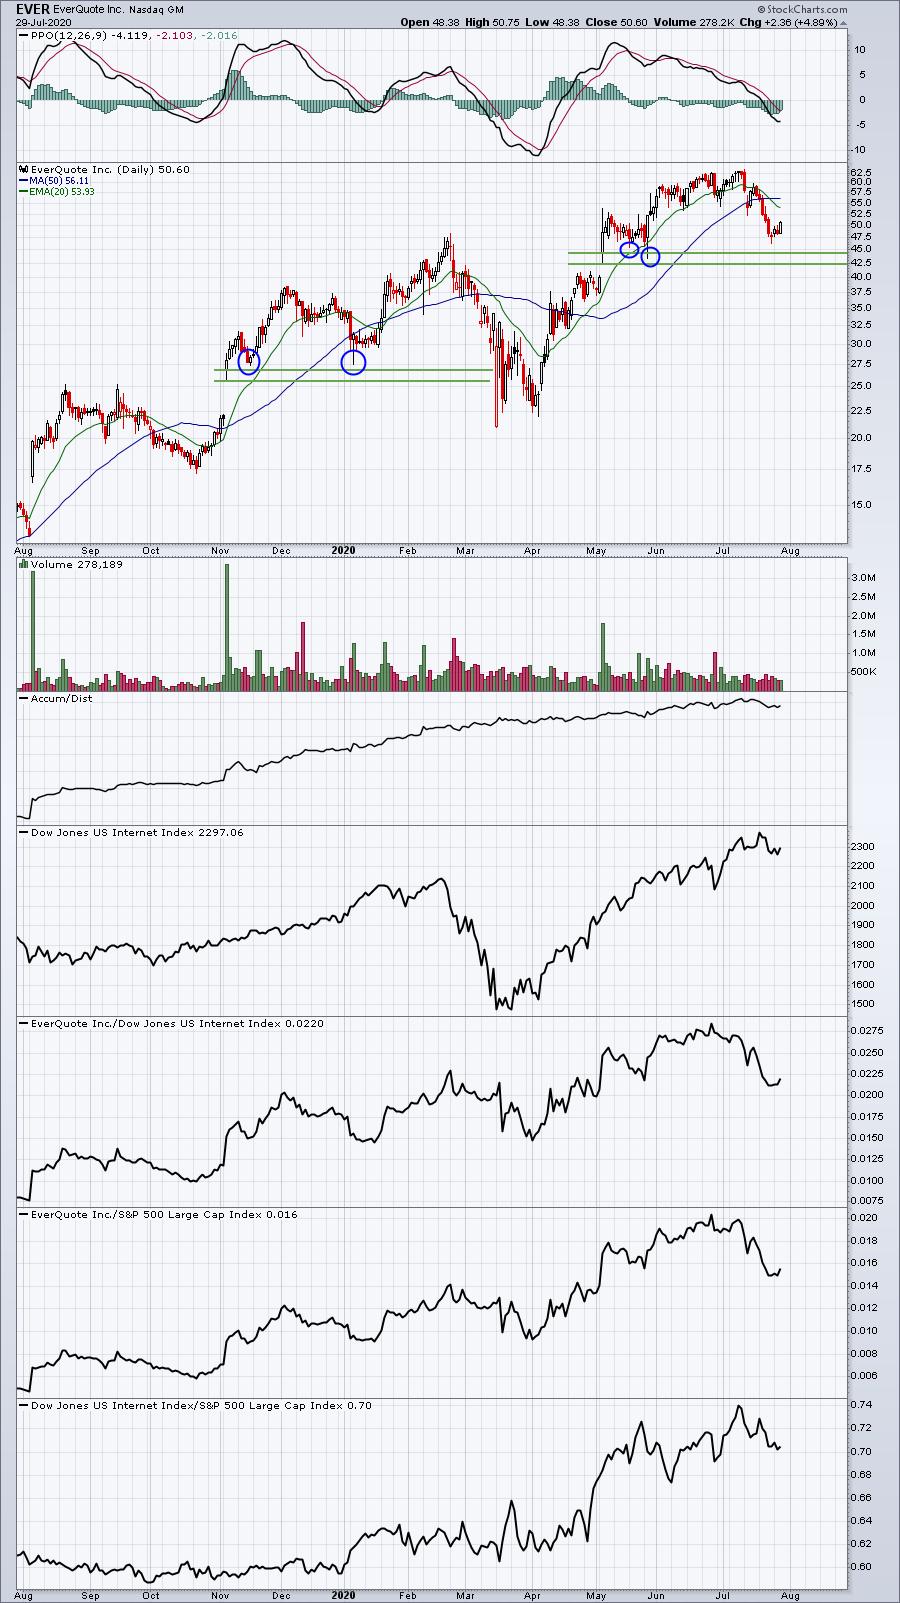
If you're fairly new to EarningsBeats.com, or even if you've been around awhile, you may not understand how I view gaps and how I like to trade gaps. First and foremost, I rarely chase a gap higher at the opening bell. The reason is simple - after the gap, I have no idea which direction a stock will move. Normally, a gap higher will result from good news and there's an imbalance between buy orders and sell orders. Market makers see that imbalance and set higher prices at the opening bell. As buyers rush in at the opening bell, market makers have the duty to provide liquidity. In other words, they are fully prepared to take the other side of the trade and sell short. A "gap fill" occurs when a stock that opens higher later returns to the prior day's closing price. Sometimes it happens in minutes, sometimes hours, sometimes days or weeks. Sometimes it doesn't happen. But the "gap fill" is what I expect since market makers are on the short side and they make money much more often than they lose it. However, in those less common instances when a stock gaps higher and continues to rise, that's a fairly strong indication of the overwhelming demand of a stock. Market makers essentially give up on their short positions because of that demand and join the fray by covering their short positions. The day ends with a very bullish hollow candle on heavy volume and the top of the gap becomes critical support. EverQuote (EVER) shows two such instances in the past year:
But the more common look is when a stock does return to that prior open after gapping higher. As an example, let's look at Air Transport Services Group (ATSG) after its last earnings report in May. It gapped 7-8% higher, but 8 days later returned to that previous close (gap fill):
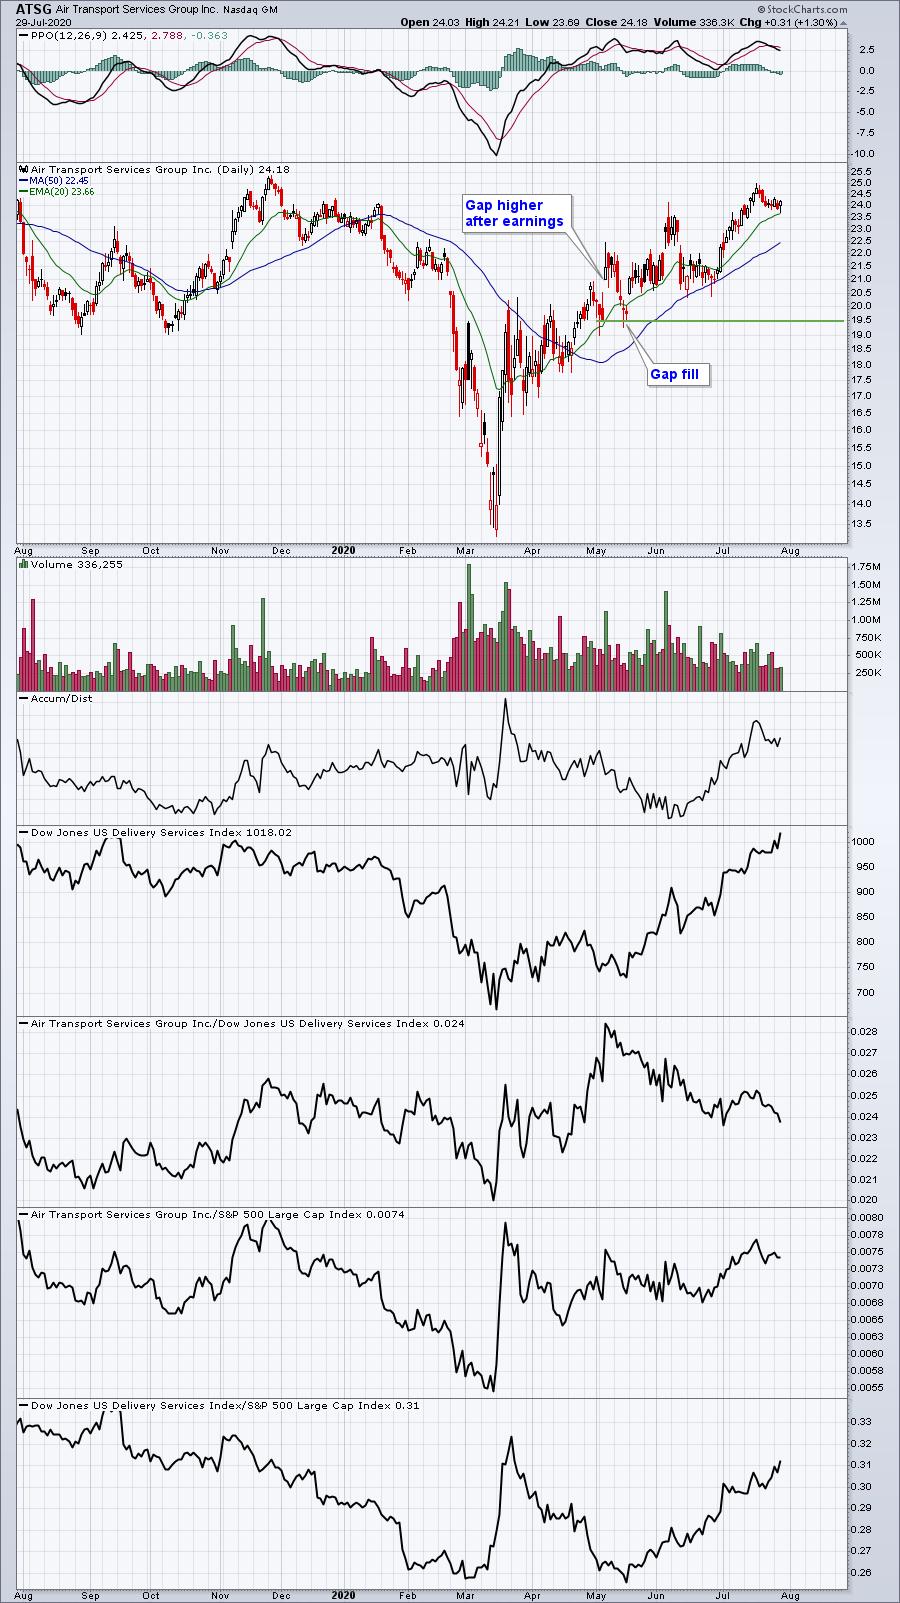
This was a perfect "fill". Trading the ATSG from the bottom of gap support was a solid reward to risk trade. Right after earnings, ATSG moved quickly to 22, so buying at gap support at 19.50 would have resulted in perhaps a two week trade where ATSG returned to 22. That's a 13% return in a very short period of time. The whole idea of us keeping ChartLists to identify these opportunities and to take advantage of the short-term inefficiencies in the stock market. We're not trying to unlock the long-term potential or value of a stock. We're honestly trying to mock, to some degree, the role of the market maker. Buy when others want to sell and sell when others want to buy. Most retail traders buy and sell based on emotion. We want to do the opposite.
Earnings Reports
Here are the key earnings reports for today and tomorrow, featuring stocks with market caps of more than $10 billion. I also include a few select companies with market caps below $10 billion. Finally, any portfolio stocks (or active trade alerts) that will be reporting results are highlighted in BOLD. If you decide to hold a stock into earnings, please understand the significant short-term risk that you are taking. Please be sure to check for earnings dates for any companies you own or are considering owning:
Thursday, July 30:
AAPL, AMZN, GOOGL, FB, PG, MA, CMCSA, LLY, AZN, LIN, RDS.A, AMT, BUD, UPS, GILD, SYK, VRTX, CI, MMC, SO, NEM, MCO, MELI, ICE, NOC, BAX, WM, TAL, KDP, COP, KHC, TRP, DD, DLR, EA, XEL, SGEN, F, WLTW, FMS, SIRI, XLNX, SWK, K, VLO, ALXN, CARR, TEAM, ODFL, MTD, APTV, AJG, FTS, TFX, PCG, BIO, MAS, HIG, ATUS, IP, EXAS, KL, XYL, GPC, TW, APO, EXPE, MT, ZEN, QDEL, MOH, DVA, CNHI, MPW, CG, GNRC, XPO, MGM, FND, RGEN, GRUB, TNDM, DECK, DNKN, RDFN, TPX, BAND, TMHC, TWOU, CROX, FORM, EGO, SHAK, X
Friday, July 31:
MRK, XOM, CVX, ABBV, CHTR, CAT, D, CL, ITW, TAK, AON, LHX, IDXX, ES, PSX, JCI, PEG, NOK, VFC, LYB, TU, CHD, FCAU, WY, PINS, CBRE, IMO, WPC, BAH, ASX, CBOE, SNA, NWL, UAA, ITT, GT, SPB
Economic Reports
Q2 GDP - initial estimate: -32.9% (actual) vs. -35.0% (estimate)
Initial jobless claims: 1.43 million (actual) vs. 1.39 million (estimate)
Happy trading!
Tom