
EB Daily Market Report - Wednesday, August 5, 2020
Executive Market Summary
- Futures were surging this morning, but did pull back after a weaker-than-expected ADP employment report
- The Dow Jones and the S&P 600 Small Cap indices are today's leaders
- Walt Disney (DIS, +10.73%) is easily the best performing Dow Jones stock and it's the 2nd best S&P 500 company, trailing only Assurant (AIZ, +14.97%)
- Silver ($SILVER, +3.12%) and gold ($GOLD, +1.81%) are continuing their recent surge
- Crude oil ($WTIC, +3.41%) has moved above $43 per barrel, its highest level since the first week of March
- The 10 year treasury yield ($TNX) is up 4 basis points to 0.55% in hopes of a stimulus deal later in the week
- Global markets are mostly higher as the worldwide bull market advance kicks into gear
- Materials (XLB, +2.18%) and energy (XLE, +1.54%) are the big winners as the U.S. dollar reaches its lowest level in more than two years; the February 2018 low looks like its next major target
Market Outlook
I'm going to start with a reprint of a chart that I highlighted in our July 20th DMR:
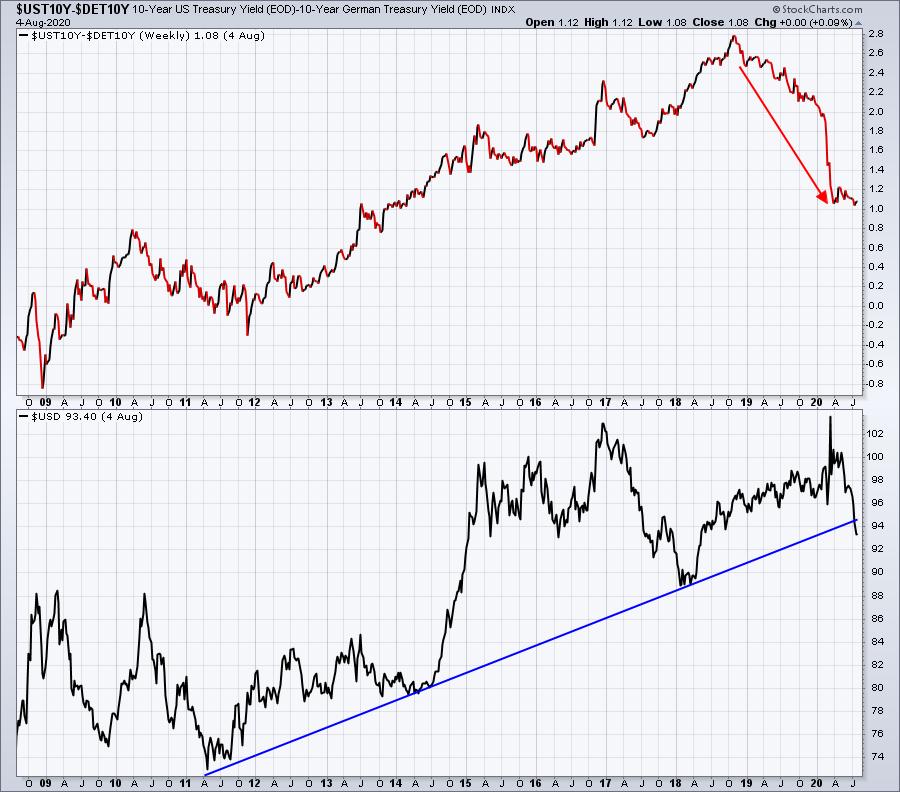
The biggest differences between now and two weeks ago are: (1) the U.S. Dollar Index ($USD) trendline has seen a definitive breakdown and (2) the U.S treasury yield vs. the German treasury yield has set a new low. I was waiting for both of those developments before turning more bullish on materials. Could this still be a head fake? Sure, but doesn't mean we don't want to begin looking for opportunities in this area of the market. Just keep stops in place in the event we do see a reversal.
Sector/Industry Focus
I still favor many of the same sectors and industry groups that I've been discussing the past several months, but it's not unusual for many of these areas of the market to pause over the summer months. As the U.S. Dollar (UUP) resumes its decline today, and clears the previous low set just last week, I now view materials (XLB) as a sector to consider for trades and, potentially, inclusion in our upcoming portfolio selections. I like to let the BIG PICTURE drive my decision-making. First of all, if materials are beginning a multi-year period of relative strength, I don't care if I'm a few months behind in establishing positions. This is the first time in NINE years that we've seen materials outperforming the S&P 500 AND the U.S. Dollar in a confirmed downtrend. Perhaps the dollar rallies from here and changes everything, but the chart shown above does not suggest that. I wouldn't rush into anything too quickly, however. I see commodity chemicals ($DJUSCC) as the absolute best industry group within materials:
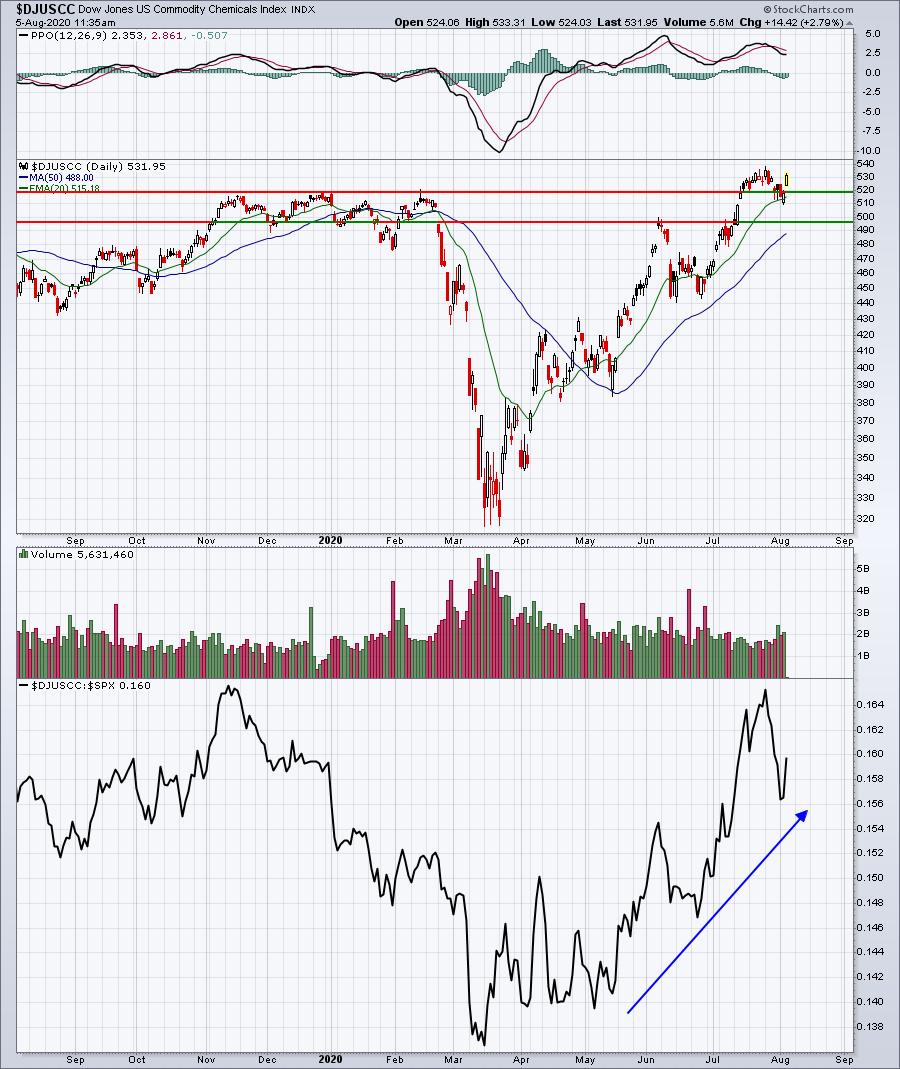
We've even seen a relative pullback in this industry over the past couple weeks.
Nonferrous metals ($DJUSNF) would be the other solid industry group in materials:
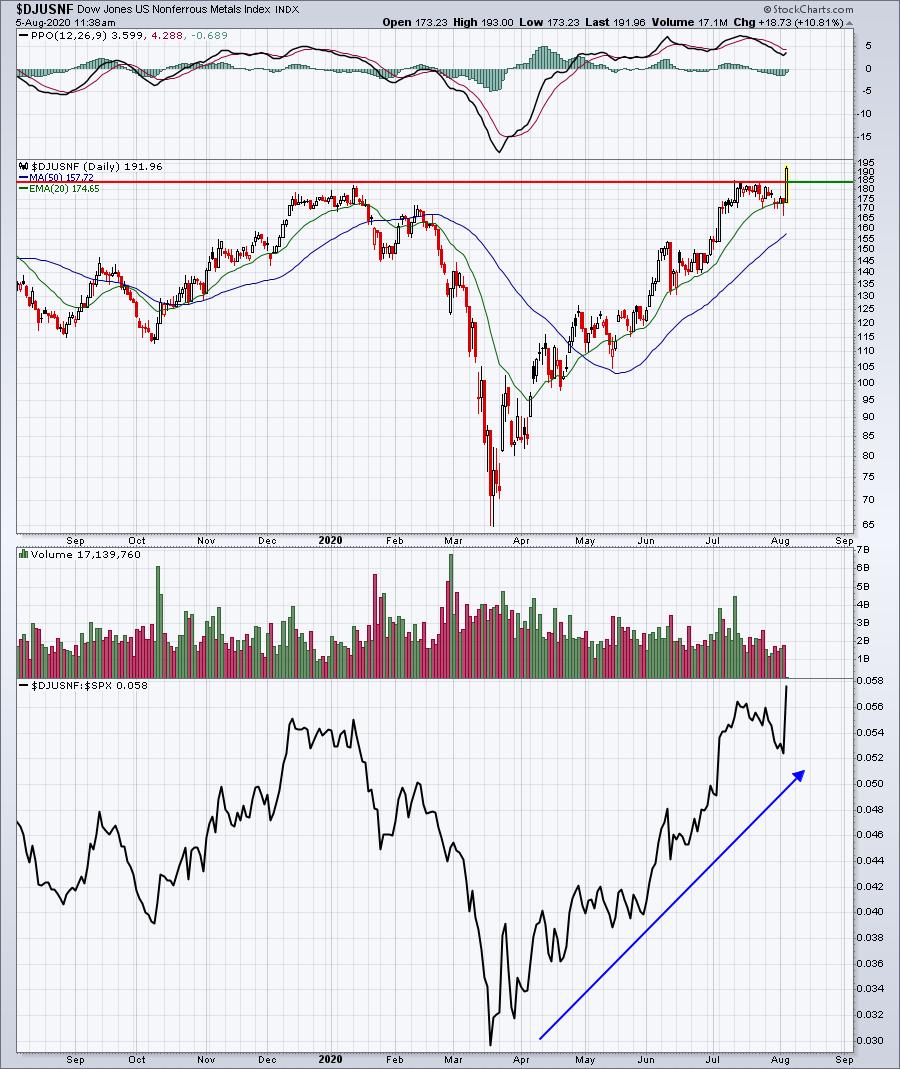
Remember, stick with the leaders. I had an email from a member recently that suggested we had failed to participate in materials' rally. Hhhhmmmm. It is true that we haven't had a materials stock in our Model Portfolio, but look at the performance there. We don't try to time when sectors or industries will begin to lead. We wait until they actually lead. These are BIG PICTURE themes that we need to see first and understand. How much money would we have lost over the last 9 years waiting for materials and energy to become leaders?
Stick with what's working, BUT be open to the possibilities of rotation. That's all we can try to do.
ChartLists
More and more materials and energy stocks have been added recently to our Strong Earnings ChartList (SECL). Why? It's simple. Many are beginning to beat earnings expectations and show much more relative strength. Even those that didn't report strong earnings will likely find themselves on our next Strong Future Earnings ChartList (SFECL), which should be updated in the next 1-2 days, as relative strength is building. I mentioned two industry groups above in the materials sector that I'd consider trading. Here's one candidate to ponder off of our SECL:
LIN:
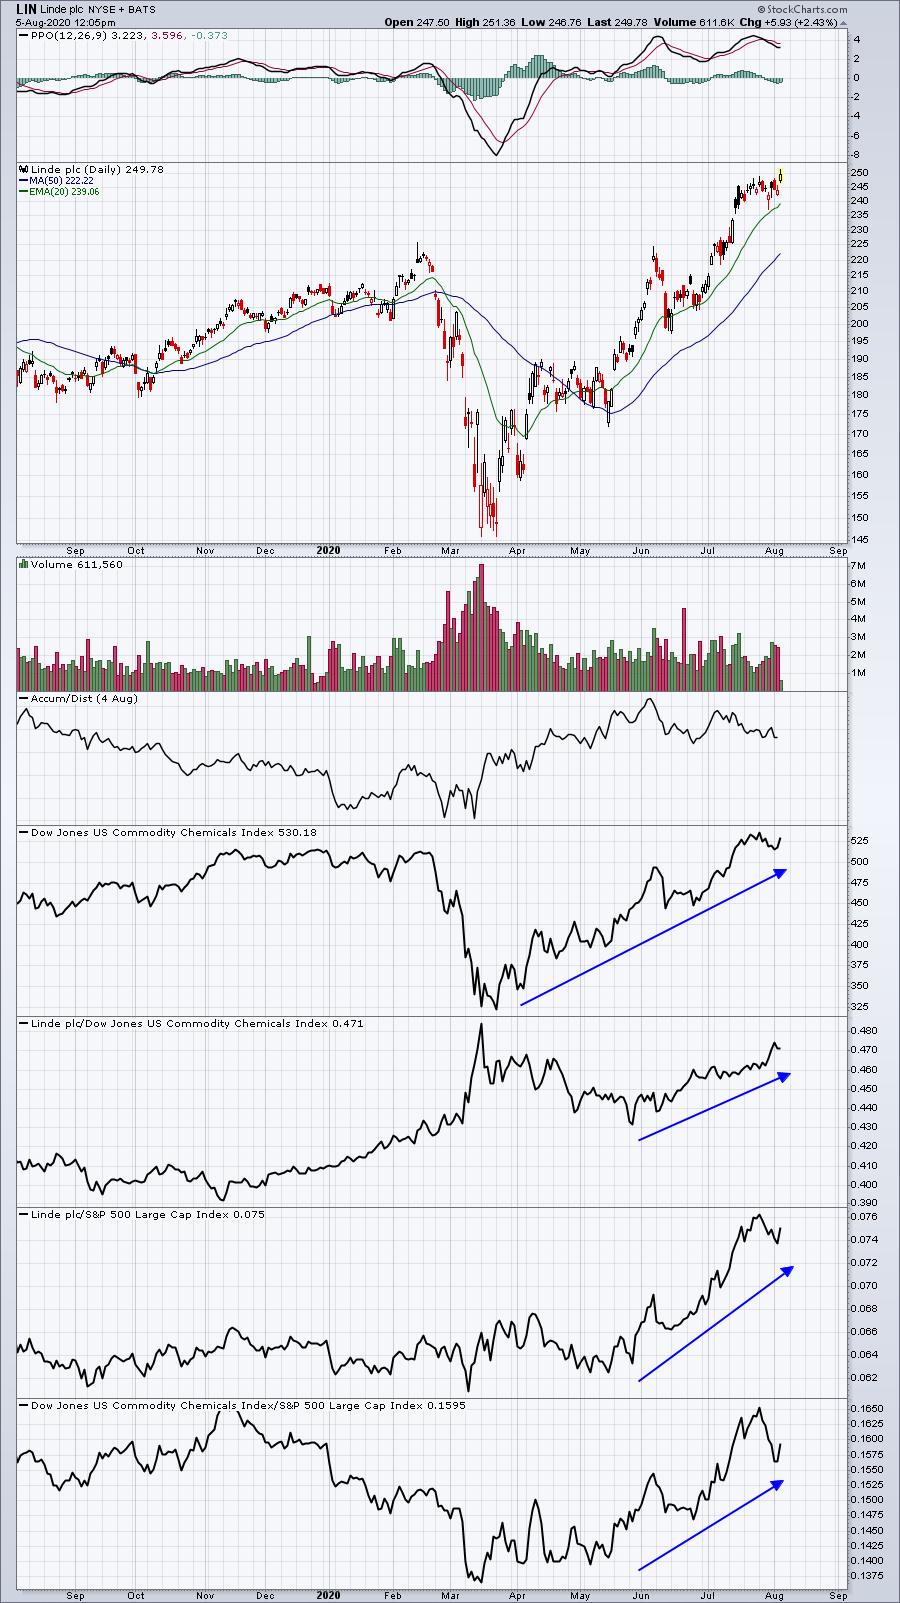
Jumping into LIN at this exact moment may not be the best move, but LIN is a very solid company in the commodity chemicals ($DJUSCC) area. 20 day EMA tests have been the best entry points.
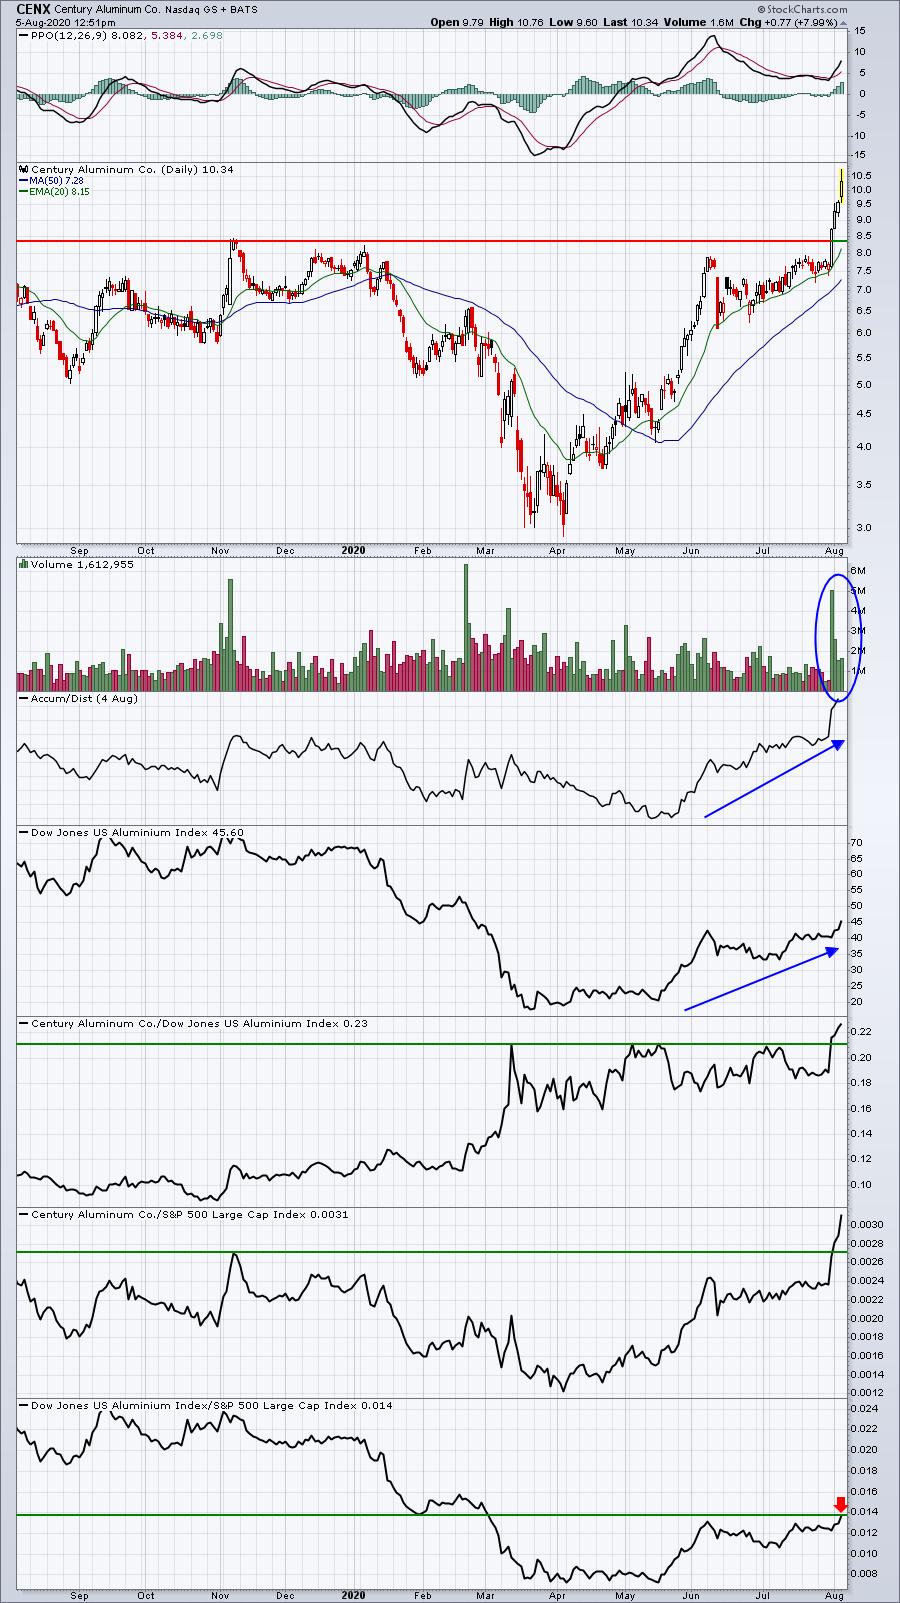
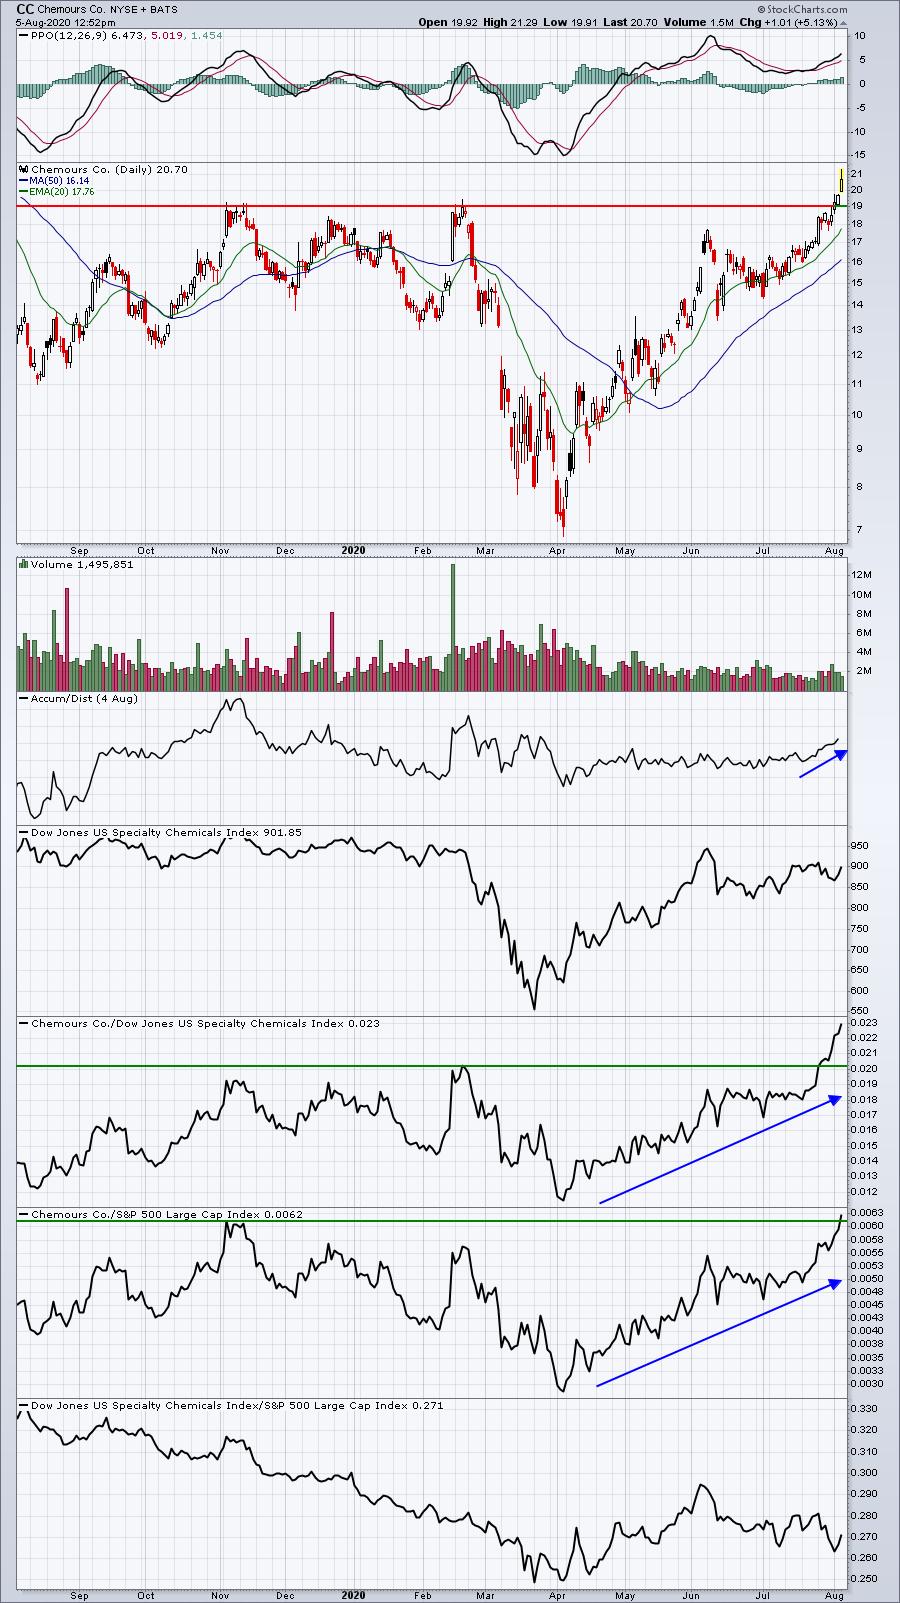
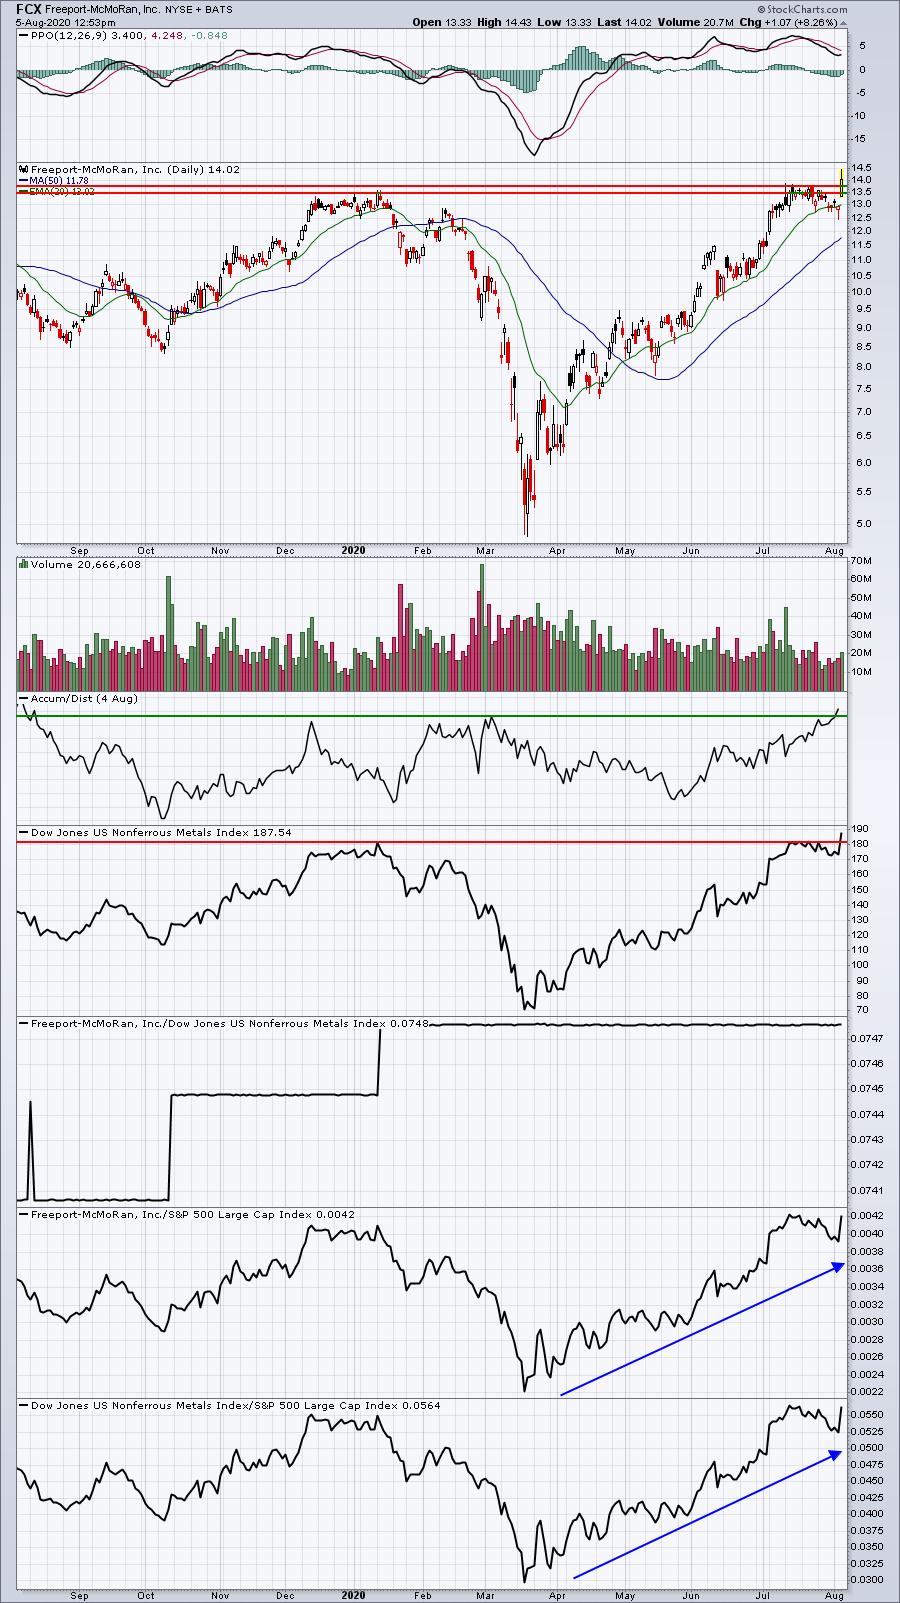
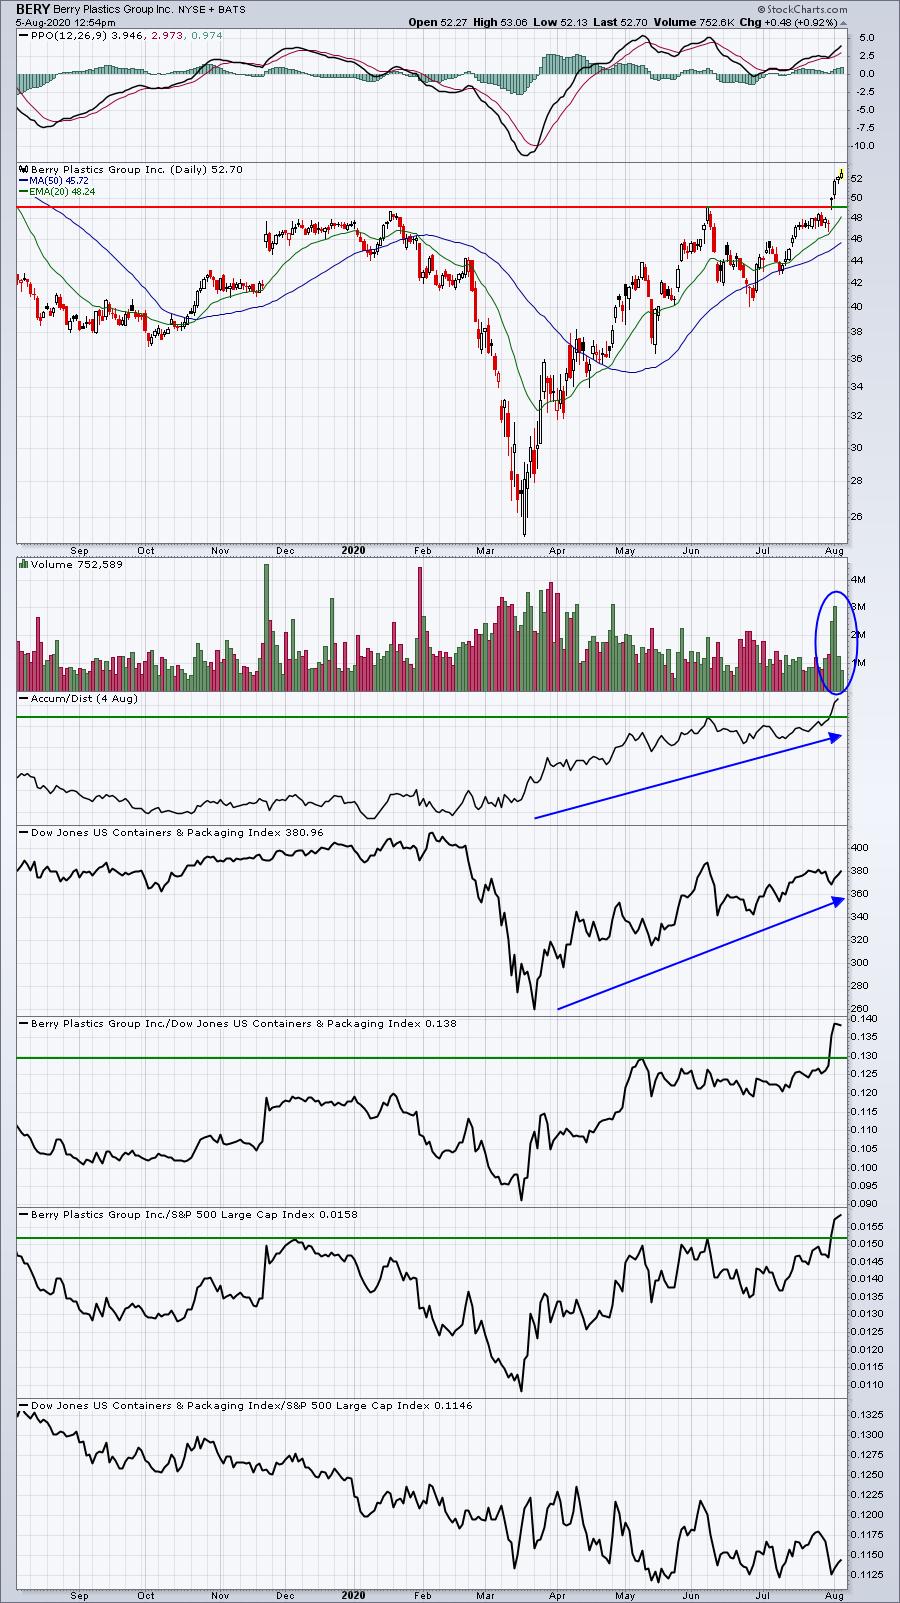
There will be many more companies in materials that will likely join our SECL in upcoming months. Many of those will likely be included on our next updated SFECL, including these four that have or are breaking out:
CENX:
CC:
FCX:
BERY:
And then there's one more on the verge of breaking out:
TROX:
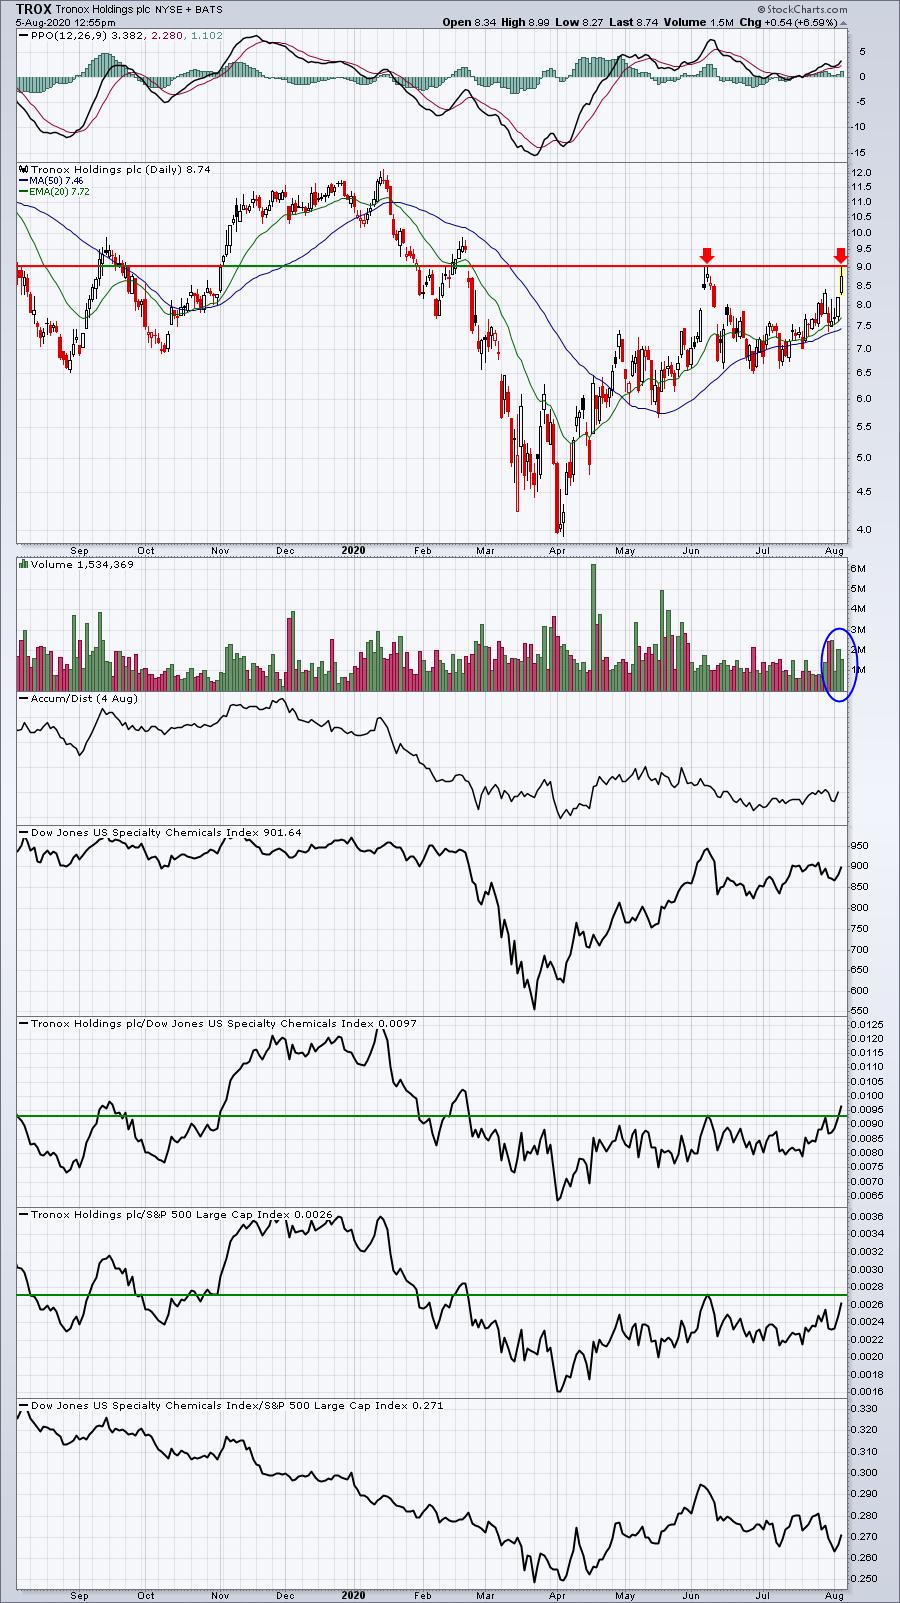
Outside of TROX, these stocks are showing leadership qualities. So if materials continues its recent relative strength, this is most definitely a group of stocks to watch.
Earnings Reports
Here are the key earnings reports for today and tomorrow, featuring stocks with market caps of more than $10 billion. I also include a few select companies with market caps below $10 billion. Finally, any portfolio stocks (or active trade alerts) that will be reporting results are highlighted in BOLD. If you decide to hold a stock into earnings, please understand the significant short-term risk that you are taking. Please be sure to check for earnings dates for any companies you own or are considering owning:
Wednesday, August 5:
CVS, REGN, FISV, SQ, HUM, HMC, SRE, PSA, TRI, MET, FNV, RMD, MRNA, AWK, ANSS, CVNA, MFC, W, WELL, CTVA, ABC, ROKU, ET, CDW, EVRG, ETSY, ATO, WDC, TEVA, BIP, SRPT, GDDY, HZNP, CDAY, TRMB, WTRG, RE, DISCA, CTL, HUBS, LYV, FSLY, CRL, IMMU, ZNGA, ALB, DOX, NUAN, BWA, OHI, PRGO, CF, WEN, FTDR, BLDP, ALRM, CWH, FVRR, SYNA, VSLR, PGNY, SPWR, FIT, INSG, APPS, INMD, ELF
Thursday, August 6:
NVO, TMUS, BMY, BDX, ZTS, BKNG, ILMN, MELI, UBER, AEP, BCE, DDOG, RSG, ING, EOG, WCN, ED, BMO, MSI, PH, SLF, FLT, FTNT, TTD, CNQ, HLT, AEE, CCEP, ALNY, QSR, CAH, EPAM, VIAC, WIX, ZG, ABMD, PBA, NLOK, NET, PODD, NICE, LNG, OTEX, AYX, CABO, CNP, DNB, BAP, AES, XRAY, DBX, MYL, OLED, GH, HLF, PCTY, WLK, PRAH, BHC, LAMR, FSLR, PWR, SRCL, SEE, FLIR, AAXN, EVBG, NOMD, WWD, STMP, YETI, GWPH, APPN, CARG, NCLH, PZZA, RPD, PLUG, TRIP, LAUR, YELP, FLR, AXNX, GPRO
Economic Reports
July ADP employment report: 167,000 (actual) vs. 1,888,000 (estimate)
July PMI services index: 50.0 (actual) vs. 49.6 (estimate)
July ISM services index: 58.1 (actual) vs. 55.0 (estimate)
Happy trading!
Tom