
EB Daily Market Report - Friday, August 7, 2020
Executive Market Summary
- Futures were weak and all of our major indices are lower
- The NASDAQ, however, has seen a major increase in selling since 11am ET, with reversals in most of the best sectors and industries of 2020
- A stronger-than-expected jobs report has sent bond traders heading to the exits; the 10 year treasury yield ($TNX) has jumped a couple basis points to 0.56%
- The interest-sensitive areas are performing well, especially financials (XLF, +1.40%) and industrials (XLI, +1.11%)
- Utilities (XLU) is the best performing sector, rising 1.58%
- Technology (XLK, -2.14%) is being punished as its 3 leaders - computer hardware ($DJUSCR), software ($DJUSSW), and semiconductors ($DJUSSC) are all down from 2.2%-2.8%
- Commodities are seeing a lot of profit taking today as the dollar rallies on the strong jobs report
Market Outlook
Yesterday, I looked at near-term support levels on the S&P 500. Today, let's look at the best of our major indices, the NASDAQ 100 ($NDX):
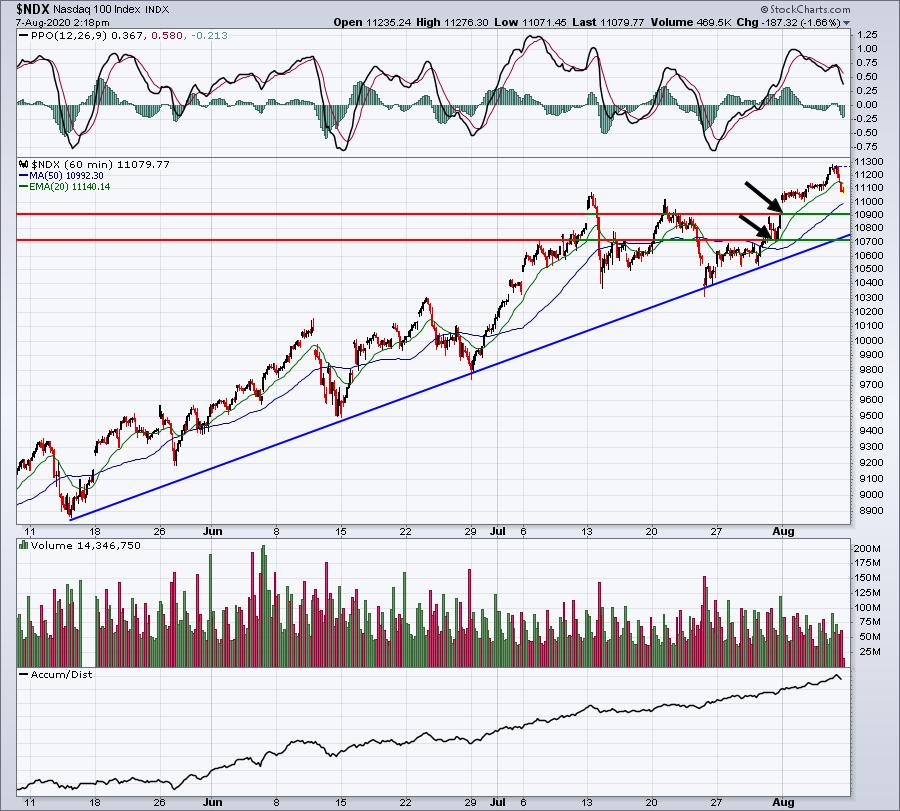
Initial support should be felt near 10900, but this latest rise is definitely accompanied by a negative divergence. Therefore, more selling should probably be expected. It's also the 7th day of the calendar month and those of you have followed my historical work over the years know that the 7th through the 10th calendar days of the month tend to be bearish (profit taking). Don't be surprised to see additional selling on the NASDAQ early next week. That could set up some nice short-term buying opportunities, however.
The more important support level, in the near-term, is at 10700, because you can see how many times the uptrend line has been tested and that trendline is now intersecting very close to that 10700 gap and price support.
Sector/Industry Focus
I wrote about internet stocks ($DJUSNS) and I'm going to write about them again today. They are showing a very nasty false breakout intraday, and if that holds into today's close, I'd expect to see further short-term weakness upcoming:
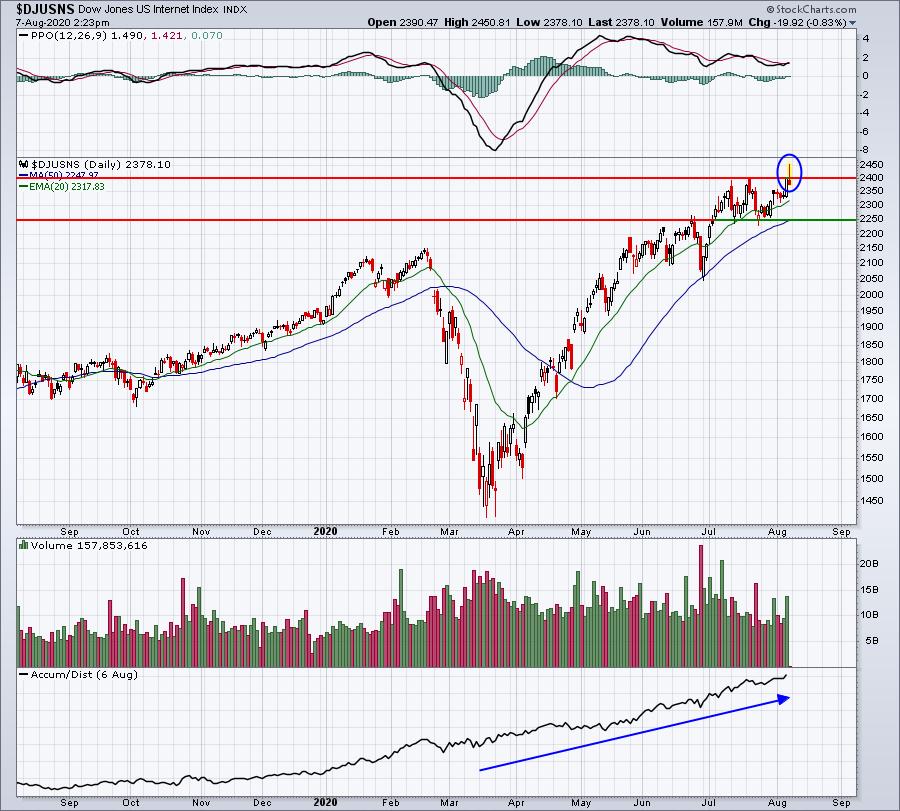
As a short-term trader, I always respect these types of reversals. Be careful on the long side in the near-term - from a trading perspective. I remain very bullish long-term, but it's August and we know what can happen during the summer months and also this time of any calendar month.
ChartLists
The Strong Future Earnings ChartList (SFECL) has been updated and is now available for download into your StockCharts.com account - assuming you're an Extra or Pro member there. If you're not a StockCharts.com member, you will be able to view the list of stocks, one chart at a time, but you won't be able to save them.
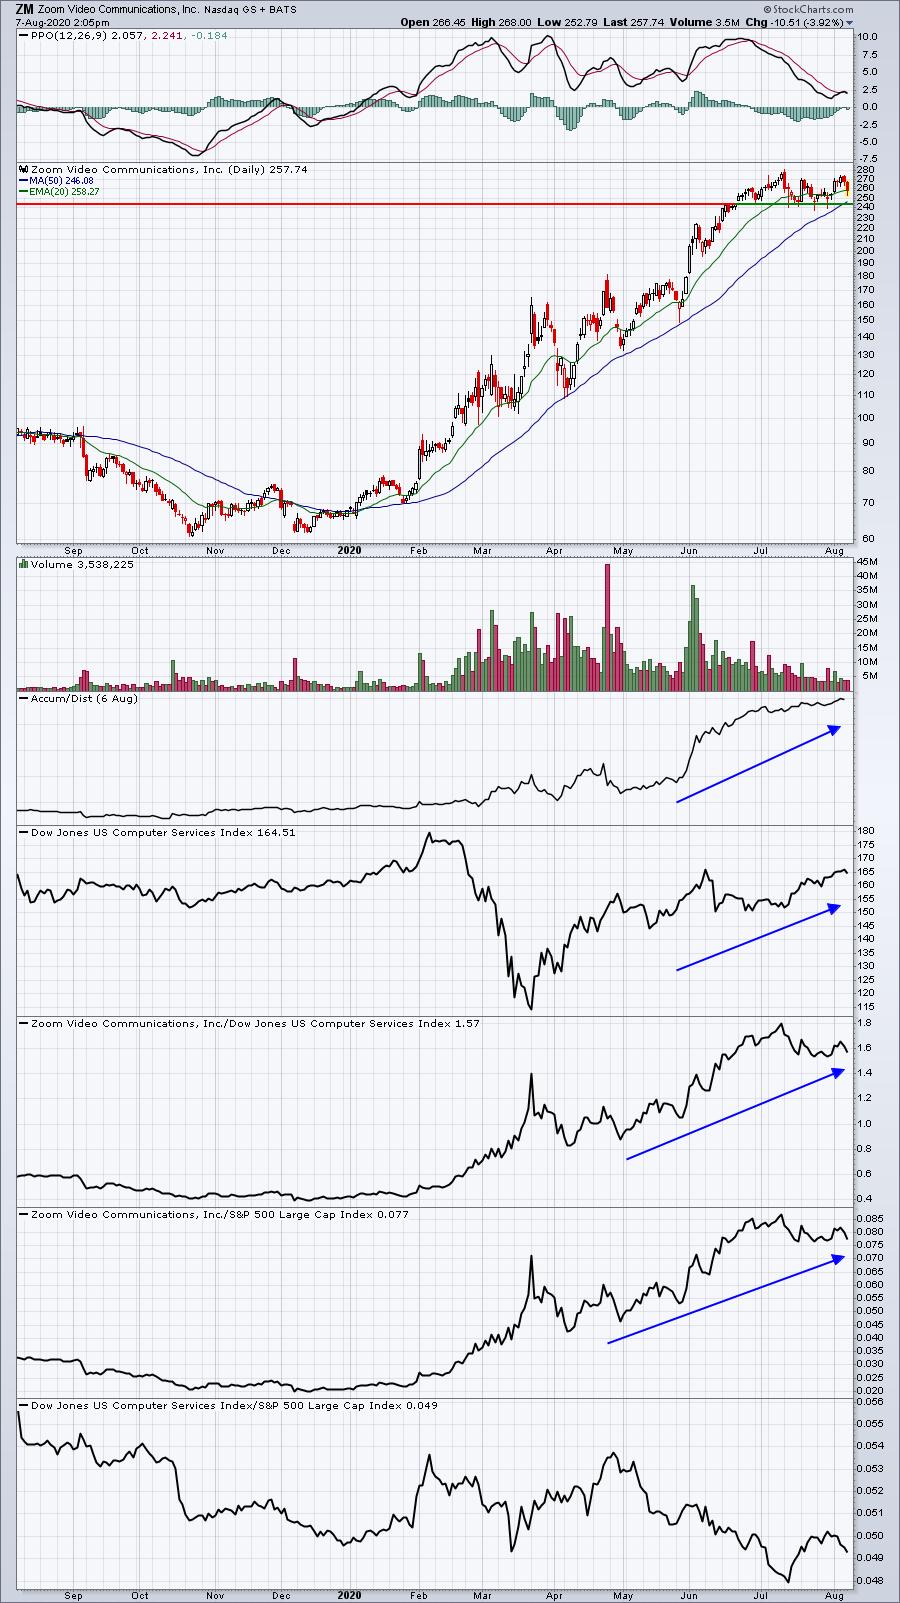
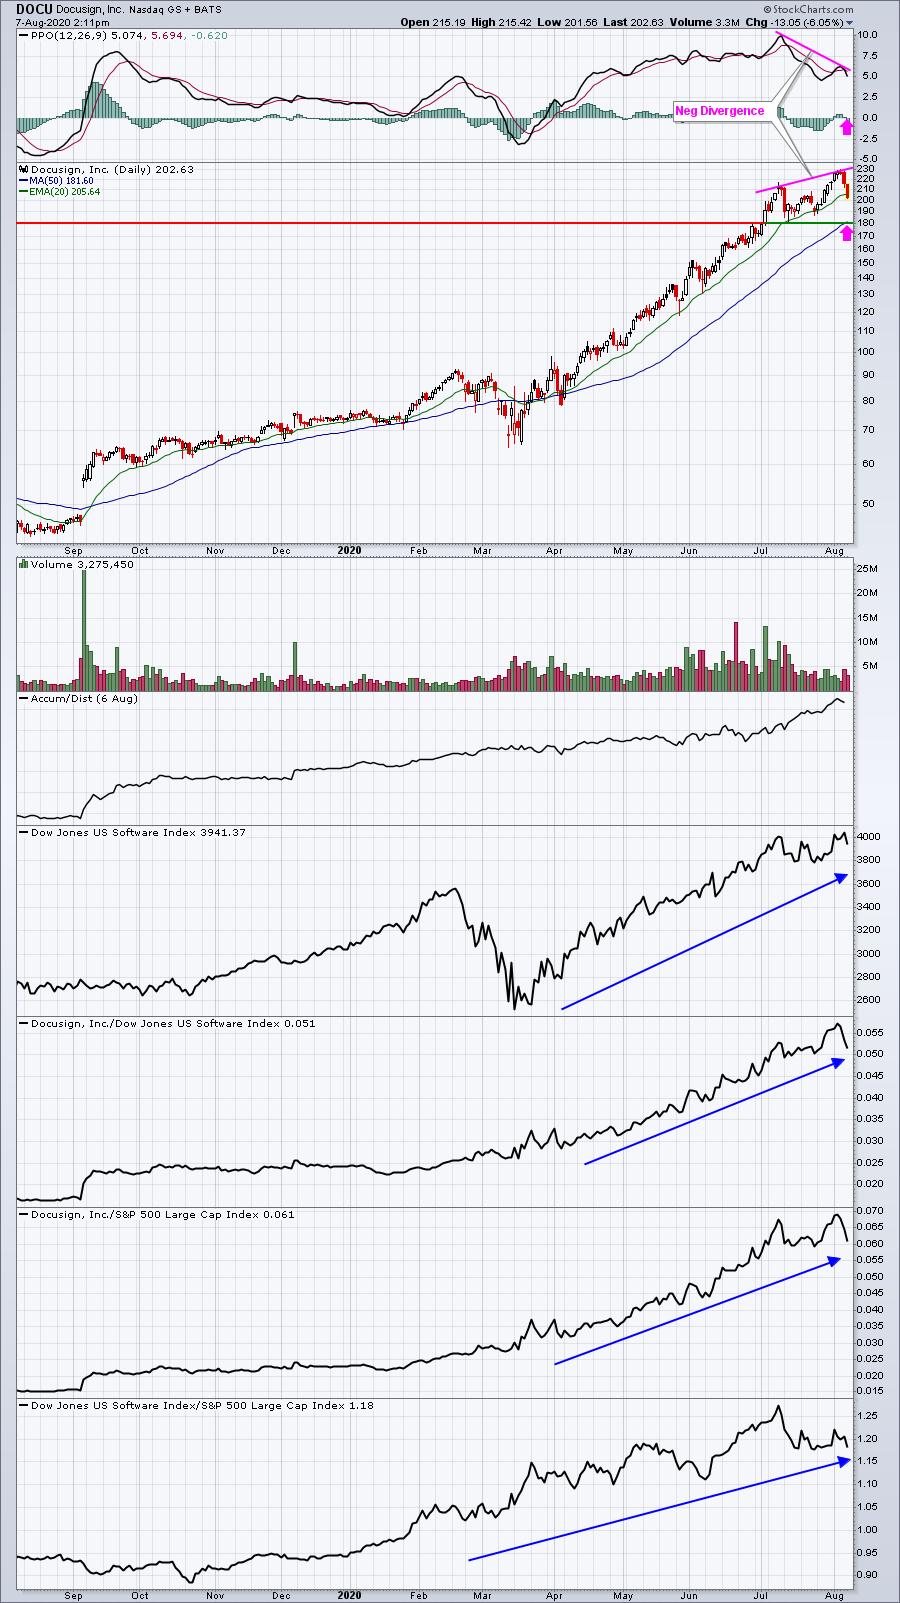
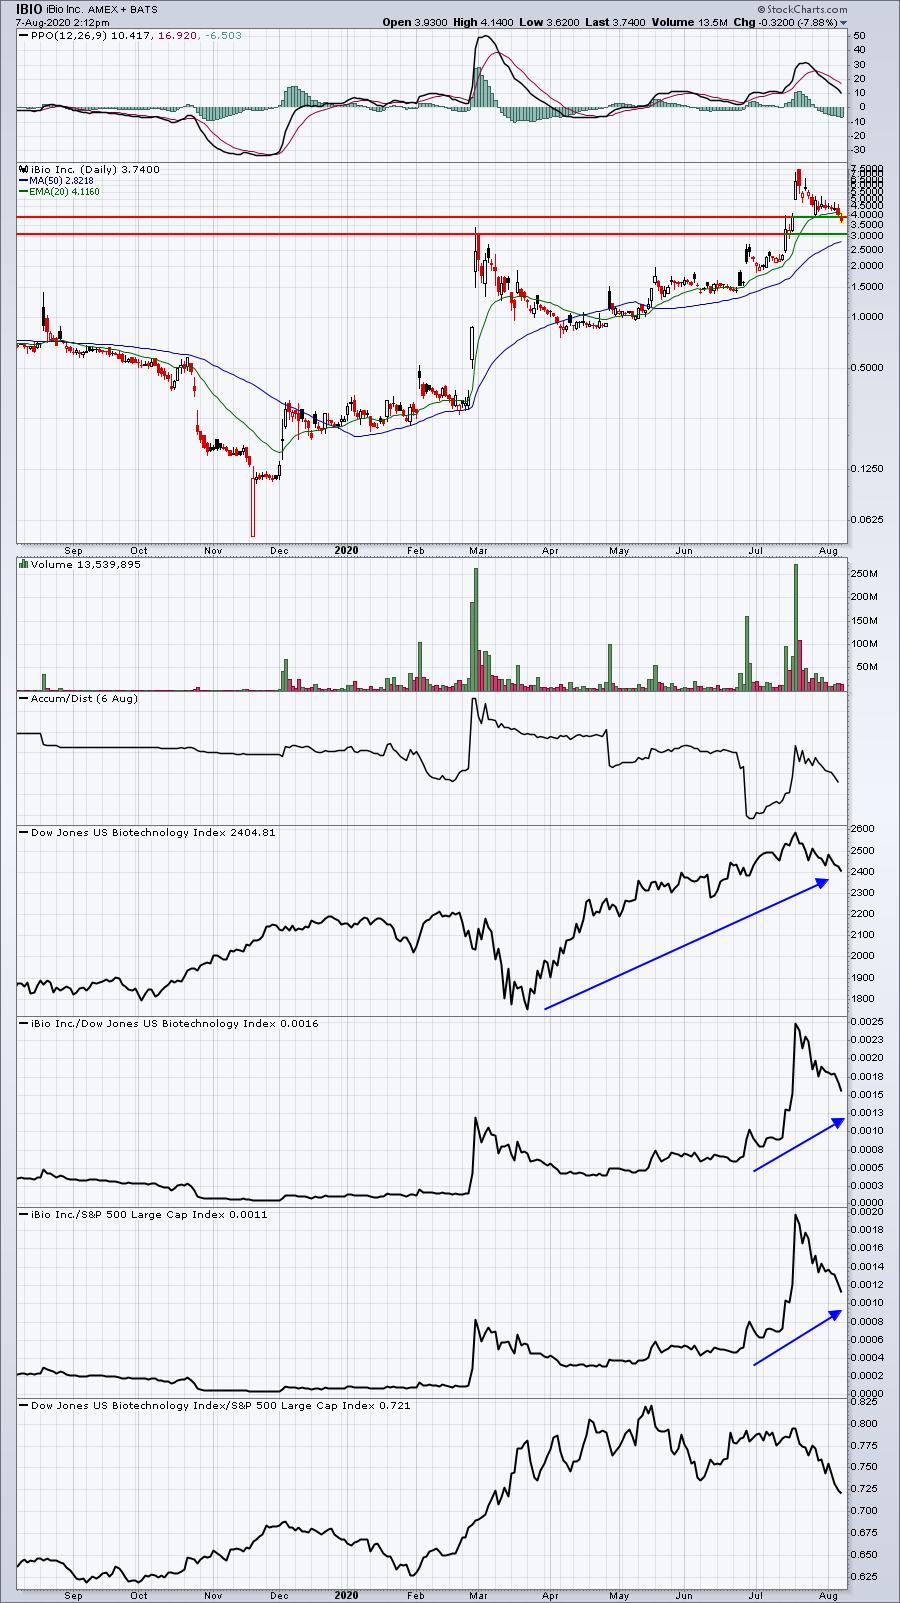
Growth stocks are mostly lower today. Looking at our SECL and SFECL, here are a few stocks to consider if we see further selling:
ZM:
DOCU:
IBIO:
ACMR:
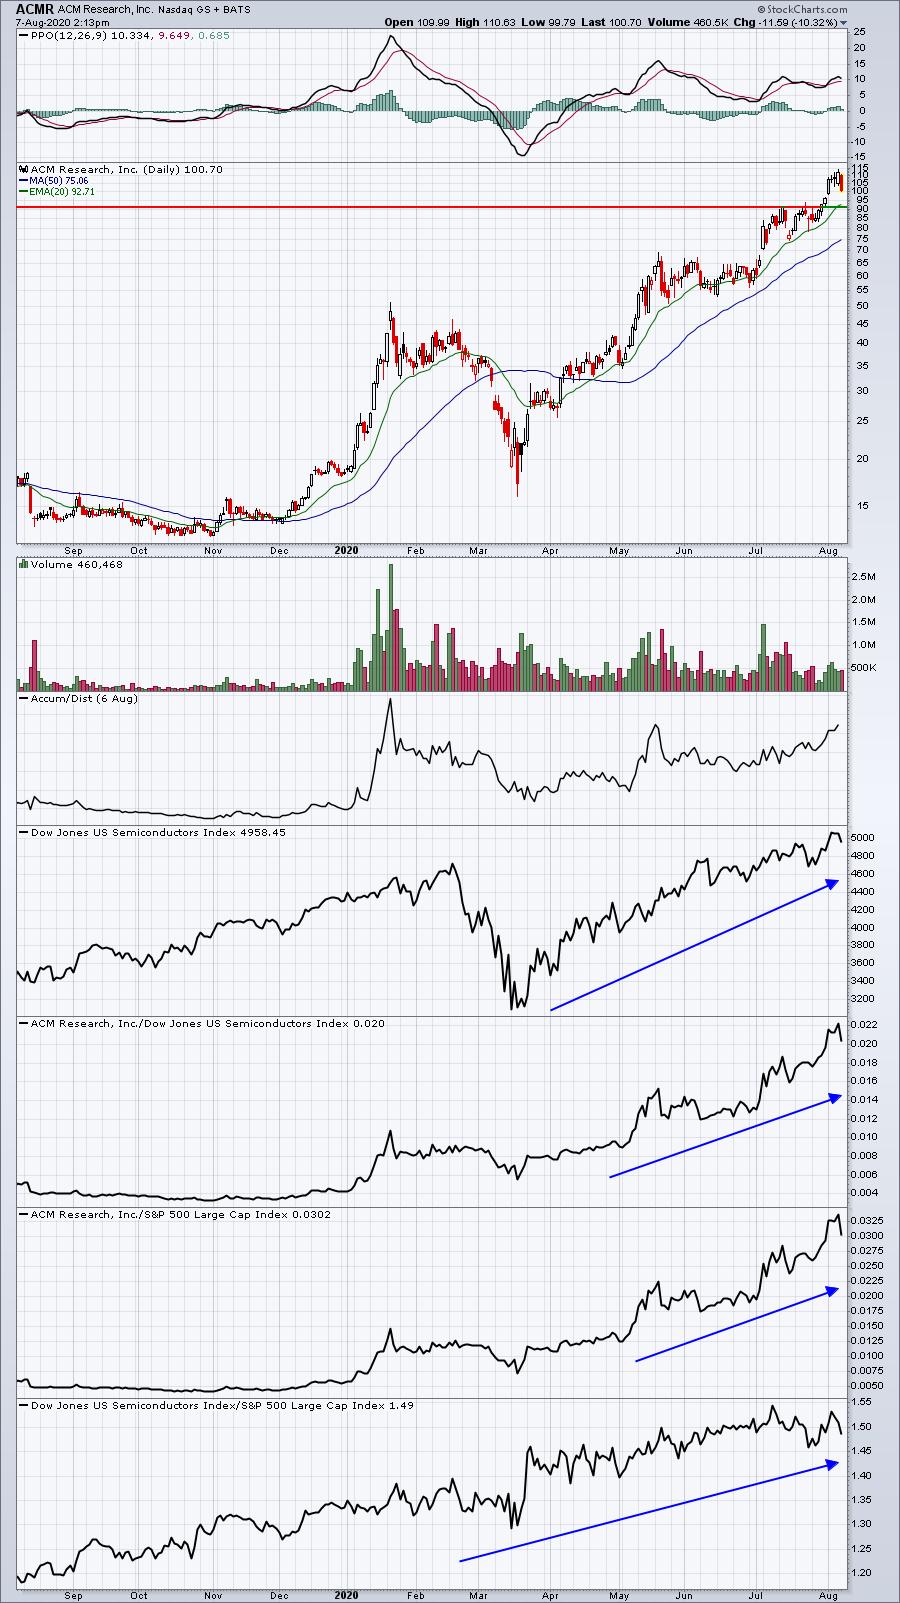
Reversing candles at or near the support levels provided is what I'd look for.
Earnings Reports
Here are the key earnings reports for today and tomorrow, featuring stocks with market caps of more than $10 billion. I also include a few select companies with market caps below $10 billion. Finally, any portfolio stocks (or active trade alerts) that will be reporting results are highlighted in BOLD. If you decide to hold a stock into earnings, please understand the significant short-term risk that you are taking. Please be sure to check for earnings dates for any companies you own or are considering owning:
Friday, August 7:
DISH, VTR, MGA, IEP, KIM, VIRT, ESNT, CNNE, NJR, HMSY, RDN, SABR, NWN, CSIQ, UFS, VIVO
Monday, August 10:
DUK, MELI, GOLD, MAR, TME, PPL, NTR, SPG, OXY, IFF, BKI, RCL, NVAX, ANGI, CGC, RUN, QLYS, SDGR, MNTA, RAMP, JCOM, TGNA, WKHS, TLRY
Economic Reports
July nonfarm payrolls: 1,763,000 (actual) vs. 1,675,000 (estimate)
July private payrolls: 1,462,000 (actual) vs. 1,525,000 (estimate)
July unemployment rate: 10.2% (actual) vs. 10.5% (estimate)
July average hourly earnings: +0.2% (actual) vs. -0.7% (estimate)
June wholesale inventories: -1.4% (actual) vs. -2.0% (estimate)
Happy trading!
Tom