
EB Daily Market Report - Tuesday, August 11, 2020
Executive Market Summary
- Futures were positive this morning, but clearly favored the Dow Jones and value stocks
- The Dow Jones has climbed back above 28000 and is now roughly 4-5% from its all-time high
- The S&P 500, meanwhile, lags but at its high earlier, was only 13 points from its all-time high
- Other laggards during the pandemic, such as small caps ($SML) and mid caps ($MID), are easily outperforming today
- Commodities are being crushed today with gold ($GOLD, -4.50%) and silver ($SILVER, -10.10%) both sold off hard
- The 10 year treasury yield ($TNX) has soared above its 20 day EMA, rising 8 basis points to 0.65%
- Higher-than-expected inflation this morning is likely contributing to the selloff in bonds
- Financials (XLF, +2.56%) is the major beneficiary of the higher treasury yields as banks ($DJUSBK) jump more than 4%
- 4 sectors are lower today, however, led by utilities (XLU, -1.77%); technology (XLK, -0.13) continues to wobble
Market Outlook
I've discussed the long-term outlook quite a bit and nothing has changed there. I remain very bullish. Short-term, we must be much more nimble. One of the best relative charts to follow - even on an intraday basis - is the relationship between the NASDAQ 100 stocks ($NDX) and the Dow Jones Industrials ($INDU). Over the past few months, it's been fairly important to see the short-term changes and rotation taking place in the market. The following 6 month hourly really helps us to visualize this rotation and its impact on our short-term trading results (probably):
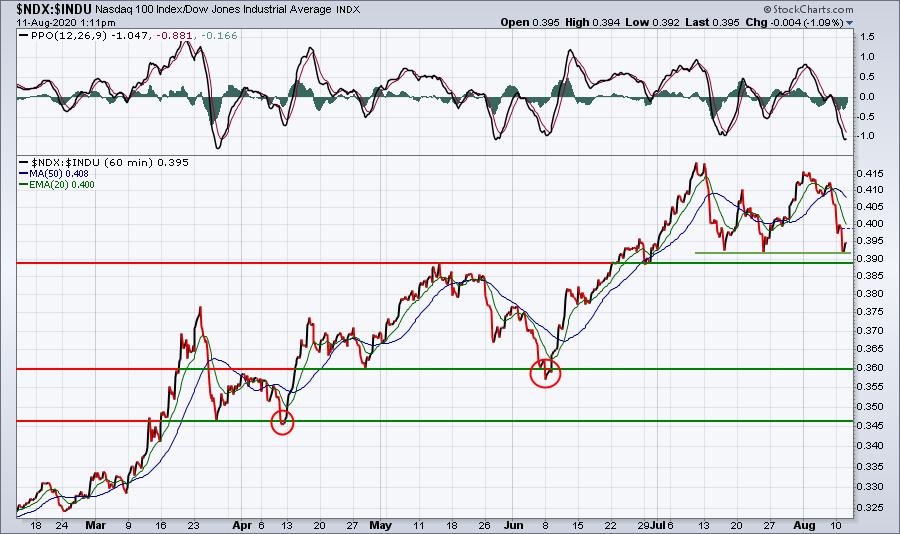
The NDX is up slightly in August, it's not that it's been moving lower. However, Dow Jones component stocks have rallied significantly. As I've been discussing in recent DMRs, this is not a bad thing at all. But if you're in some of the leading NASDAQ stocks, it becomes frustrating watching the relative underperformance. Just keep the above chart in mind. Given those recent relative lows, we could be nearing the end of the Dow Jones relative strength.
Sector/Industry Focus
Among the strongest industry groups of 2020, software ($DJUSSW) has probably been the weakest on a relative basis the past six weeks. It could be setting up a serious rally. At a minimum, the reward to risk entry in this industry group is clearly improving. First, let's take a look at the chart:
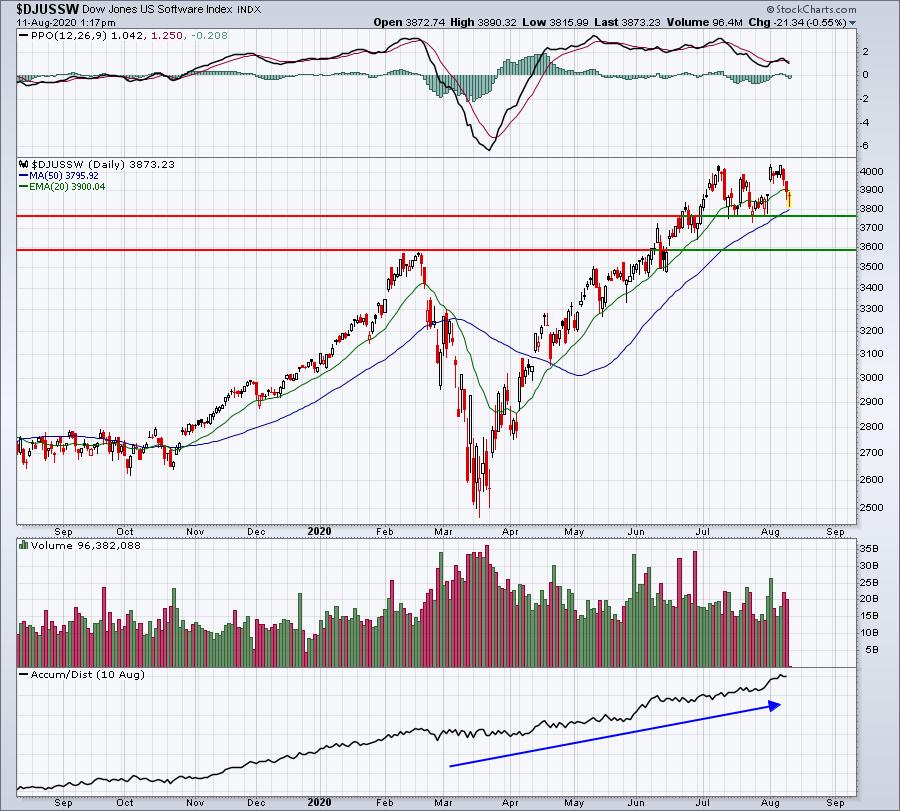
The two horizontal lines are the short-term support levels that I'd watch most closely. I believe the initial support level will hold. The AD line in the bottom panel shows that group continues to be accumulated, even on down days. In the ChartLists section below, I review software stocks for possible trades.
ChartLists
When in doubt, always trade the leaders. When a group like software is under pressure, Wall Street almost always returns to the leaders first during a rally. As I review all of our ChartLists, I first look at the highest SCTR scores among software. Here are a few stocks to consider as the NASDAQ consolidates:
DOCU:
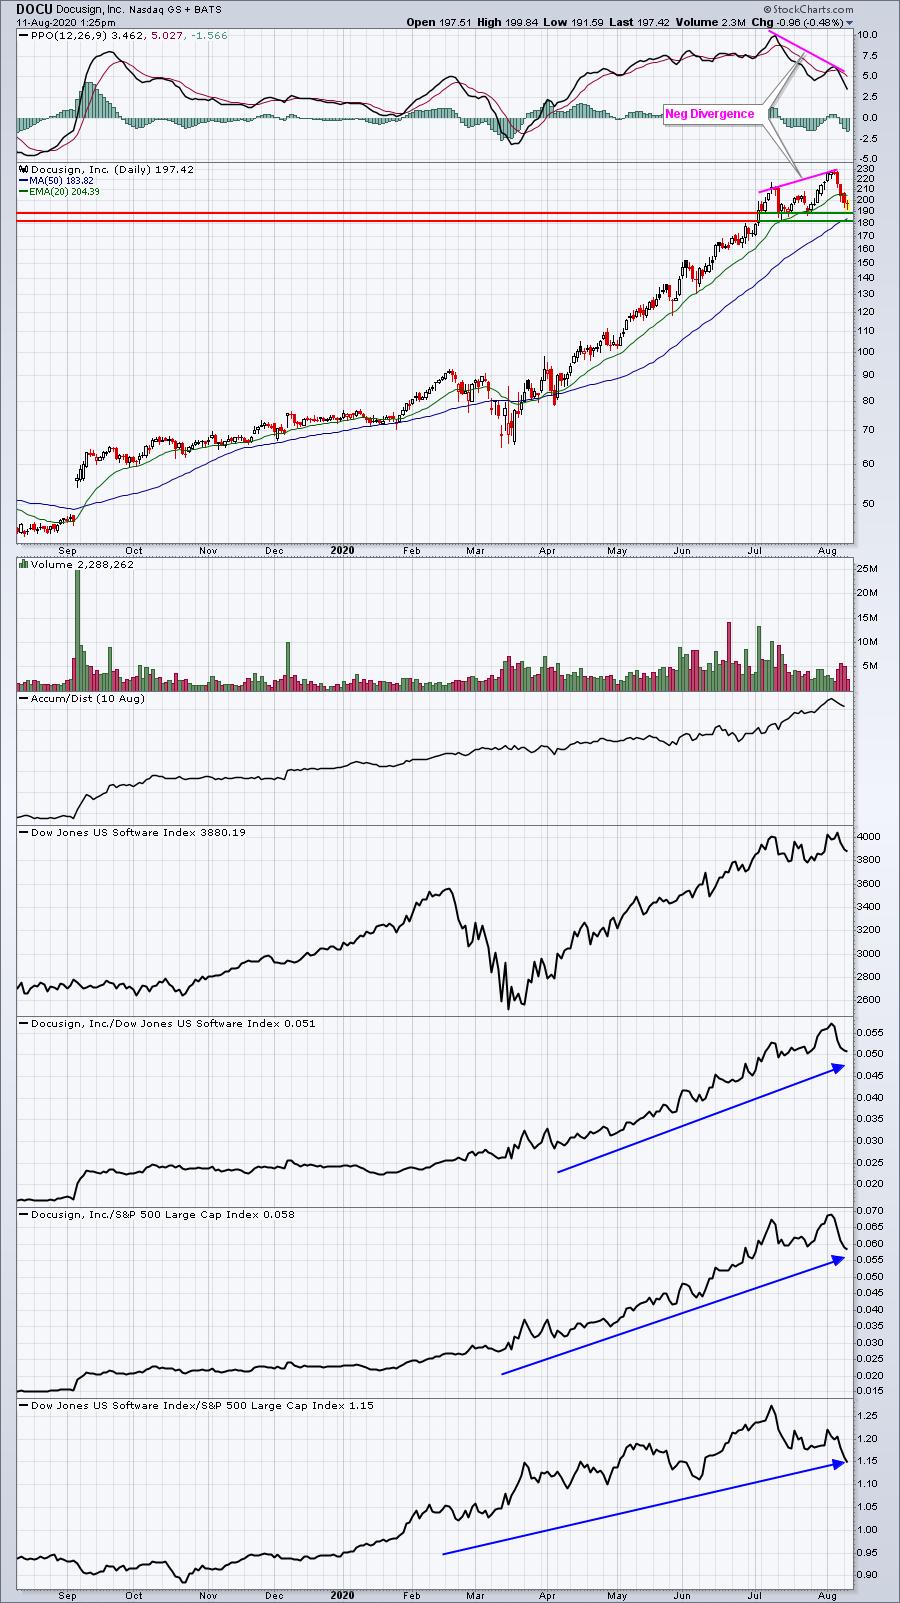
The negative divergence is always at least a warning sign. It doesn't always result in selling, but we should take note whenever prices keep rising, while PPOs decline. Today's low at 191.59 approached recent important price lows and also was nearing its 50 day SMA, after trading close to 50 points above it just a week ago. Some of the excess has been let out of the stock price here and I believe DOCU remains one of the best software stocks.
SHOP:
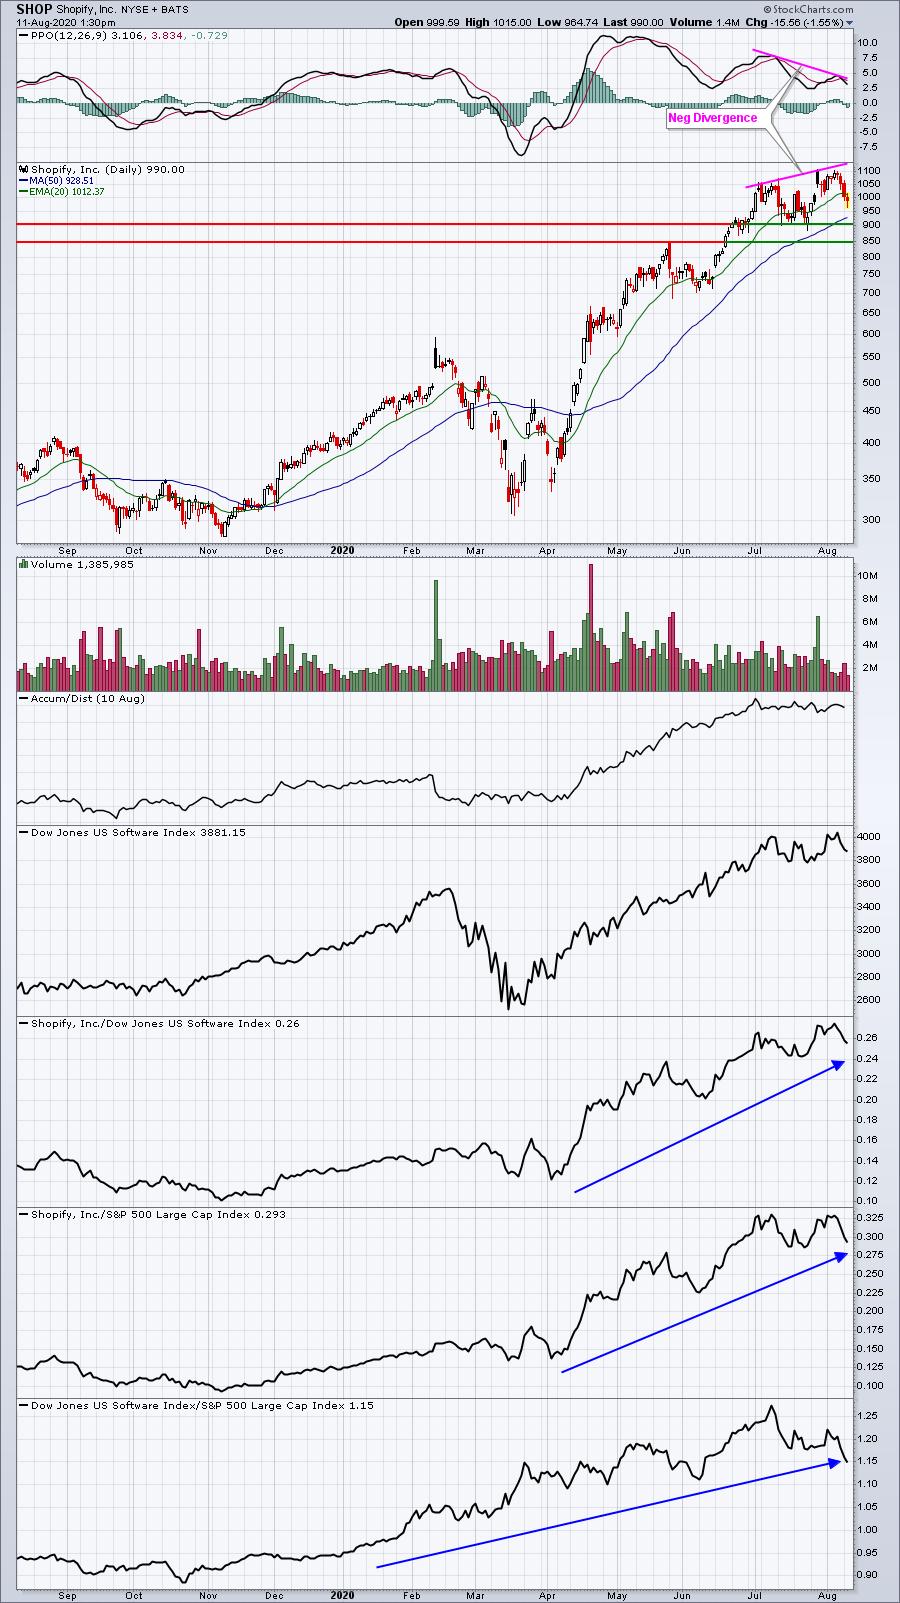
Another negative divergence and more consolidation. But don't lose sight of the fact that SHOP remains one of the most sought-after software stocks. It may not matter today....maybe not even next week, but I believe it will matter soon.
COUP:
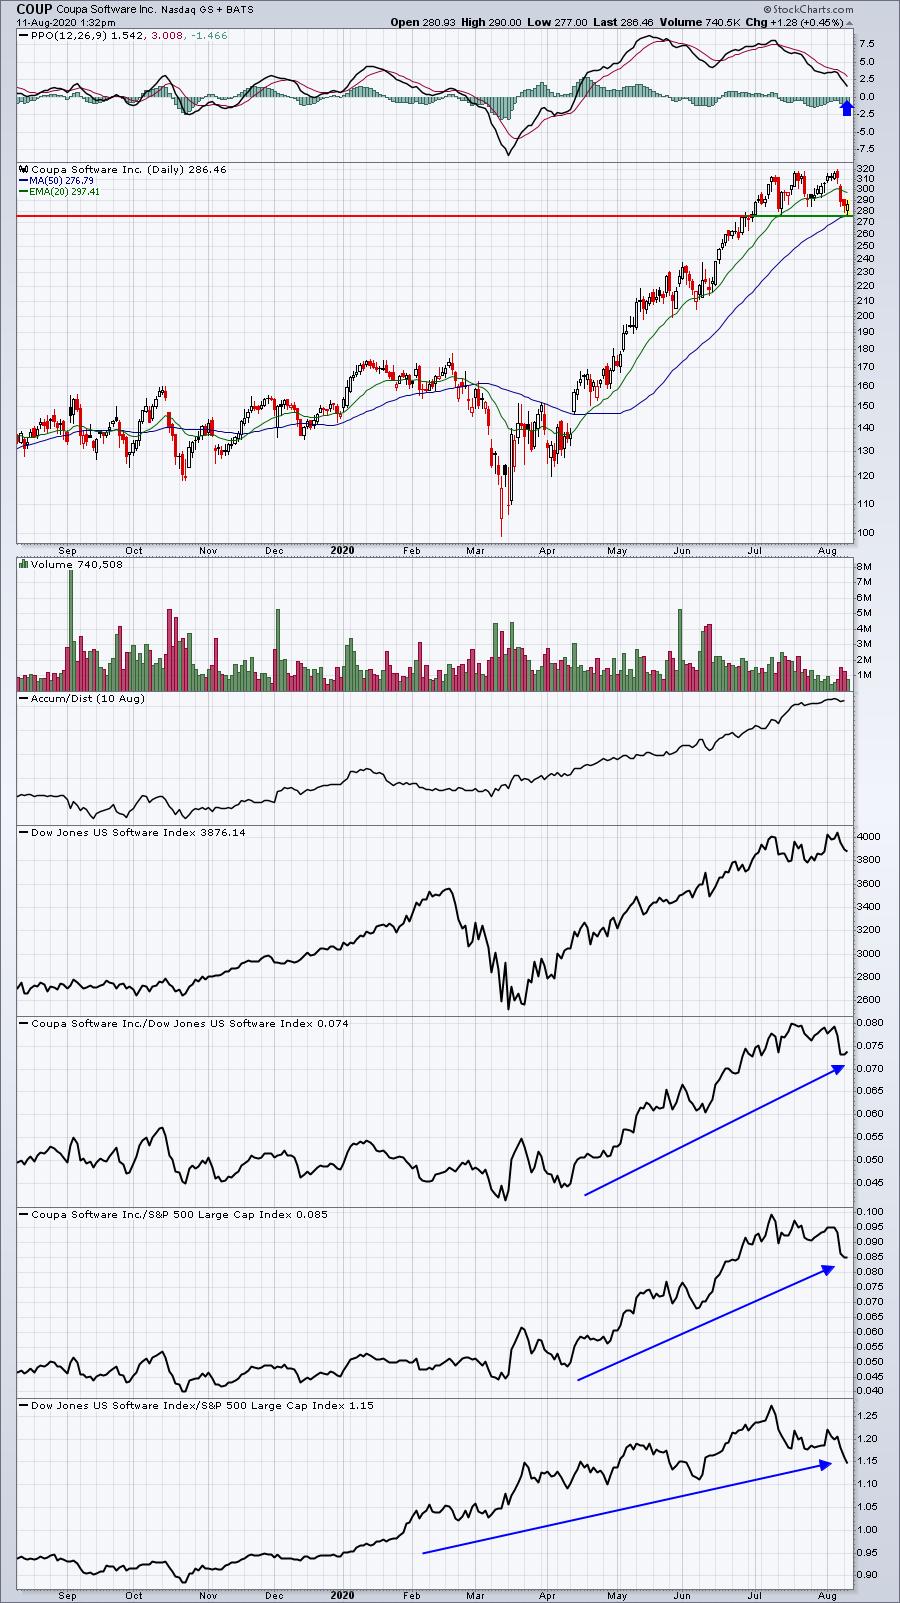
COUP might be the most interesting, simply because it tested its 50 day SMA today. That's likely resulting in a different group of buyers as the stock bounces. Its PPO has been downtrending longer than the others and is now nearing centerline support. COUP could be poised to turn higher at any time.
Here's one other stock in this industry that's been hit hard today, but has reached key support:
VCRA:
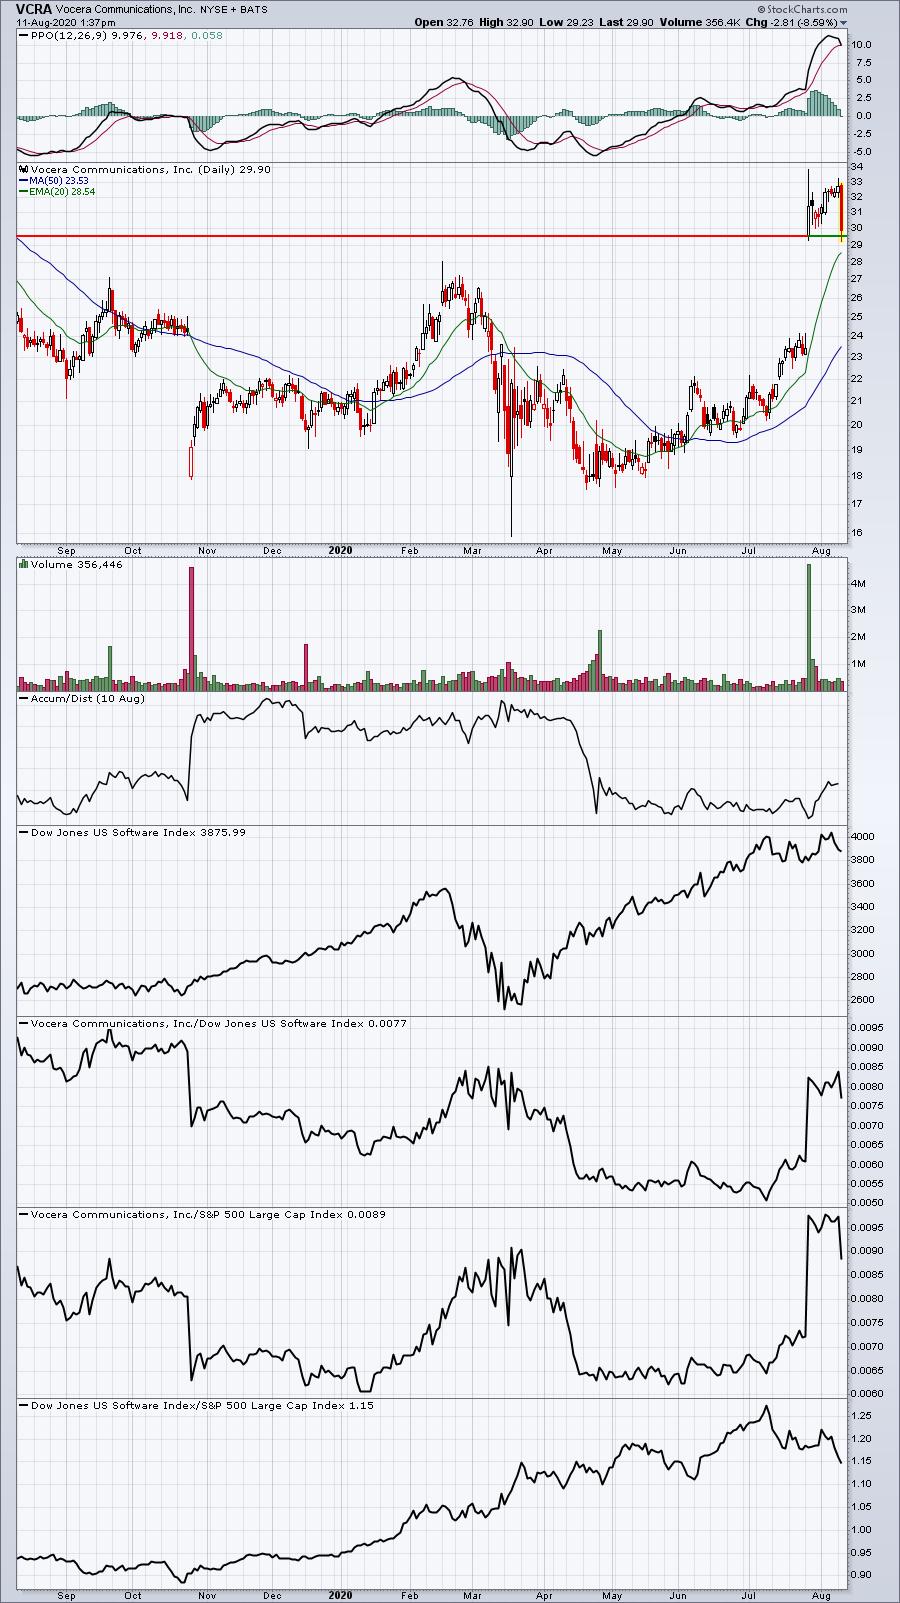
The relative strength here was recently supported by blowout earnings. Prior to that, VCRA was very weak relative to its software peers. Therefore, I'd keep a very tight stop on this one. Today's low would be my intraday stop. I'd view this as a reversal and exit if proven wrong.
Earnings Reports
Here are the key earnings reports for today and tomorrow, featuring stocks with market caps of more than $10 billion. I also include a few select companies with market caps below $10 billion. Finally, any portfolio stocks (or active trade alerts) that will be reporting results are highlighted in BOLD. If you decide to hold a stock into earnings, please understand the significant short-term risk that you are taking. Please be sure to check for earnings dates for any companies you own or are considering owning:
Tuesday, August 11:
SYY, XP, BNTX, BR, NIO, TXG, LITE, HUYA, VIR, VIAV, GOOS, LRN, OSPN
Wednesday, August 12:
CSCO, RPRX, GMAB, WPM, ZTO, LYFT, VRM, AZPN, YY, CACI, EAT
Economic Reports
July PPI: +0.6% (actual) vs. +0.3% (estimate)
July Core PPI: +0.5% (actual) vs. +0.1% (estimate)
Happy trading!
Tom