
EB Daily Market Report - Wednesday, August 12, 2020
Annual Membership Special
I just want to make sure that everyone is aware that we're currently running our best annual deal of the year for a limited time - $697 for 14 months (2 bonus months)! That's less than $50 per month and can save you a bundle. The special began at Monday's "Top 10 Stocks - Sneak Preview" event and will run through this Saturday, August 15th. We'll likely have a similar fall special in a few months, so this special would mostly apply to the following:
- monthly members paying $97 per month
- members currently enjoying their 30-day trial
- annual members whose subscription will expire within the next 2-3 months
To clarify, for those currently on a no-cost trial, you will still receive the balance of your free trial and THEN the 14 months would be added on to the end of your trial.
If interested or if you have any questions, please be sure to contact "[email protected]".
Executive Market Summary
- Futures were solidly higher today across all of our major indices
- After an opening gap higher, traders have turned their attention to the NASDAQ, which is now outperforming all other major indices
- Tesla (TSLA, +13.31%) announced a 5 for 1 stock split
- Commodities have stabilized after their Tuesday drubbing; crude oil ($WTIC) is up more than 2.3%
- Global equities rallied overnight and today, with the German DAX ($DAX, +0.86%) climbing back above 13000
- July CPI was much higher than expected and the 10 year treasury yield ($TNX) began the day near 0.69% and well above its 20 day EMA, but it's fallen back closer to 0.66% at last check
- Technology (XLK) has returned to its leadership role; health care (XLV) and consumer staples (XLP) are also strong
- Financials (XLF) is the only sector in negative territory, likely impacted by the reversal in the TNX
Market Outlook
One chart that I tend to fall back on quite a bit whenever I start to wonder whether a bull market can last is where I look at sector relative strength. Are the aggressive sectors continuing to look solid vs. the S&P 500. Until recently, technology (XLK), consumer discretionary (XLY), and communication services (XLC) were the only three aggressive sectors leading the benchmark S&P 500. Now that we've seen treasury yields rising and transportation stocks breaking out, we've seen a bit of relative strength in the other two aggressive sectors - financials (XLF) and industrials (XLI). Here is the S&P 500, followed by these 5 sectors on a relative strength basis:
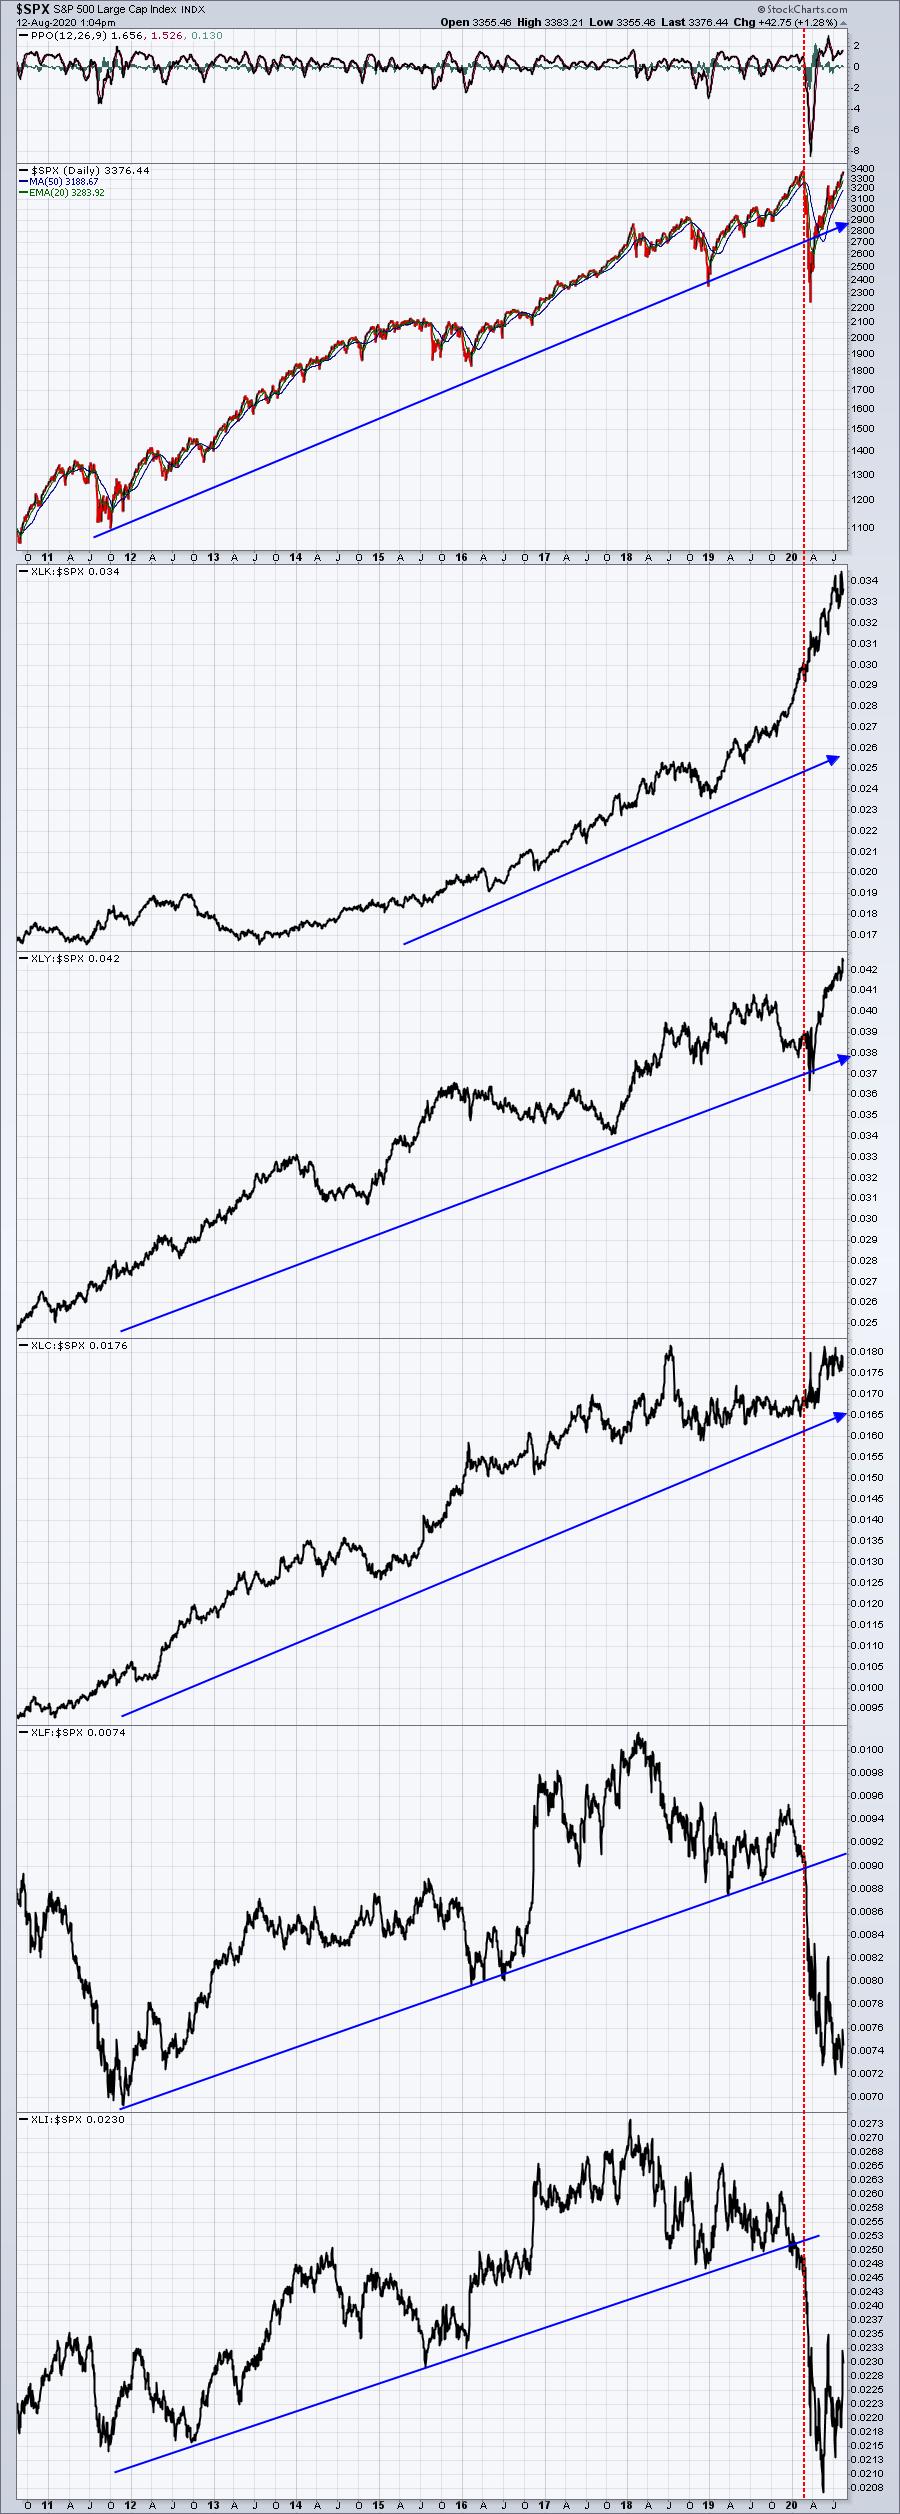
You can always "spin" a chart to prove whatever point it is that you're making. It would be easy for me to take the bearish stance with the above chart and say that two aggressive sectors - XLF and XLI - are failing to lead; therefore, the rally will fail. But I believe more appropriate approach is to be somewhat objective and not just follow lines on a chart, but TRULY UNDERSTAND what the lines are telling us. For instance, look at the relative strength in the XLK. It has gone nearly parabolic. When one sector outperforms by that magnitude, it makes it much more difficult for other sectors to outperform. The technology companies in the S&P 500 are carrying the index higher on their collective shoulders. They're lifting the "average" company performance considerably, making it difficult for other sectors to beat that higher "average". Yet, both the XLY and XLC managed to do just that. I find that to be incredibly bullish. And we know the reason why the XLF and XLI are underperforming. They're both more economically-sensitive sectors and the pandemic crushed manufacturing, transportation, banks, etc. Those groups are now starting to rally as the economic outlook improves, which is bullish and noteworthy.
We are going higher. I'm convinced of that. The secular bull market will carry us higher than most "experts" consider possible.
Sector/Industry Focus
Today, health care (XLV) and consumer staples (XLP) are among the sector leaders and breaking out. (Technology is actually leading, but I want to show the absolute price action on the XLV and XLP). Check out this chart:
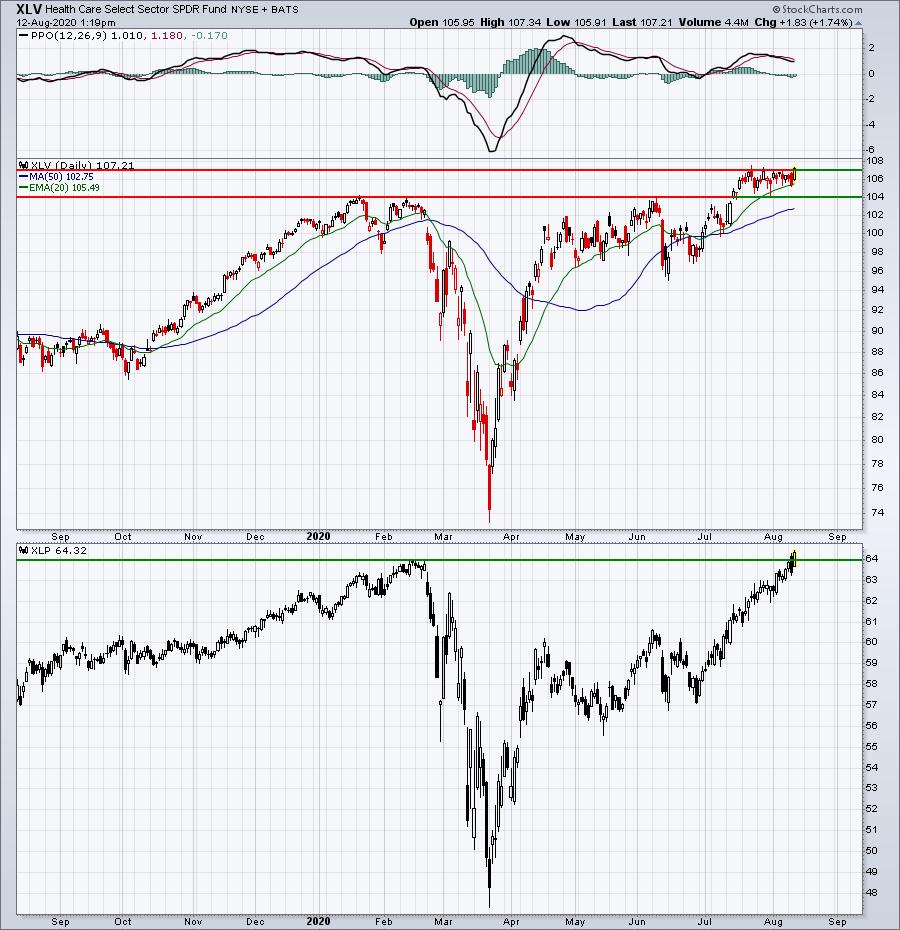
Welcome to the party! The more, the merrier!
ChartLists
Given that both health care (XLV) and consumer staples (XLP) are breaking out, I wanted to customize our 52 week high scan for these two industries among our Strong Earnings ChartList (SECL), Strong Future Earnings ChartList (SFECL), and our Strong AD ChartList (SADCL). In other words, which health care and consumer staples stocks are setting 52 week highs AND are on one of the three ChartLists provided. Here's the scan syntax for that:
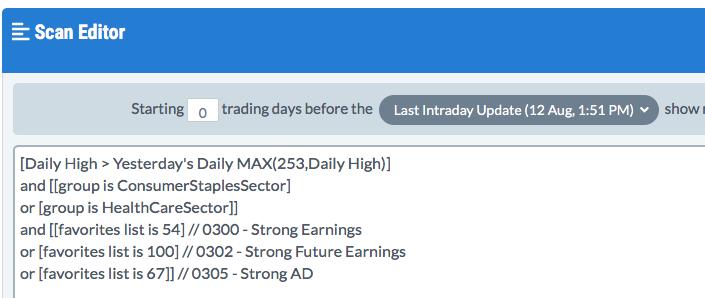
There were 4 stocks returned:
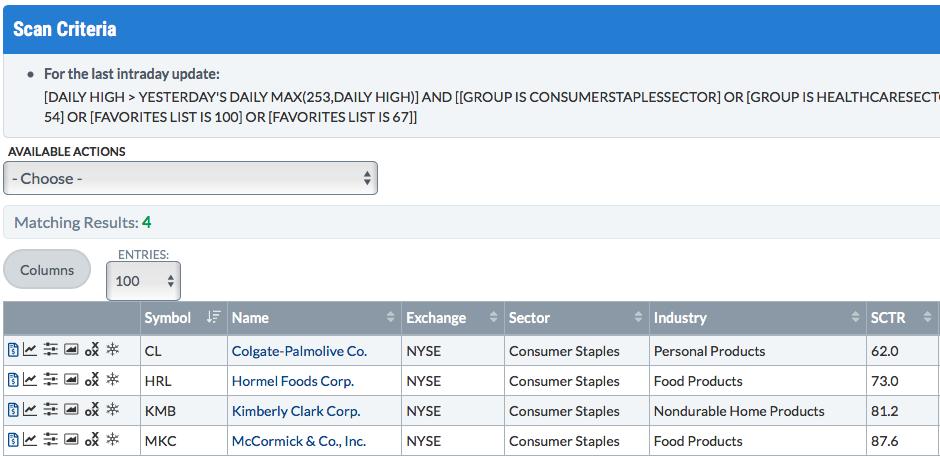
While all of these charts look strong, I'd suggest looking at CL as it's just making a breakout after a significant period of consolidation:
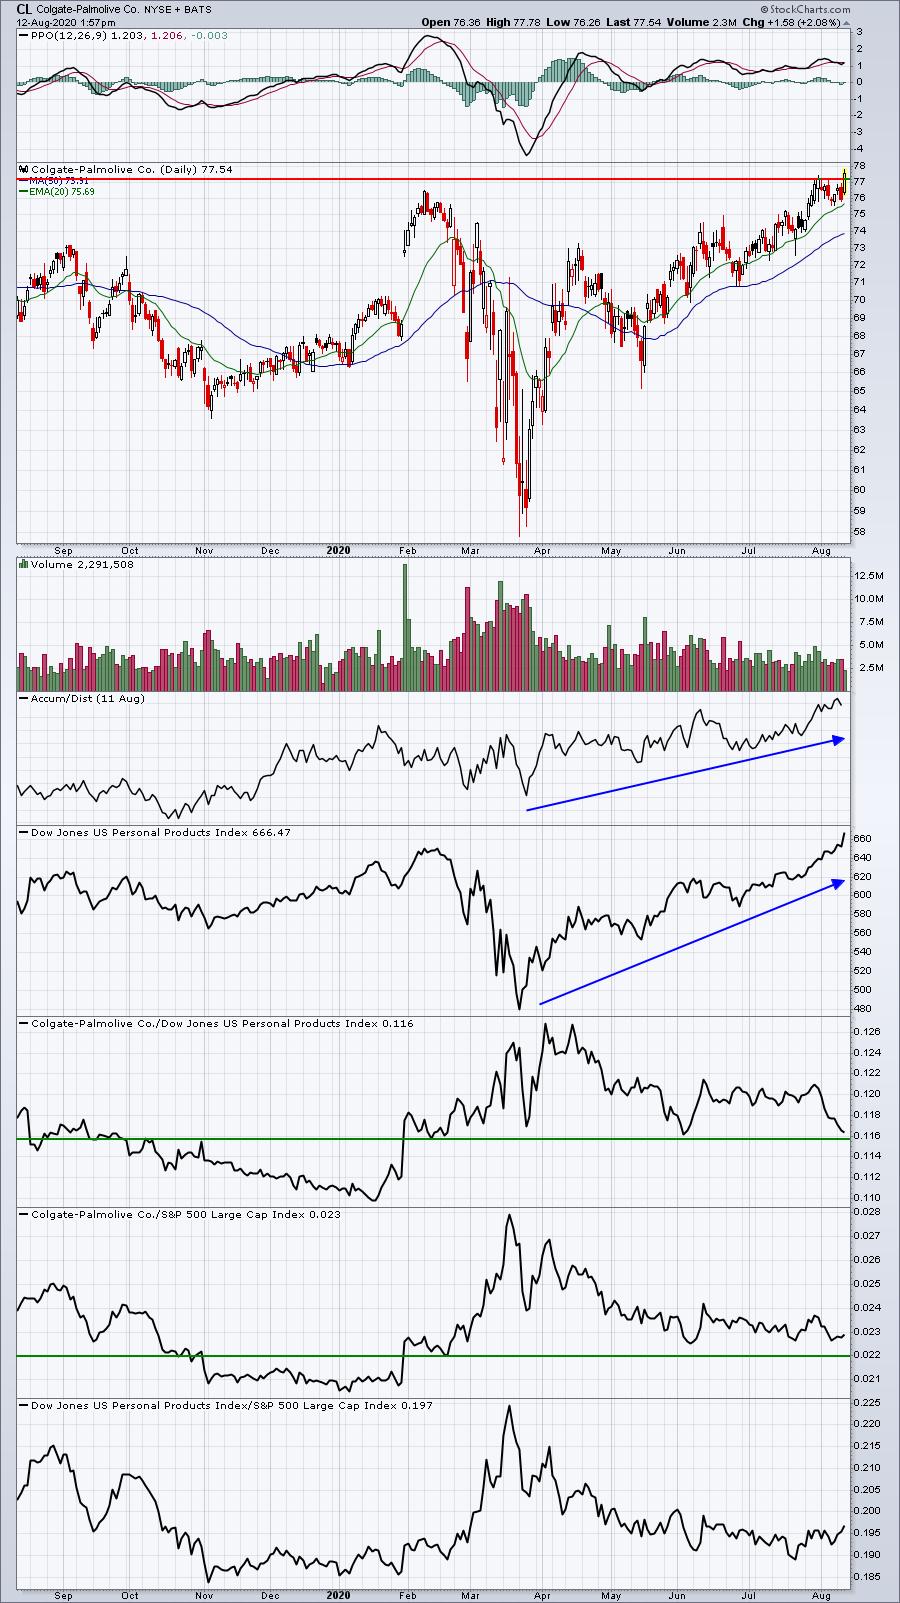
I like CL, but also realize it needs to hold relative support vs. its peers and vs. the benchmark S&P 500. If it doesn't, I'd look elsewhere.
There are other scans that can be run as well. For instance, scanning our ChartLists for health care and consumer staples stocks that have SCTRs > 90 would be useful as it provides you the relative leaders in groups breaking out.
The purpose of this exercise to show you how I would approach a situation where I see a bullish technical development taking place and then using our research platform (ChartLists, scanning strategies, etc) to zero in on a potential trading candidate.
Earnings Reports
Here are the key earnings reports for today and tomorrow, featuring stocks with market caps of more than $10 billion. I also include a few select companies with market caps below $10 billion. Finally, any portfolio stocks (or active trade alerts) that will be reporting results are highlighted in BOLD. If you decide to hold a stock into earnings, please understand the significant short-term risk that you are taking. Please be sure to check for earnings dates for any companies you own or are considering owning:
Wednesday, August 12:
CSCO, RPRX, GMAB, WPM, ZTO, LYFT, VRM, AZPN, YY, CACI, EAT
Thursday, August 13:
AMAT, NTES, BAM, BIDU, IQ, FTCH, IIVI, TPR
Economic Reports
July CPI: +0.6% (actual) vs. +0.3% (estimate)
July Core CPI: +0.6% (actual) vs. +0.2% (estimate)
Happy trading!
Tom