
EB Daily Market Report - Friday, August 14, 2020
Final DMR Reminder: Annual Membership Special
One last reminder to make sure that everyone is aware that we're currently running our best annual deal of the year for a limited time - $697 for 14 months (2 bonus months)! That's less than $50 per month and can save you a bundle. The special began at Monday's "Top 10 Stocks - Sneak Preview" event and will run through this Saturday, August 15th. We'll likely have a similar fall special in a few months, so this special would mostly apply to the following:
- monthly members paying $97 per month
- members currently enjoying their 30-day trial
- annual members whose subscription will expire within the next 2-3 months
To clarify, for those currently on a no-cost trial, you will still receive the balance of your free trial and THEN the 14 months would be added on to the end of your trial.
If interested and you have any questions, please be sure to contact "[email protected]".
Special Saturday Event
I will be hosting a webinar at 2pm ET on Saturday, August 15th to essentially discuss our research and product platform at EarningsBeats.com. It will be open to the public, so that non-members can get a sense of what we do. But quite honestly, I think it will provide an excellent tutorial for all of our current members as well. Since announcing my return to EarningsBeats.com as its Chief Market Strategist just a little over a year ago (August 10, 2019), we have made a ton of changes and really enhanced our product offering. Between our 4 portfolios, 7 primary ChartLists, and a handful of scanning strategies, there's a lot of research/education/information that we now provide. I plan to spend time discussing how members can best utilize our service, so I hope you can join me. If not, however, we will record the session and make it available to everyone.
Executive Market Summary
- Futures looked positive and stronger on the NASDAQ as that index opened higher
- The Dow Jones and S&P 500 opened lower, but now these two are higher and the NASDAQ is negative
- There were a number of economic reports out this morning; most notably, July's retail sales were announced below expectations
- Sectors that have lagged since March are leading today - energy (XLE, +0.98%) and real estate (XLRE, +0.78%)
- Utilities (XLU, -0.71%) is the weakest sector
- Boeing (BA) is up more than 2% and is the Dow Jones' best performing component stock
- It doesn't happen often, but Apple (AAPL) is today's laggard on the Dow
- Commodity prices are generally low today, despite a weakening dollar (UUP)
- Applied Materials (AMAT), a leading semiconductor stock, is up 3.52% after reporting its quarterly results after the bell on Thursday
Market Outlook
It's been like pulling teeth to get the market to selloff even a little bit. There is a technical reason why we could see the NASDAQ 100 ($NDX) struggle in the days and weeks ahead, however. Check out this negative divergence:
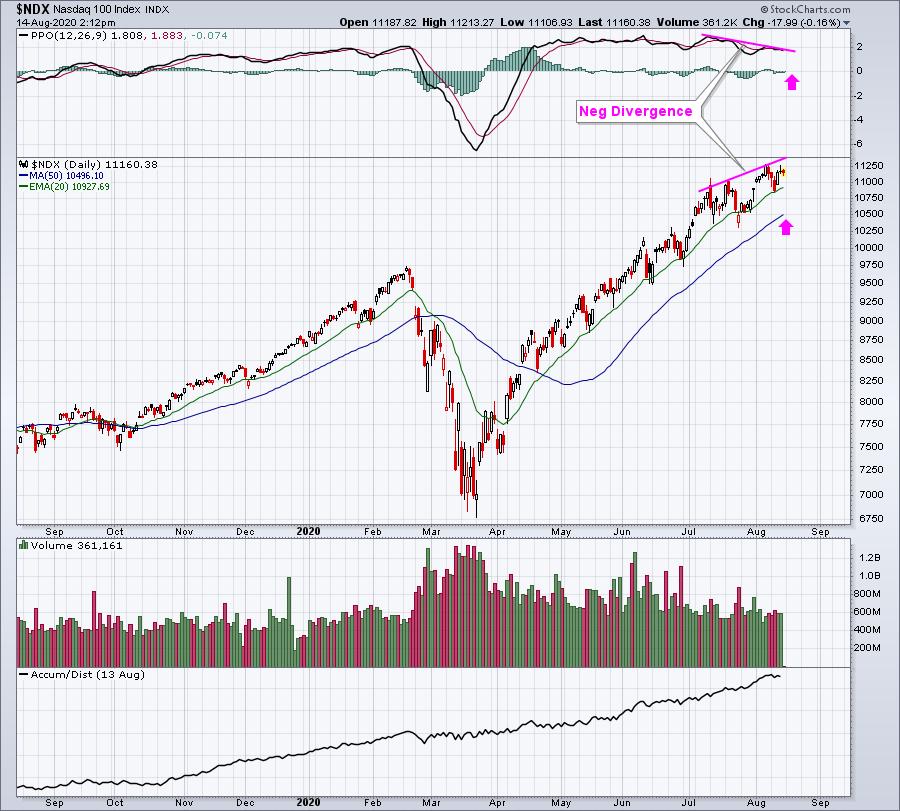
The pink arrows highlight what I look for when I see negative divergences develop. I look for a return to the PPO centerline and a possible 50 day SMA test. However, sideways consolidation can cure the issue as the 50 day SMA rises. It doesn't necessarily require a big selloff. And, of course, sometimes the market simply puts its head down and ignores these short-term warning signs.
Sector/Industry Focus
Real estate (XLRE) is today's leading sector and it's trading above its 20 day EMA. That's part of a secular bull market - wide participation. Most areas of the market are moving higher, but it's essential that we pay attention to relative strength over absolute strength. Here's a chart of the XLRE, but note the lower panel where relative strength is reflected:
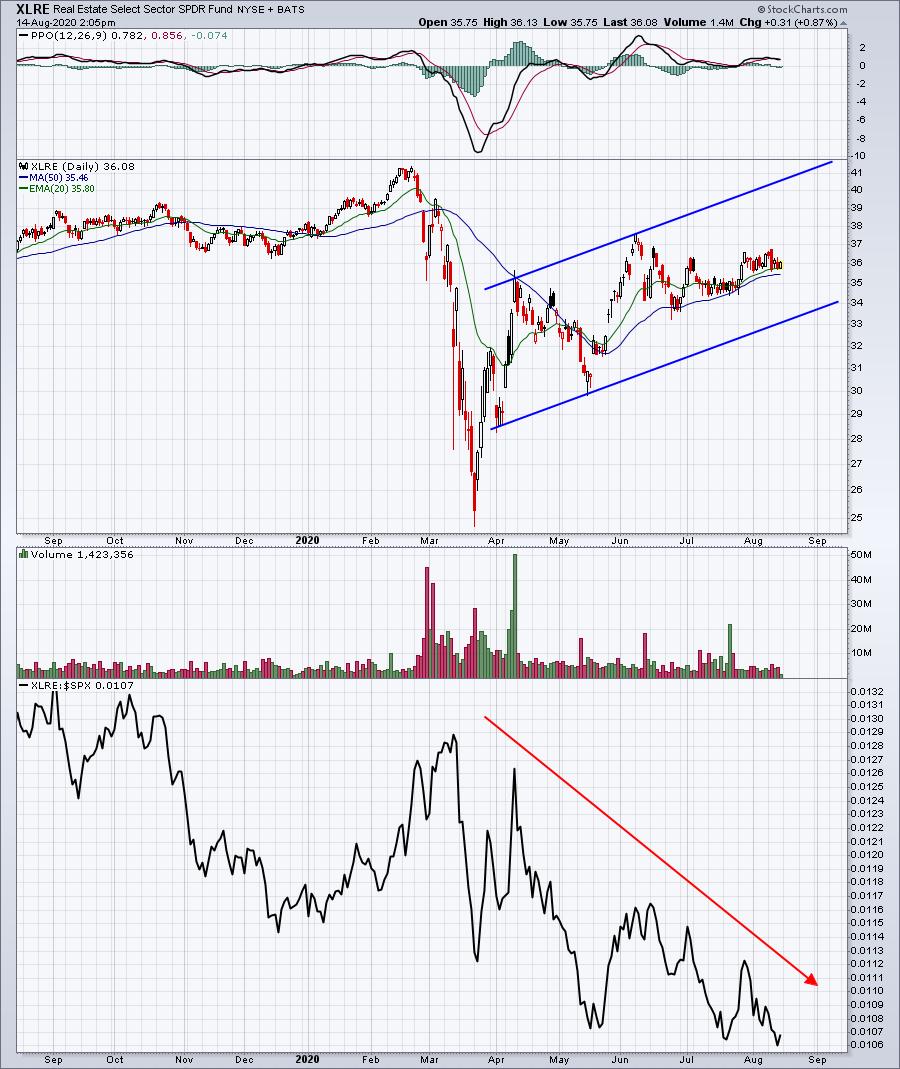
There's no denying that the XLRE is trending higher right now, but look at the relative weakness. It's very difficult to even keep up with the S&P 500 if you're trading real estate stocks right now. It's why I'd continue to avoid defensive sectors. They are all downtrending on a relative basis.
ChartLists
I manually flipped through our Strong Earnings ChartList and found the following charts to be of technical interest:
MS:
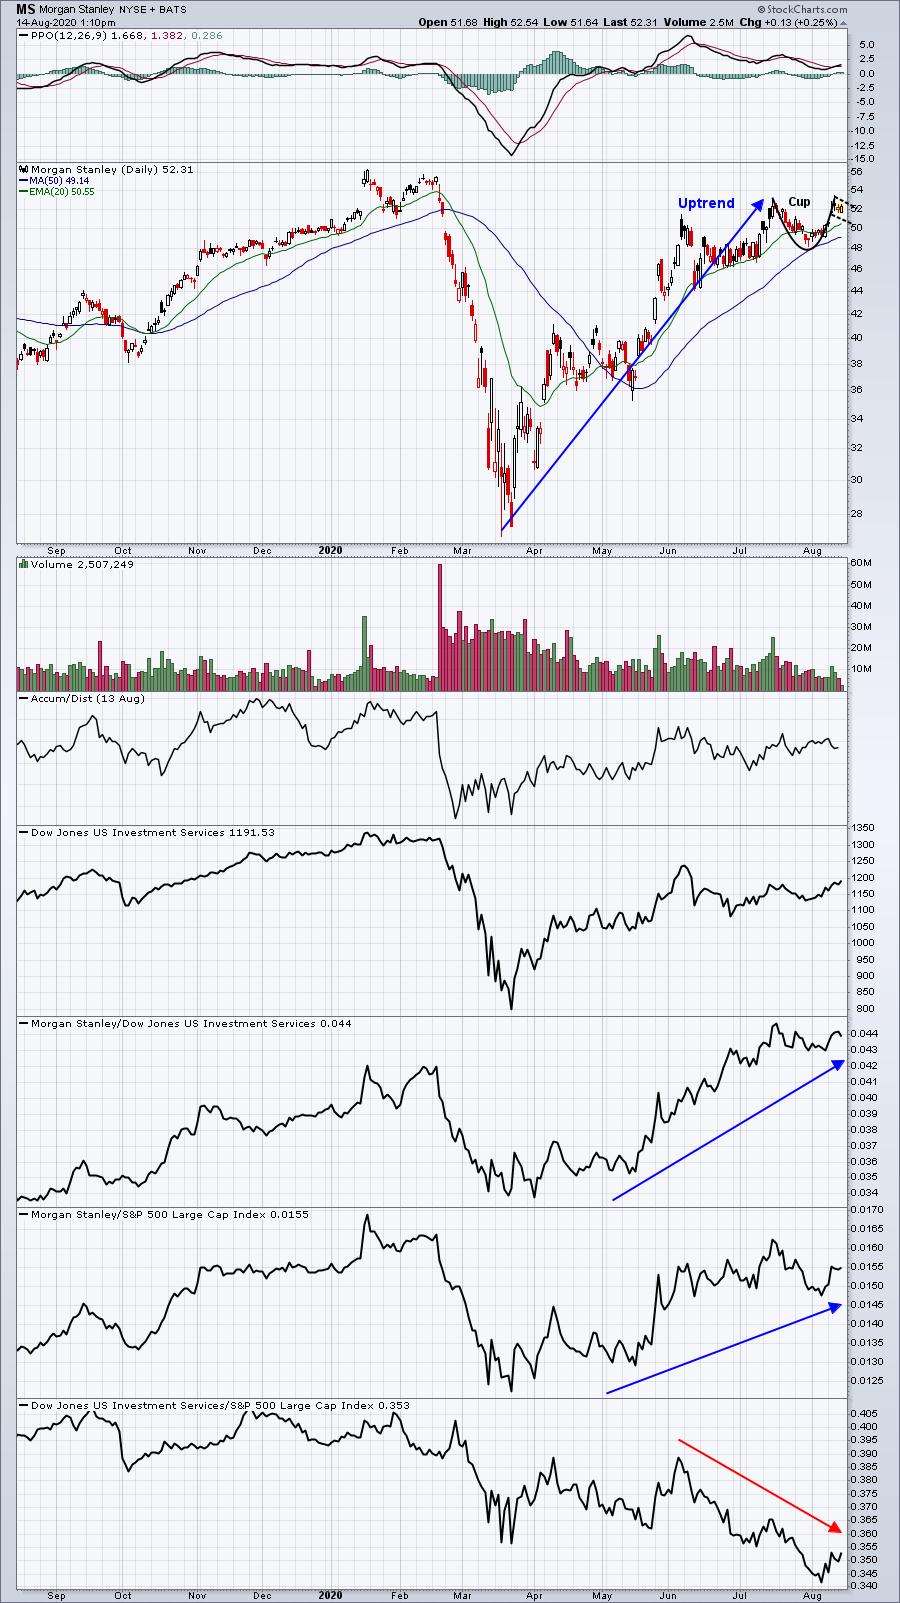
Despite being part of a weak investment services group ($DJUSSB), MS has been able to outperform the S&P 500 due to its industry relative strength. Currently, it appears to be pulling back in a handle after a recent cup formed. I'd be looking for a breakout above 53, which would measure to approximately 58.
FFIV:
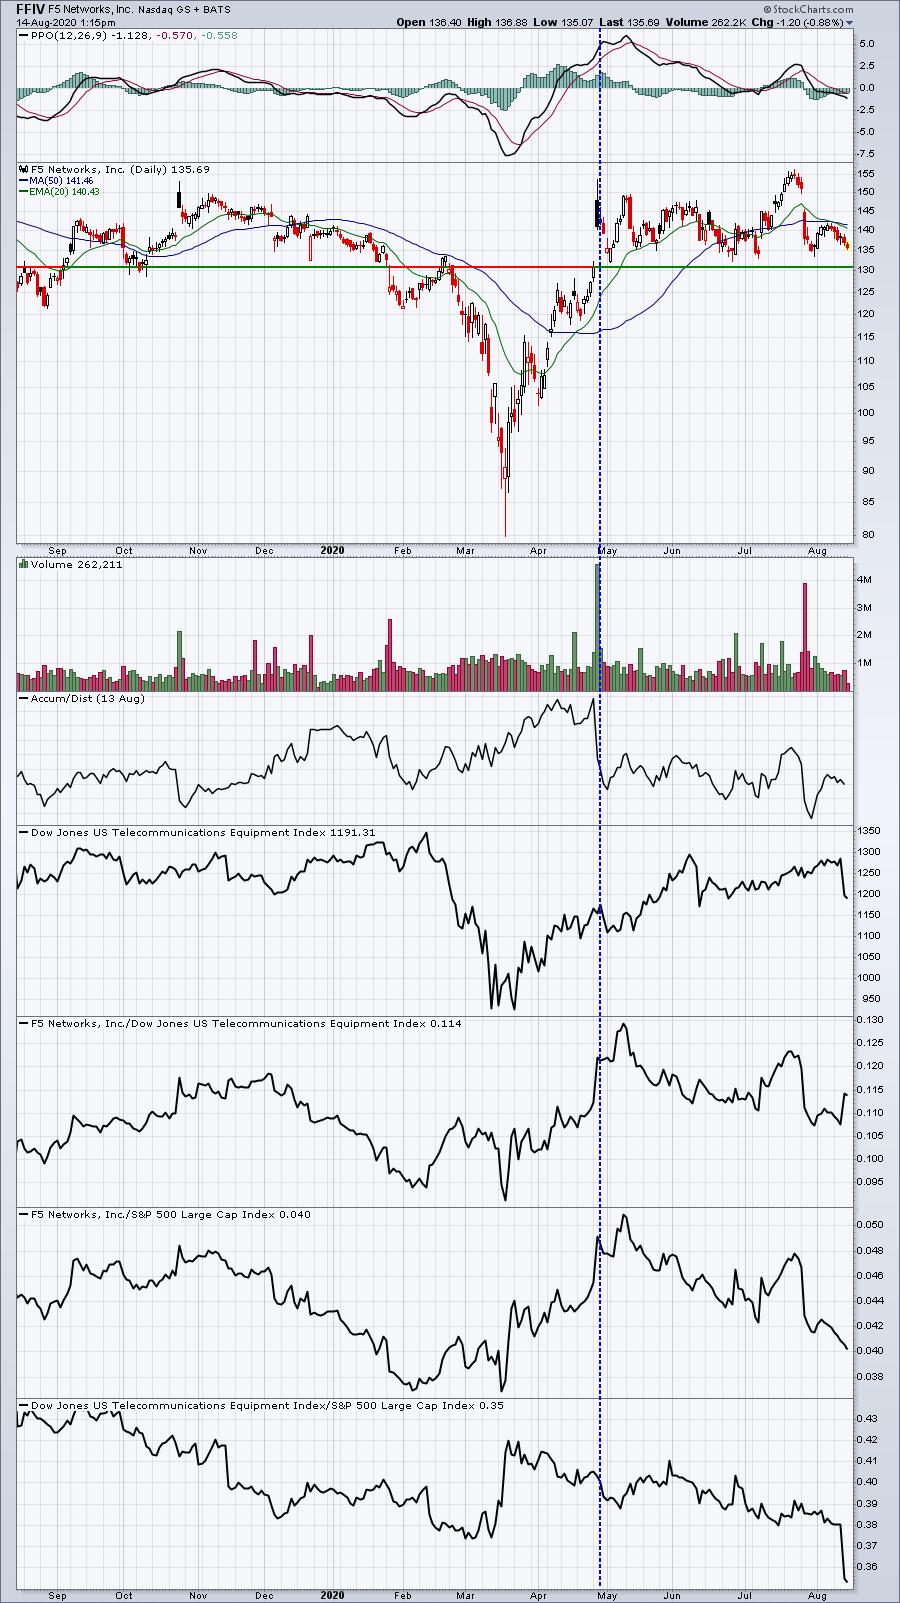
I'd watch for a potential reversing candle like a hammer or a bullish engulfing candle as FFIV approaches key gap support near 130. The stock has bounced multiple times from just above this support level. I realize the relative strength has tailed off, but ever since the huge gap higher back in late-April, FFIV has mostly been consolidating. It needs to hold this support.
EBAY:
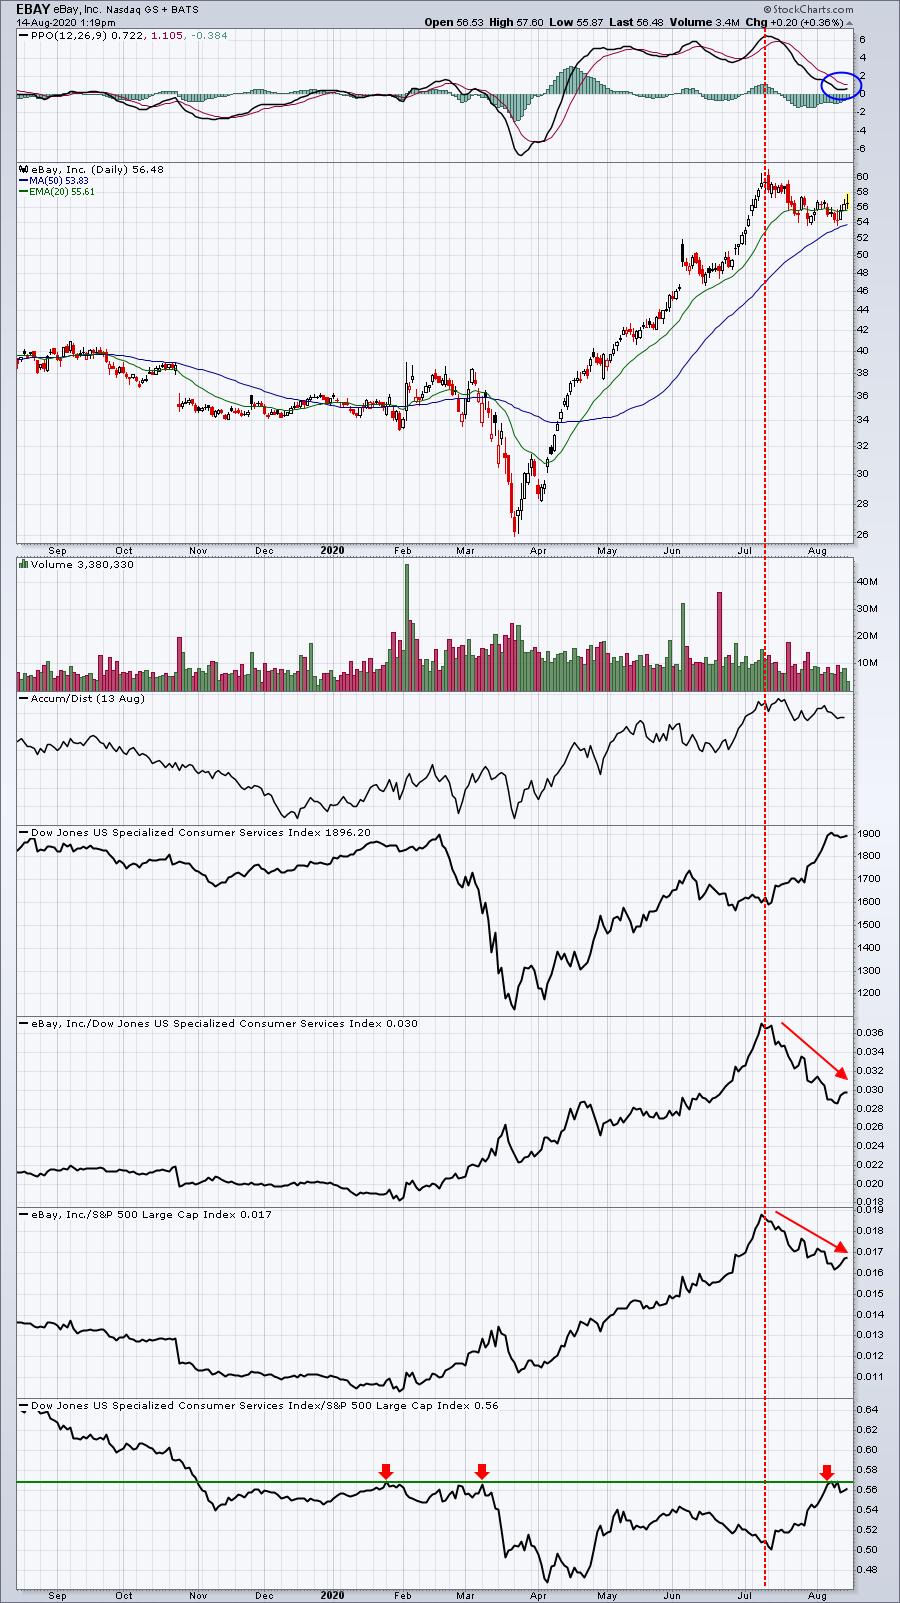
EBAY's relative strength has diminished while it's been consolidating. It does appear as though it's broken its recent downtrend, however. Watch for its industry group (bottom panel) to break out vs. the S&P 500. If that occurs, EBAY could very well be starting its next leg higher.
ROK:
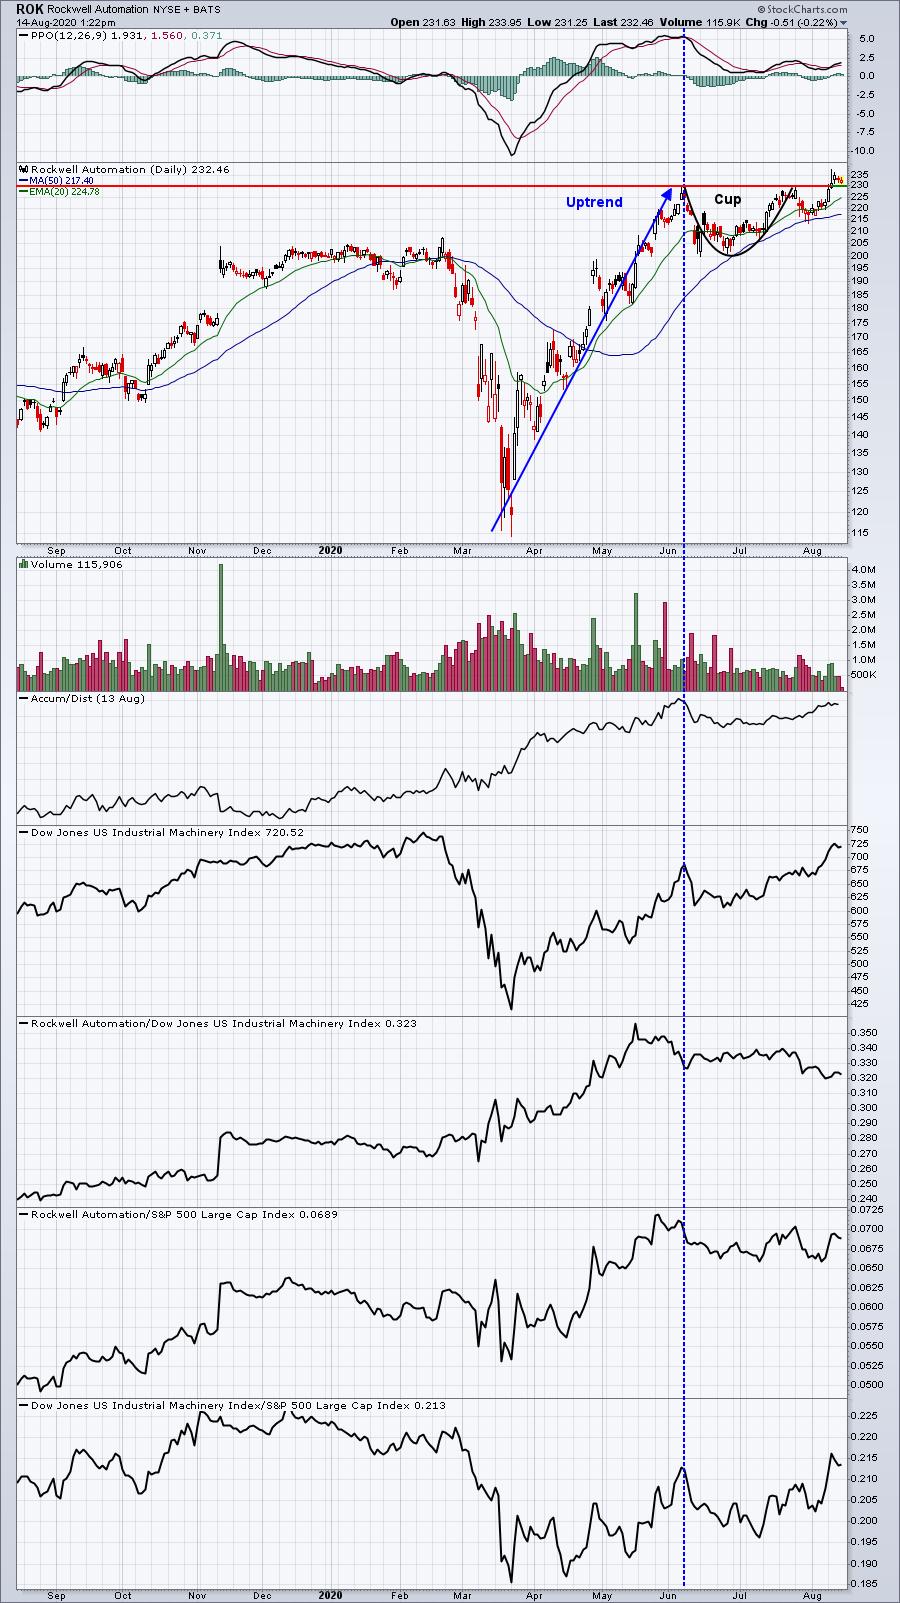
ROK consolidated in a cup with handle pattern before just recently breaking out. I like the stock from its breakout level just below 230 down to its rising 20 day EMA.
CRTO:
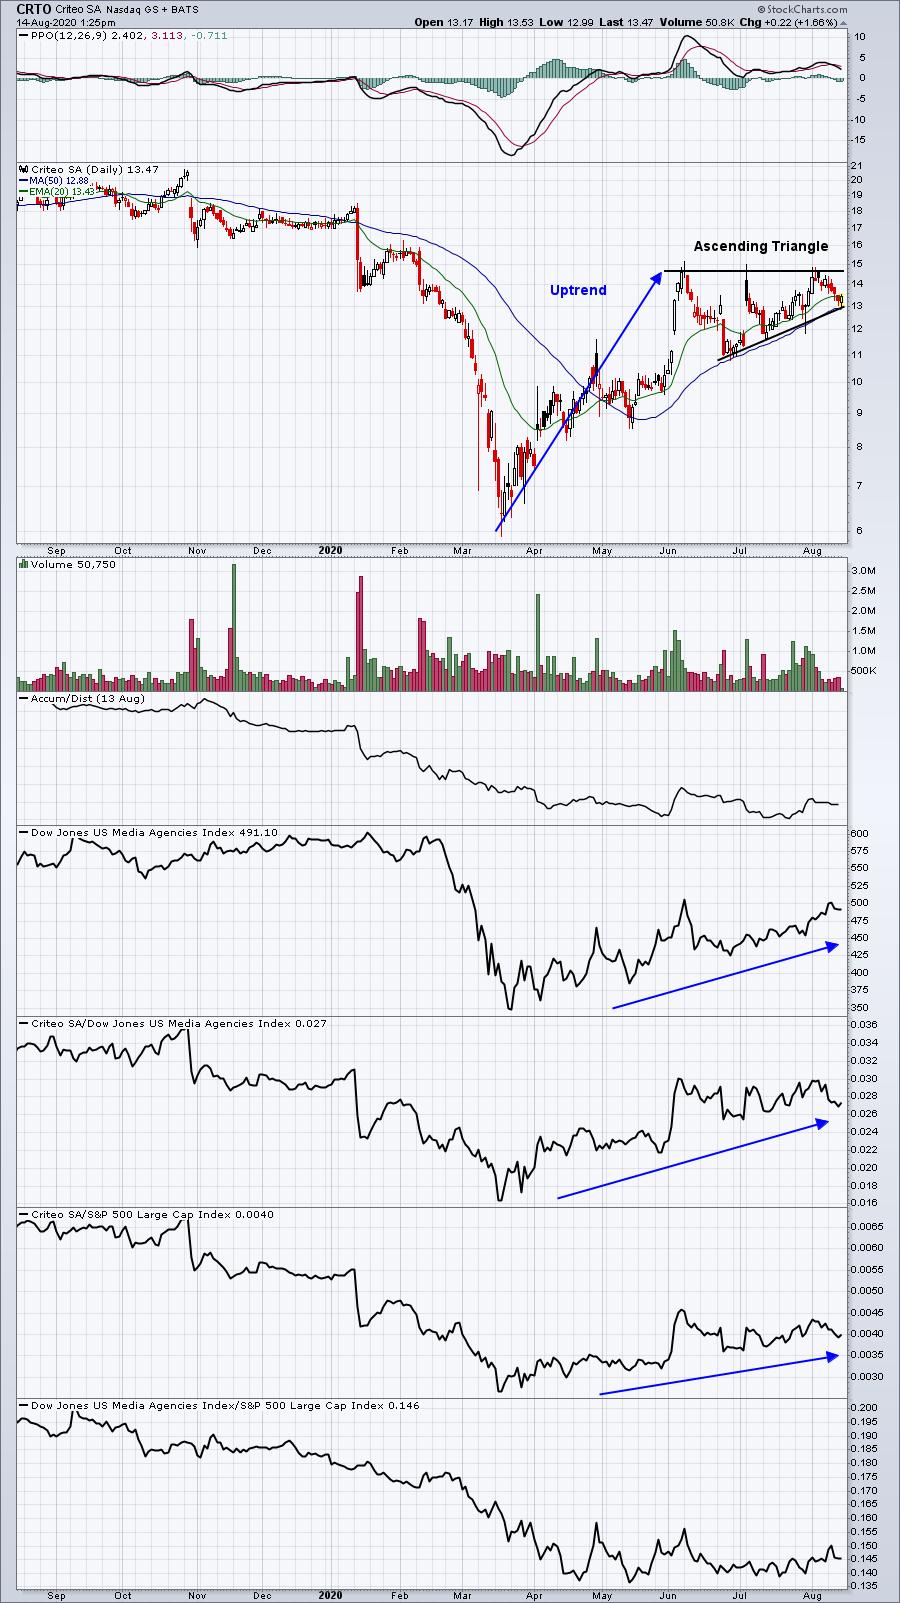
CRTO has raised its guidance twice in the past quarter and its relative strength has been rising. After its uptrend from March to early-June, CRTO has been consolidating in a very bullish ascending triangle pattern. I'd expect to see a breakout to the upside.
UCTT:
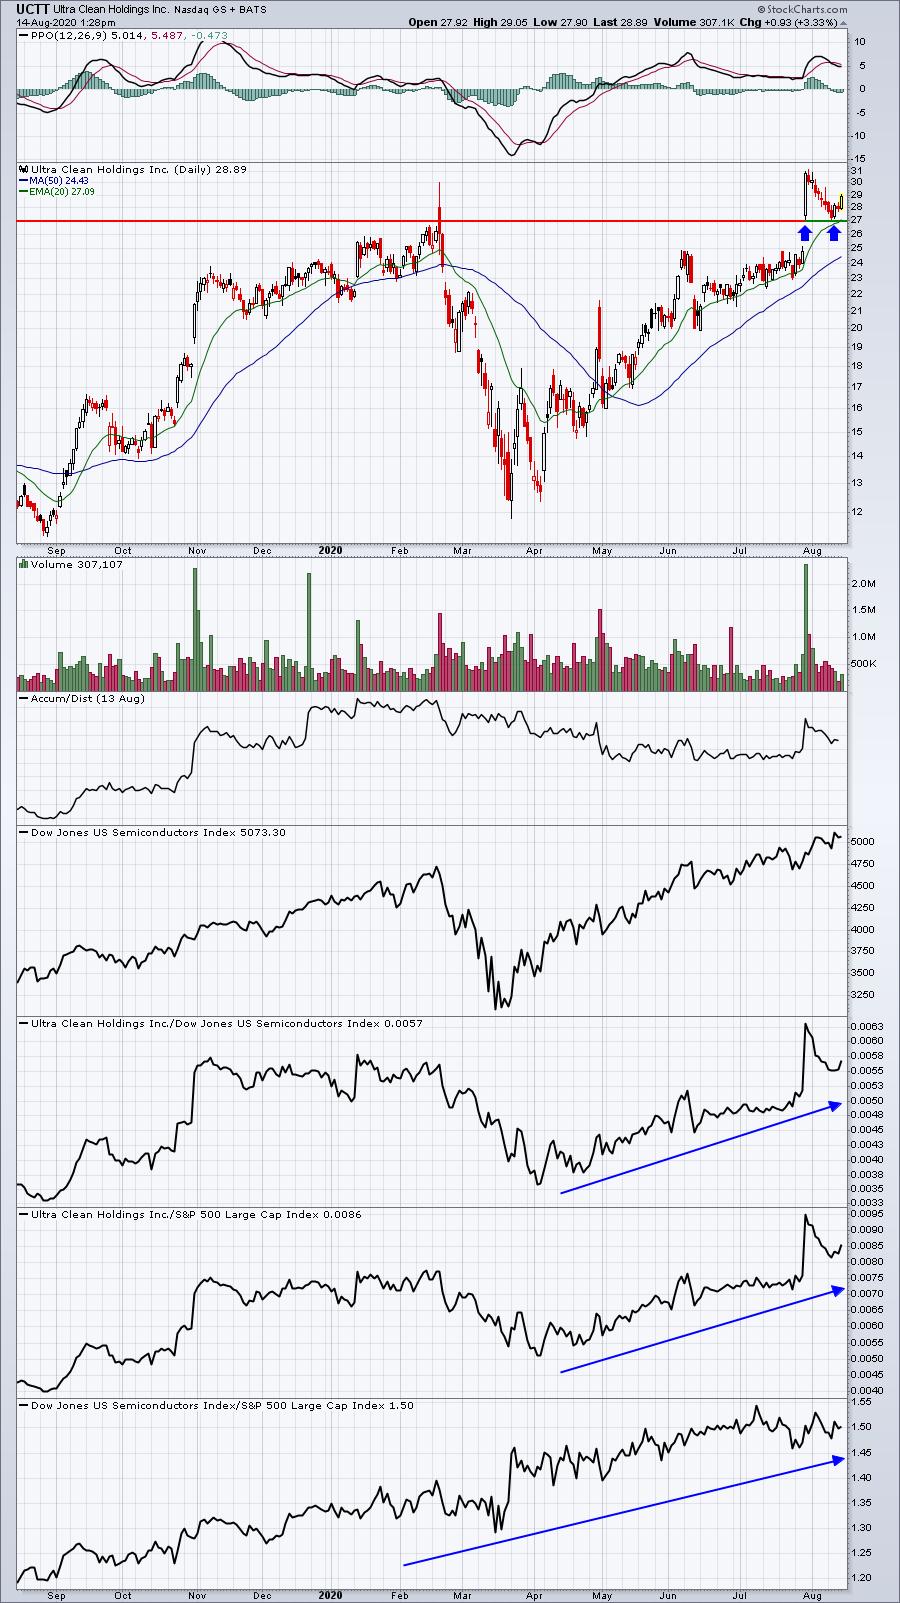
UCTT is a perfect example of how I like to trade earnings gaps. When a company like UCTT posts better-than-expected results and gaps higher, the tendency is for the stock to eventually fill back to the prior day's close. Instead, UCTT kept rising. That tells me that the top of gap support is more likely to be where buyers return upon short-term profit taking. The above chart perfectly illustrates this.
TEAM:
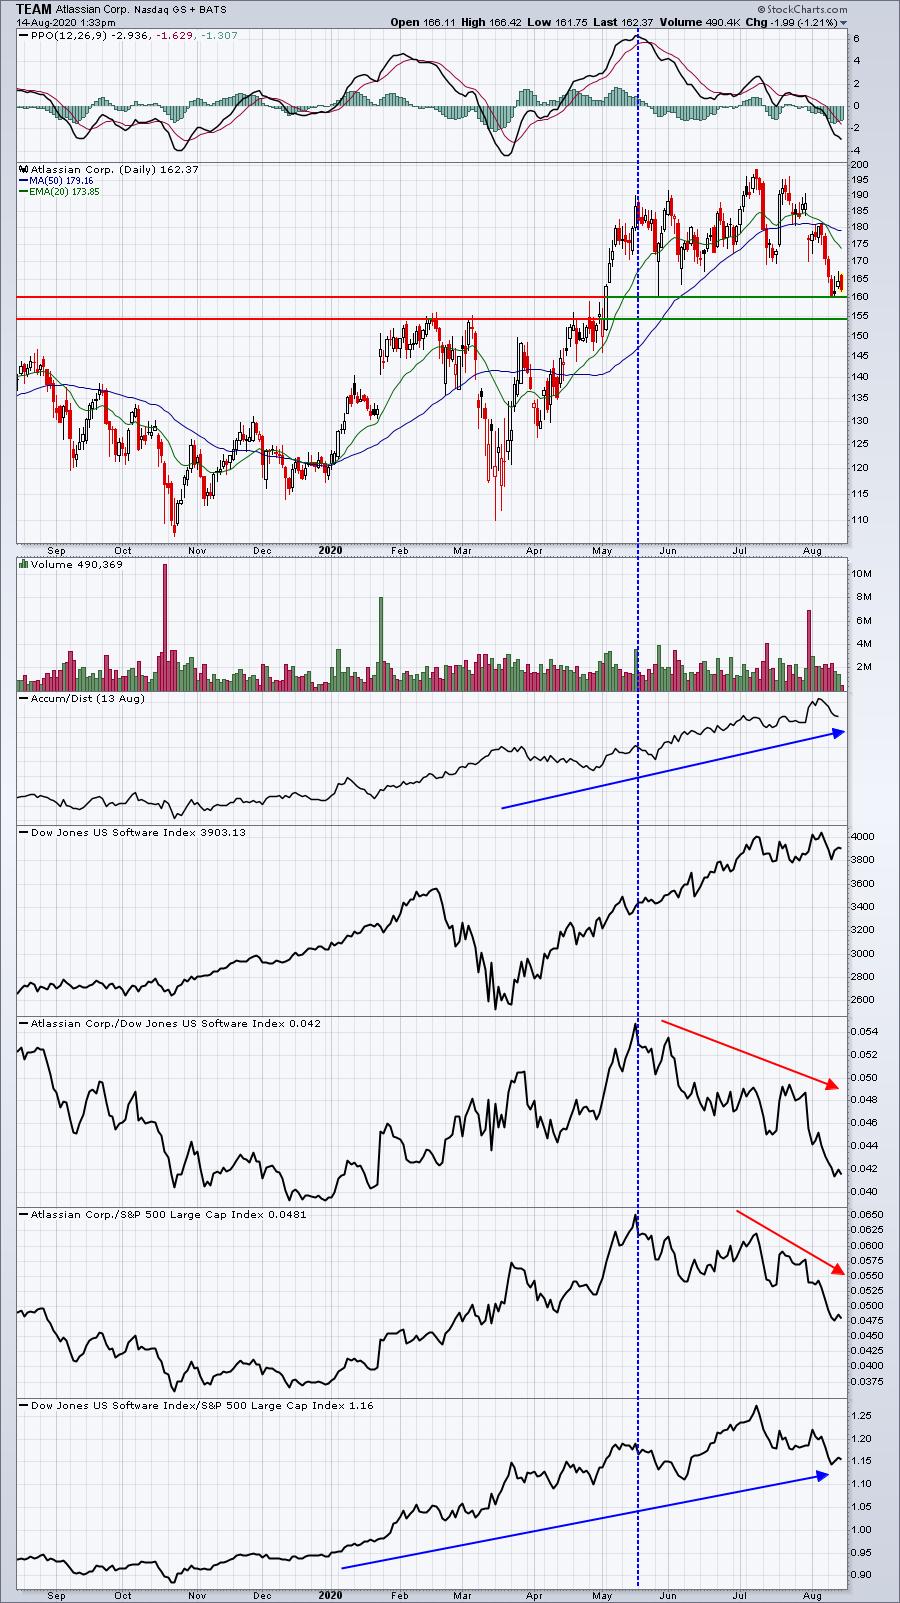
First, it's important to note that software stocks ($DJUSSW), in general, have been weak of late. I expect that to change sooner rather than later. Stocks like TEAM could benefit greatly from that relative strength reversal, if it were to occur. TEAM is also just now reaching a critical support zone from 155-160. I wouldn't overlook the AD line, which remains quite strong despite the recent pullback.
Earnings Reports
Here are the key earnings reports for today and tomorrow, featuring stocks with market caps of more than $10 billion. I also include a few select companies with market caps below $10 billion. Finally, any portfolio stocks (or active trade alerts) that will be reporting results are highlighted in BOLD. If you decide to hold a stock into earnings, please understand the significant short-term risk that you are taking. Please be sure to check for earnings dates for any companies you own or are considering owning:
Friday, August 14:
DKNG, MSGS, MSGE
Monday, August 17:
JD, FN, NIU
Economic Reports
July retail sales: +1.2% (actual) vs. +2.0% (estimate)
July retail sales less autos: +1.9% (actual) vs. +1.5% (estimate)
Q2 productivity: +7.3% (actual) vs. +1.0% (estimate)
July industrial production: +3.0% (actual) vs. +3.0% (estimate)
July capacity utilization: 70.6 (actual) vs. 70.3 (estimate)
June business inventories: -1.1% (actual) vs. -1.2% (estimate)
August consumer sentiment: 72.8 (actual) vs. 71.9 (estimate)
Happy trading!
Tom