
EB Daily Market Report - Monday, August 17, 2020
Annual Membership Special Extended Through Today
Trial members asked for a bit more time to decide, so we agreed to extend our annual anniversary special through today. This is it. It's our best annual deal of the year - $697 for 14 months (2 bonus months) - and it will expire tonight! That's less than $50 per month and can save you a bundle. The special began at last Monday's "Top 10 Stocks - Sneak Preview" event and has been extended through today. We'll likely have a similar fall special in a few months, so this special would mostly apply to the following:
- monthly members paying $97 per month
- members currently enjoying their 30-day trial
- annual members whose subscription will expire within the next 2-3 months
To clarify, for those currently on a no-cost trial, you will still receive the balance of your free trial and THEN the 14 months would be added on to the end of your trial.
If interested and you have any questions, please be sure to contact "[email protected]".
Strong Earnings ChartList - Updated
The SECL has been updated and it now has 483 (!!!) charts on it. This is, by far, the most companies ever on the SECL. There are probably several reasons for it, but the two most likely are:
- Expectations were lowered considerably due to the pandemic, allowing more companies to beat estimates
- More sectors are industry groups are turning bullish, providing more opportunities for strong technical charts
If you're at least an "Extra" member at StockCharts.com, you can download this ChartList into your SC.com account from our ChartLists page at EarningsBeats.com. Be sure to use the password that we provide next to the link. Do NOT use your EarningsBeats.com password or your StockCharts.com password. You must use the specific password that we provide for each ChartList.
Executive Market Summary
- Futures were higher, but that early bullishness faded on the Dow Jones; strength remains on the NASDAQ
- Energy, airlines, and cruise lines litter the S&P 500 losers today
- Strength can be found in large cap semiconductor names as both NVIDIA (NVDA) and KLA Corp (KLAC) help to lead the NASDAQ and S&P 500 higher
- The U.S. Dollar (UUP) is falling again today as gold ($GOLD) nears $2000 per ounce and silver ($SILVER) surges nearly 6%
- Crude oil ($WTIC) is also higher by 1.7% to nearly $43 per barrel
- Consumer discretionary (XLY, +1.05%) is having a very solid day behind autos ($DJUSAU, +7.01%) and home construction ($DJUSHB, +3.53%)
- Retailers (XRT, +2.08%) are also having a strong day
Market Outlook
I receive a lot of questions about the Volatility Index ($VIX) and its impact on U.S. equities. Some of the greatest buying opportunities are created when the VIX reaches extreme levels. Why? Because there is so much fear in the market, prices are discounted beyond what's reasonable. The March pandemic was the absolute perfect example as the VIX surged to 85, nearing levels not seen since the midst of the financial crisis. Did that financial crisis and extreme fear create a great buying opportunity? What about the 2020 pandemic - did that create a great buying opportunity?
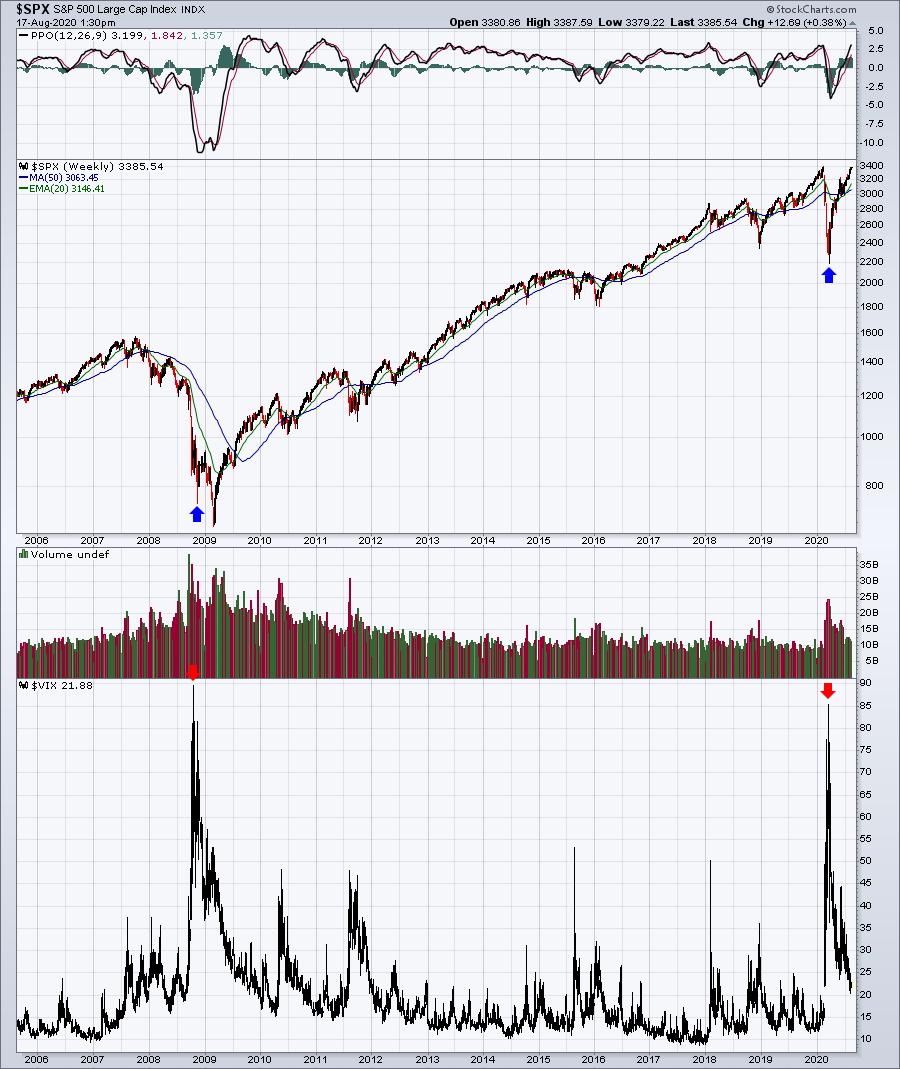
Those extreme VIX readings represented the two best buying opportunities of this generation. Fortunately, we don't see fear like that very often, but history teaches us to be calm and patient, because it will ultimately pass. Remember Warren Buffett's quote, "Be greedy when others are fearful". Those are words to trade by.
I've also heard from many who now claim the market must selloff because everyone's too complacent. They say everyone's bullish. Ummm, the VIX is still near 22. Complacency should be considered when we approach 10. If anything, I'd say that the market remains quite fearful and pessimistic, which will likely limit any downside action on pullbacks. Use this sentiment indicator to your advantage.
Sector/Industry Focus
Home construction ($DJUSHB, +3.53%) enjoyed yet another strong jump this morning after the August housing market index surged to 78 (Wall Street was only expecting a reading of 72). It may be hard to believe, but that 2005 top is now in our rear view mirror:
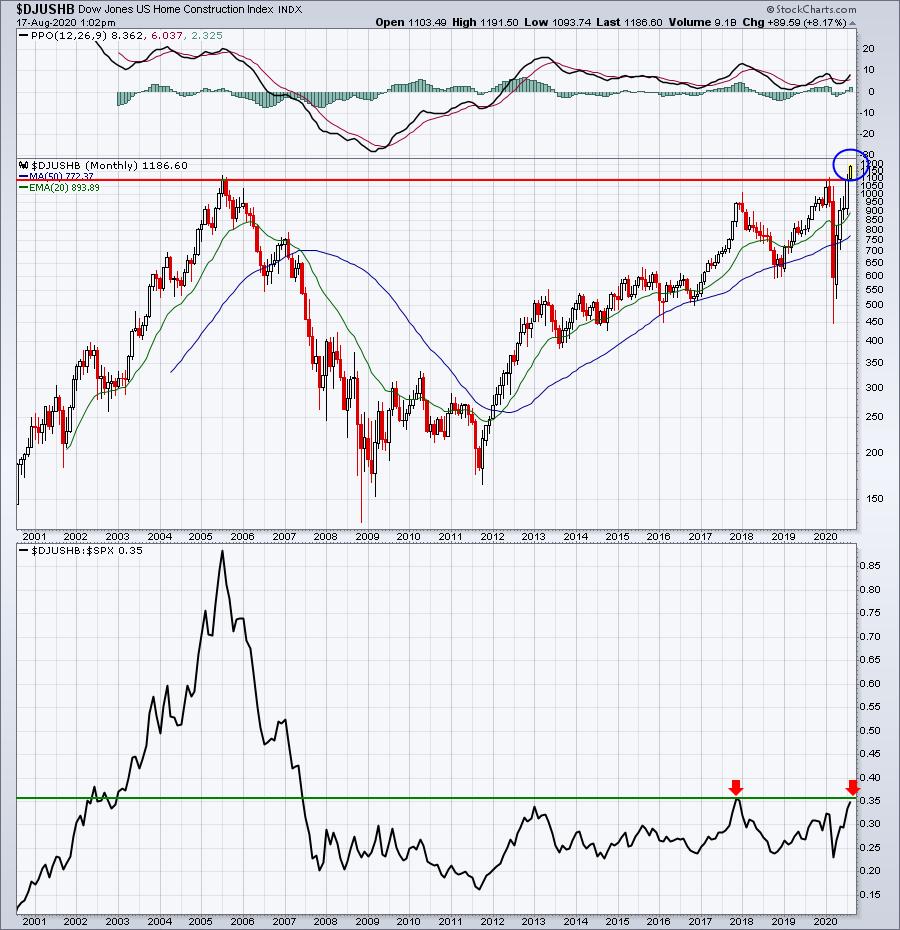
This group is on the verge of a 13-year relative breakout, which would only add to an already bullish picture. Interest rates remain near historic lows AND our economy is showing improvement. That's a powerful combination and the home construction chart is reflecting this.
ChartLists
Today, I looked for high volume stocks and I did so by reviewing all of our 6 ChartLists. I wanted to find any stocks that had already seen its normal daily volume printed before the halfway point of the trading day, which is 12:45pm ET. Here was the scan syntax I ran:
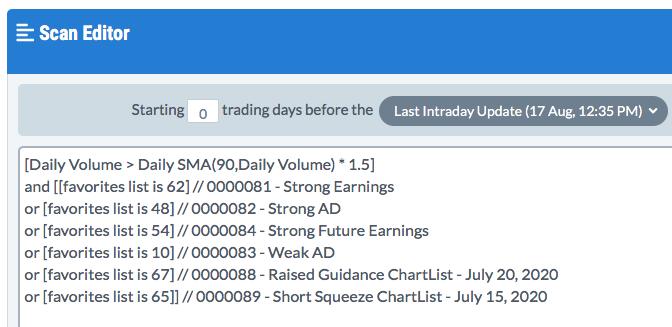
Note two important keys here. First, I changed the "and" to "or" for the ChartLists. If I left "and", a stock would have to be on ALL of these ChartLists to be included. That scan would have returned 0 stocks because no single stock is on every ChartList. Next, please realize that my ChartLists are uniquely numbered in my StockCharts.com account. While my Strong Earnings ChartList is recognized in my account as "favorites list is 62", it might be "favorites list is 14" in your account. Therefore, if you simply copy this scan syntax into your account, it won't work. You must physically add each ChartList to the scan syntax using the dropdown boxes on the scan page at StockCharts.com.
Here were the 10 stocks that have already traded at least 150% of normal daily volume just before today's halfway point:
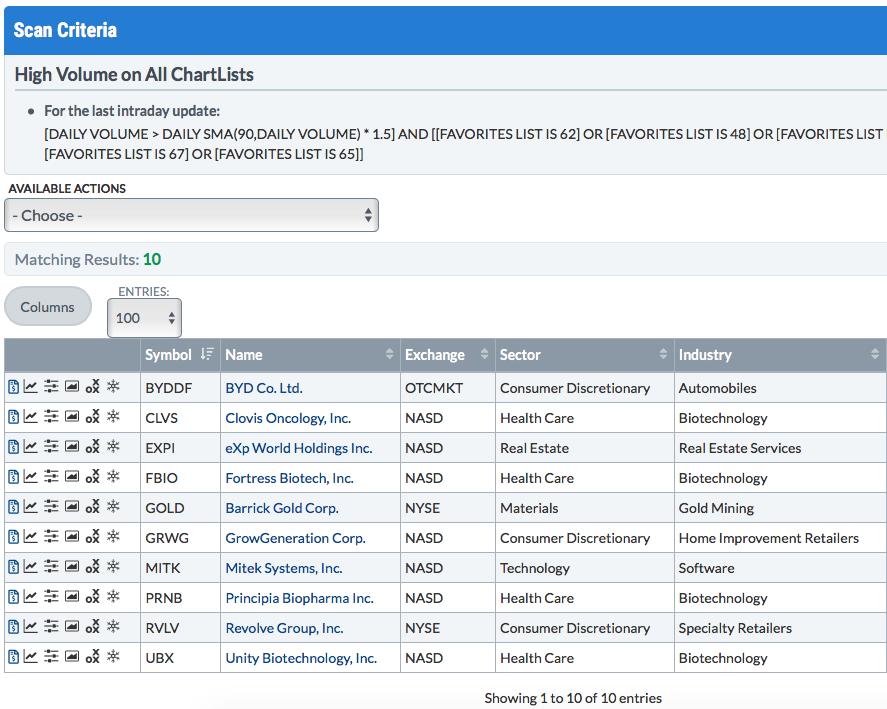
Let's look at these 3 VERY aggressive stocks:
FBIO:
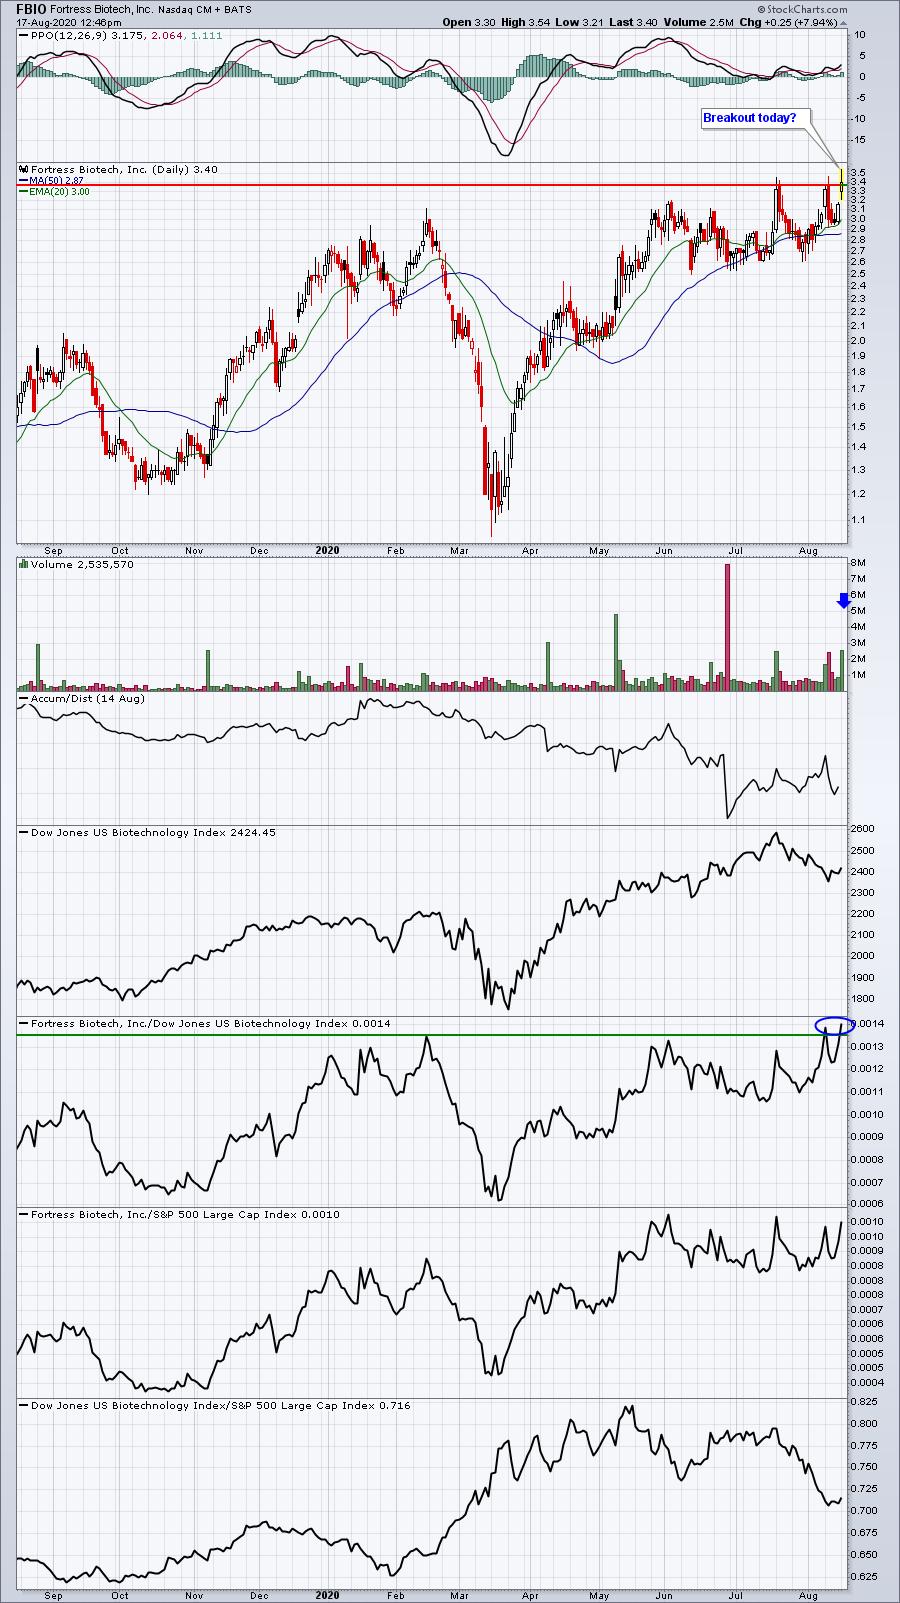
Small biotechs can be incredibly volatile. So they can be very rewarding......or very devastating. Understand the risks before trading. However, FBIO is trading in very bullish fashion and a confirmed close above 3.40 would represent a breakout. Daily volume is likely to be the 2nd or 3rd highest of the year.
GRWG:
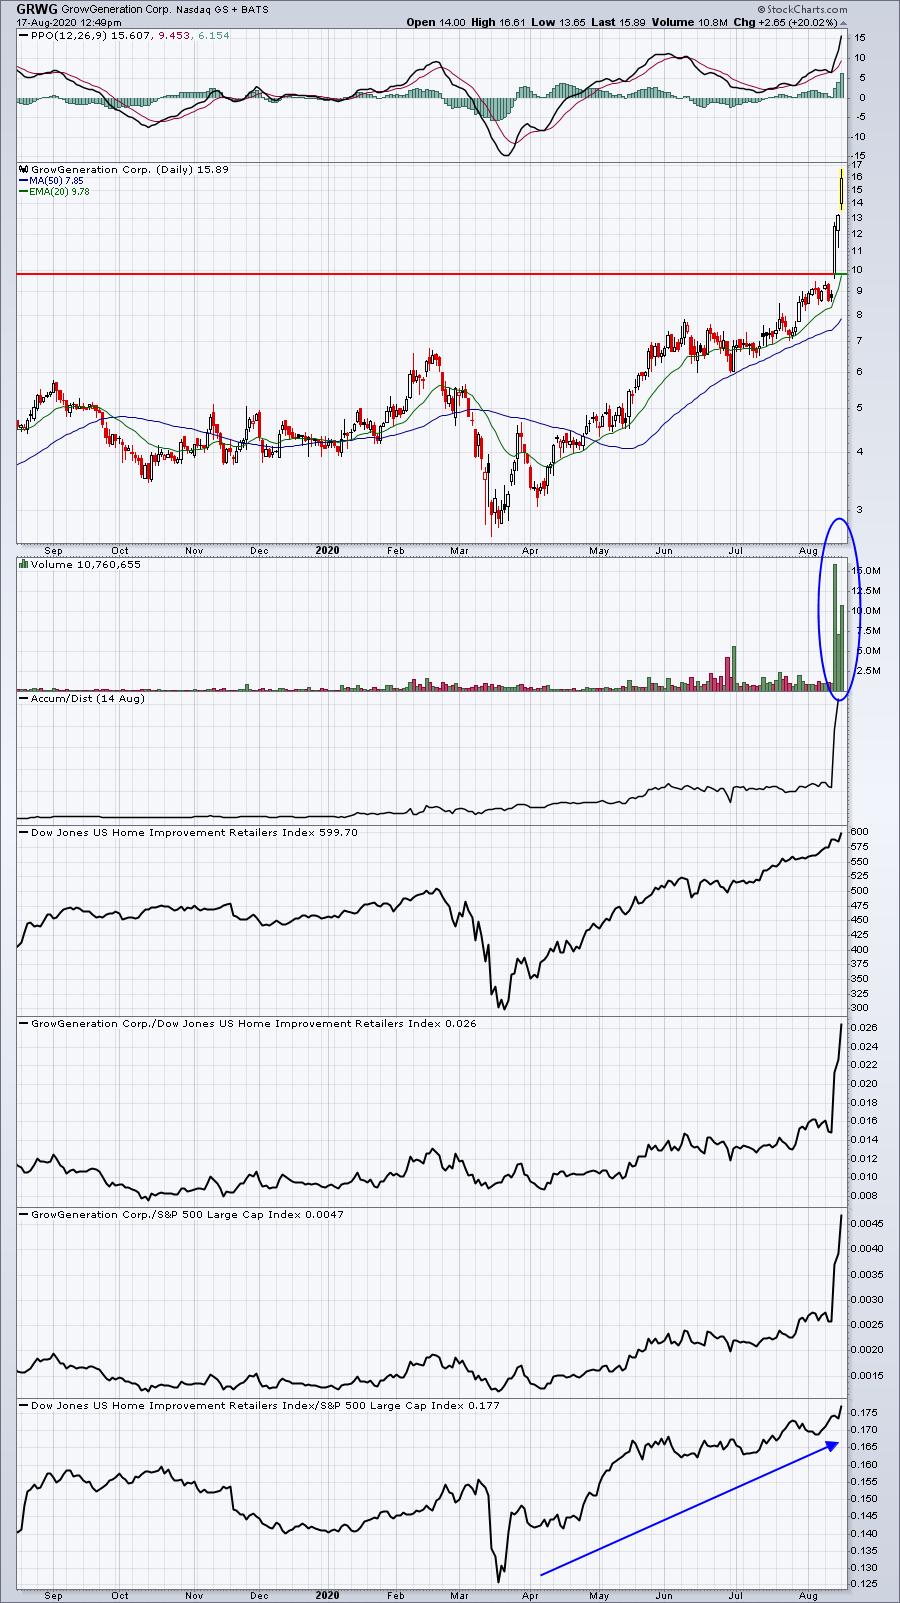
And I thought last week's volume was high! Home improvement retailers ($DJUSHI) have been among the best performing industry groups of 2020. It doesn't hurt that GRWG is leading the entire group right now. Jumping on board right now after an 80% rise in 3 days doesn't seem like a great idea; however, when things settle down, don't forget what appears to be significant accumulation taking place.
RVLV:
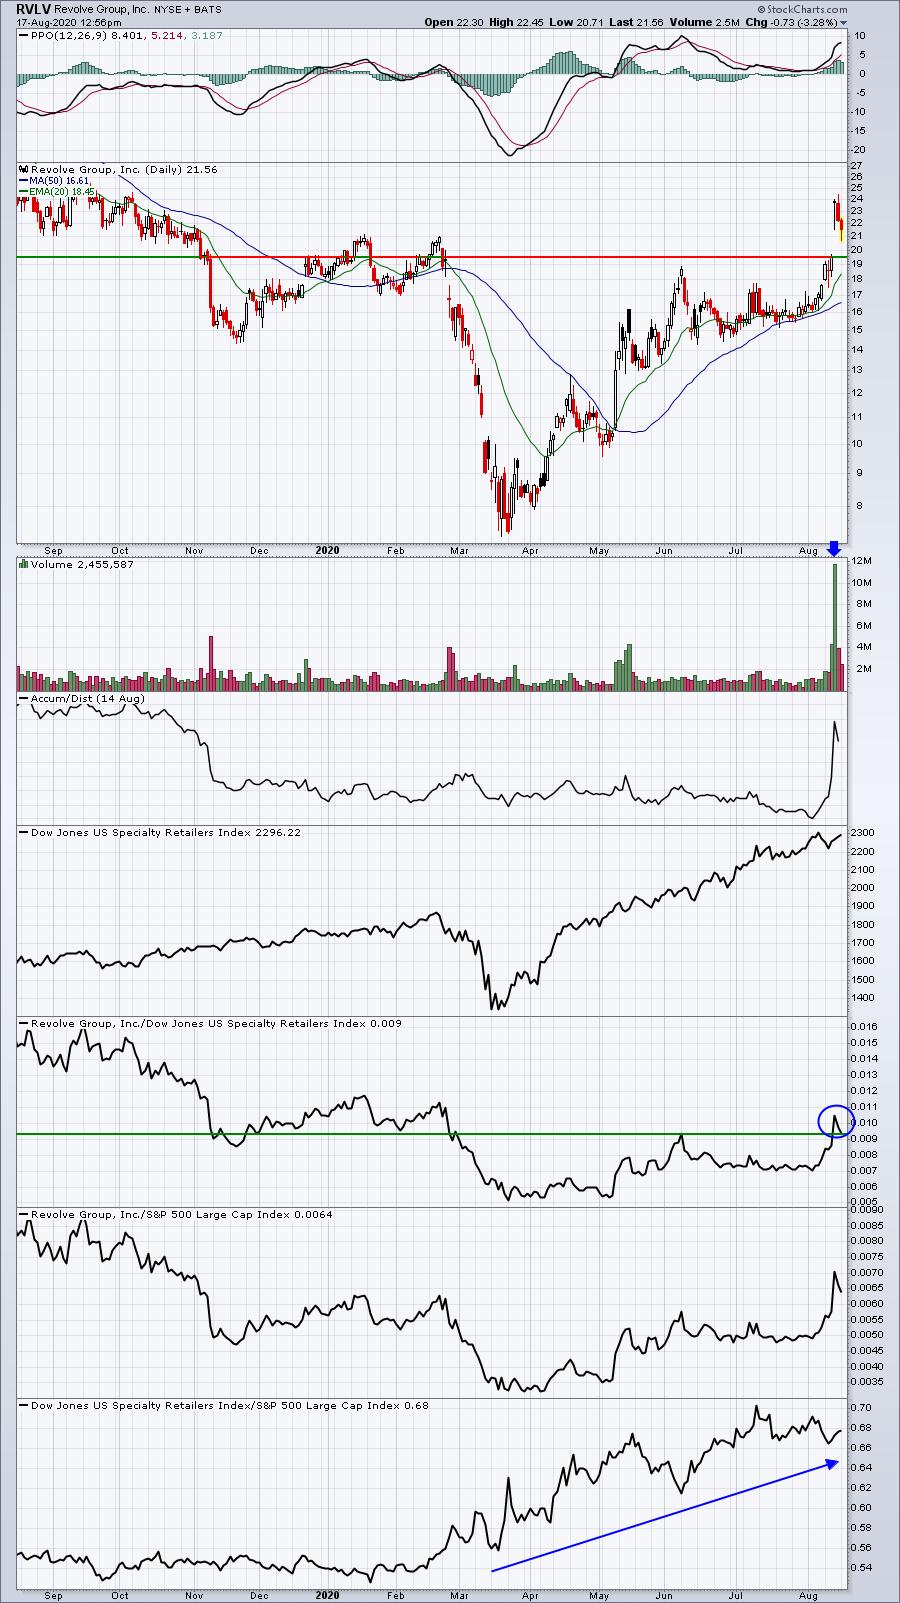
This specialty retailer ($DJUSRS) blew away EPS estimates last week and several analysts raised their targets here. But after that massive gap higher on Thursday, RVLV settled down and it's now moved, on an intraday basis, below Thursday's low. I could see this one filling its gap, where it would become very attractive from an aggressive long perspective.
Earnings Reports
Here are the key earnings reports for today and tomorrow, featuring stocks with market caps of more than $10 billion. I also include a few select companies with market caps below $10 billion. Finally, any portfolio stocks (or active trade alerts) that will be reporting results are highlighted in BOLD. If you decide to hold a stock into earnings, please understand the significant short-term risk that you are taking. Please be sure to check for earnings dates for any companies you own or are considering owning:
Monday, August 17:
JD, FN, NIU
Tuesday, August 18:
WMT, HD, SE, A, AMCR, JACK, GDS, AAP, CREE, KSS, LZB
Economic Reports
August empire state manufacturing survey: 3.7 (actual) vs. 17.0 (estimate)
August housing market index: 78 (actual) vs. 72 (estimate)
Happy trading!
Tom