
EB Daily Market Report - Tuesday, August 25, 2020
Executive Market Summary
- Futures were higher this morning, much more so on the Dow Jones and S&P 500
- Yesterday, we saw the NASDAQ strong on a relative basis at the open, then weaken; today, it's been the opposite - the NASDAQ opened weak on a relative basis, but has strengthened since
- The 10 year treasury yield ($TNX) surged after a much-better-than-expected new home sales report
- The U.S. Dollar (UUP) began the day weak, but has since recovered much of its early loss
- Salesforce.com (CRM), Honeywell (HON), and Amgen (AMGN) will all be added to the Dow Jones next Monday; they'll replace Exxon Mobil (XOM), Raytheon (RTX), and Pfizer (PFE)
- Best Buy (BBY) reported strong results, beating top and bottom line estimates and it's reward is being the worst performer in the S&P 500, down 4.41% at last check (buy on rumor, sell on news at play here)
- Biotechs ($DJUSBT) and internets ($DJUSNS) leading health care (XLV) and communication services (XLC), respectively, to the top of the sector leaderboard
Market Outlook
Options expiration has done little to create a short-term bearish market environment. In fact, the equity only put call ratio ($CPCE) has been printing very bullish readings day-after-day-after-day. Of course, the CPCE is a sentiment reading that is also known as a contrarian indicator. When too many market participants believe something is very attractive.....it usually isn't. The Volatility Index ($VIX) is another sentiment indicator and any time it's above 20, it's indicative of higher-than-normal volatility. Check out both of these sentiment indicators, using a 5 day SMA:
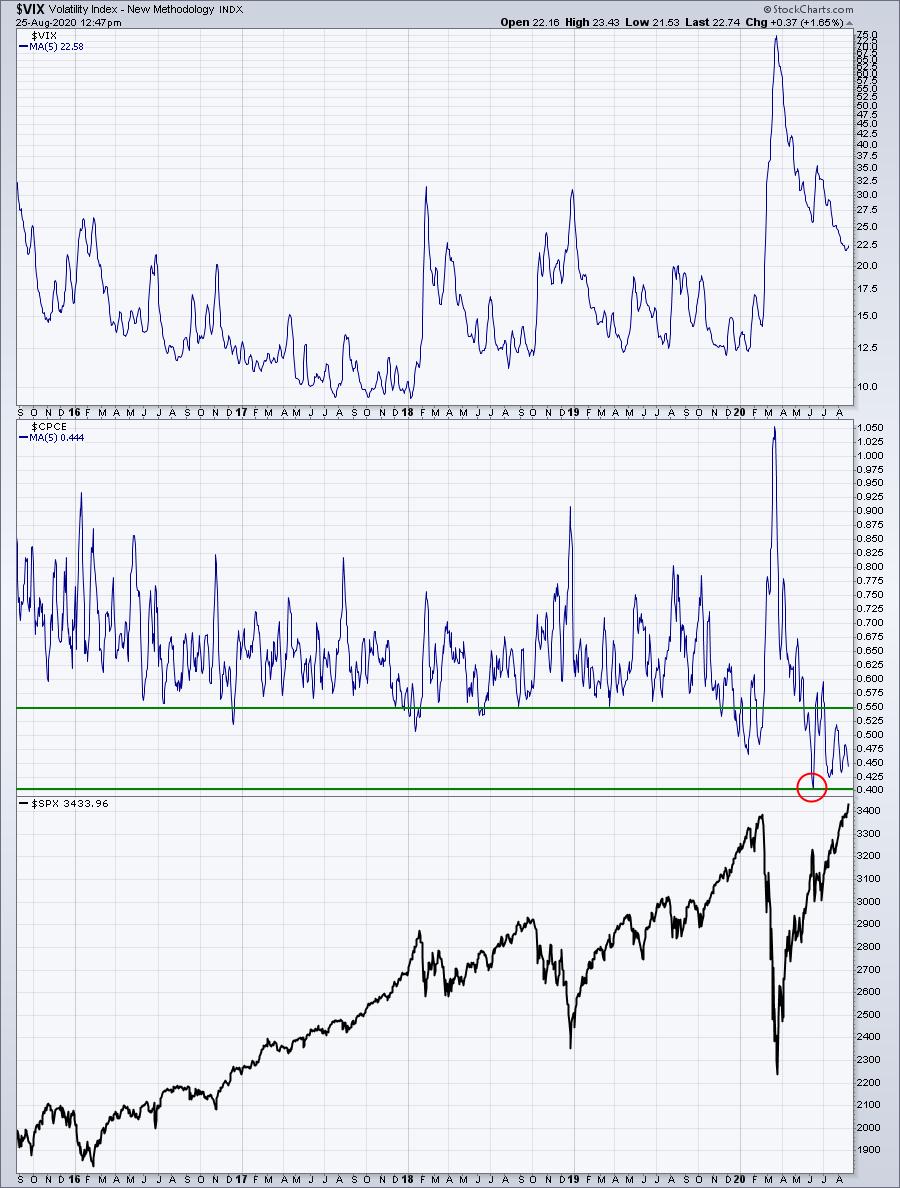
I'd say my biggest concern about the market is short-term and is based upon these two sentiment indicators, especially the CPCE. Historically, 5 day SMAs beneath .55 cause concern. We're now at .44. The pricing of options, however, is based on the amount of volatility. When the VIX is high, there is more premium to pay on options, so market makers are at least pocketing more premium to offset the relentless pursuit of higher prices. I do still worry about a short-term selling event at any time, but trying to predict the exact timing in a runaway bull market is extremely difficult.
Sector/Industry Focus
I've discussed the strength in consumer discretionary stocks (XLY) quite a bit lately, but the "other" consumer stocks - staples (XLP) - are also in breakout mode and moving higher:
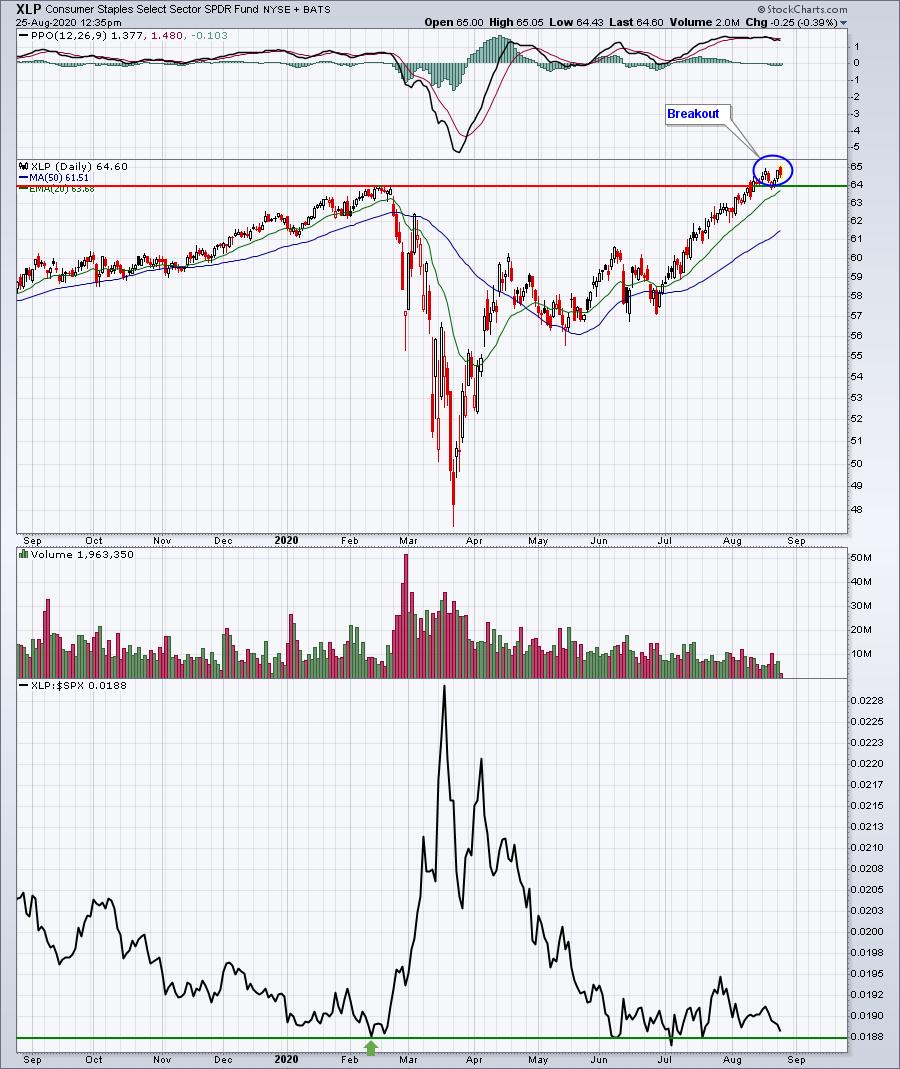
The reasoning for avoiding consumer staples stocks in our portfolios (Clorox was the only consumer staples name to make our list) isn't that they're not going higher. The reason is clear in that bottom panel. The XLP is near a 52 week relative low vs. the S&P 500. If we want to outperform the S&P 500, we need to be in areas that are outperforming. Unfortunately, consumer staples are failing to outperform, despite moving higher.
ChartLists
Just past noon today, I ran the Downtrend Reversal scan against our key ChartLists - Strong Earnings, Strong Future Earnings, Strong AD, and Raised Guidance. There were only 7 stocks that met the scan's criteria of printing a higher high today after printing lower highs for each of the past 5 trading sessions. They were as follows:
AMGN, DFIN, HLIT, ICHR, IIVI, LRN, STE. I feel like two of these are bouncing off key technical support levels as well:
DFIN:
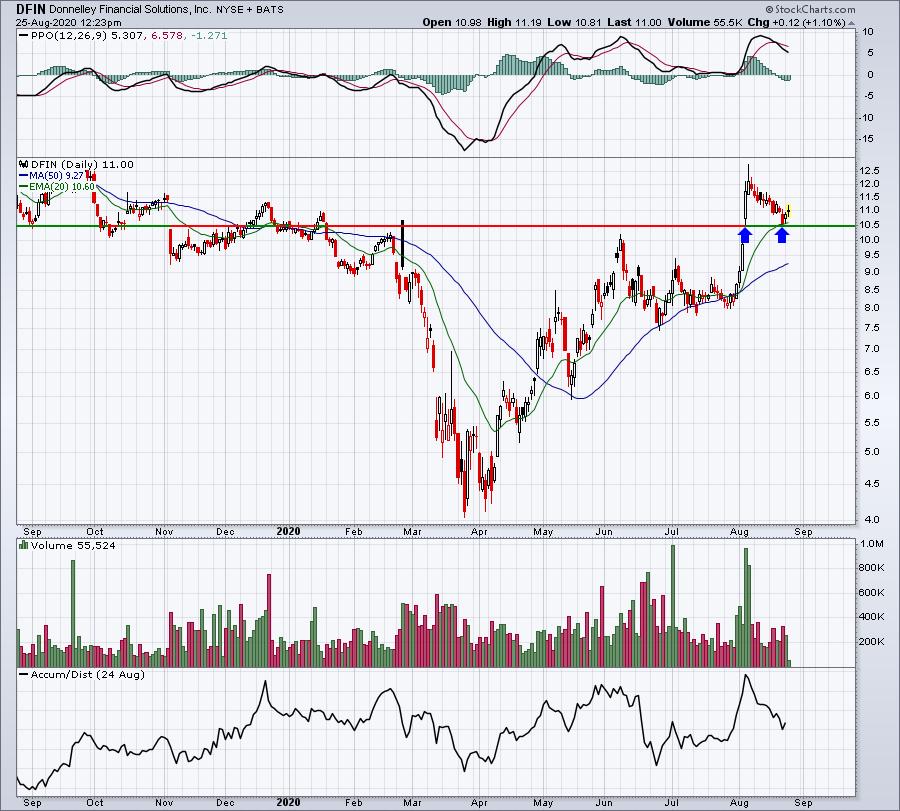
DFIN is not only reversing its downtrend, but it's also bouncing from key gap support and its rising 20 day EMA. I'd be careful on any confirmed close beneath 10.50. Otherwise, I'd be looking for a return trip to 12.50+.
HLIT:
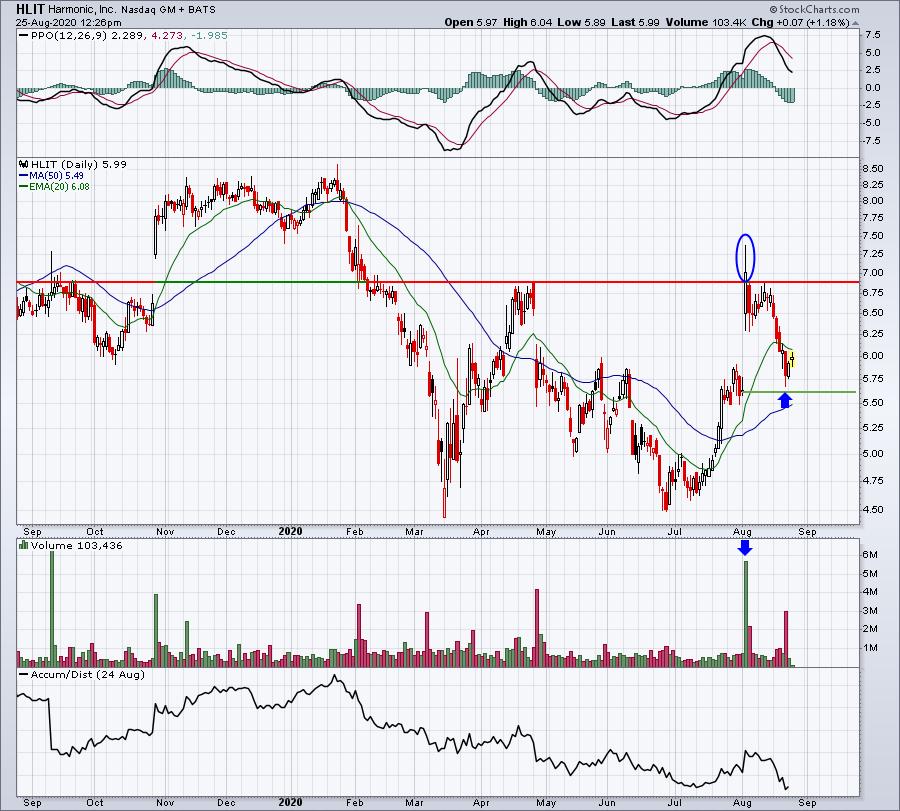
HLIT is more of a mixed picture as its AD line remains very weak. However, I do like the fact that HLIT was able to clear price resistance from late-April, even if only temporarily. Now that it's fallen back to nearly fill its recent gap, I expect it to move higher from here. A close below gap support would be reason for concern. Otherwise, I'd look for higher prices ahead.
Earnings Reports
Here are the key earnings reports for today and tomorrow, featuring stocks with market caps of more than $10 billion. I also include a few select companies with market caps below $10 billion. Finally, any portfolio stocks that will be reporting results are highlighted in BOLD. If you decide to hold a stock into earnings, please understand the significant short-term risk that you are taking. Please be sure to check for earnings dates for any companies you own or are considering owning.
Tuesday, August 25:
CRM, MDT, INTU, ADSK, BMO, BBY, HRL, HEI, SJM, HPE, ATHM, TOL, PSTG, HAIN, URBN
Wednesday, August 26:
RY, SPLK, BILI, NTAP, ESTC, WSM, PLAN, EV, DKS, BOX
Economic Reports
June Case-Shiller house price index: +0.0% (actual) vs. +0.1% (estimate)
June FHFA house price index: +0.9% (actual) vs. +0.3% (estimate)
August consumer confidence: 84.8 (actual) vs. 93.0 (estimate)
June new home sales: 901,000 (actual) vs. 774,000 (estimate)
Happy trading!
Tom