
EB Daily Market Report - Friday, August 28, 2020
Executive Market Summary
- Futures were up again this morning, but sentiment is rearing its ugly head - be careful short-term and read the Market Outlook below
- All our major indices are higher, led by the Dow Jones
- Walmart (WMT, +2.51%) is leading the Dow Jones higher for a 2nd consecutive day
- Many weak pandemic stocks are leading today's advance
- Energy (XLE, +1.23%) and materials (XLB, +0.92%) are the best performing sectors, buoyed by further dollar (UUP) weakness
- Gambling ($DJUSCA, +4.23%) and recreational services ($DJUSRQ, +3.43%) are consumer discretionary leaders today
- Workday (WDAY, +12.63%) is capping off a huge week, soaring after delivering better-than-expected results
Market Outlook
I don't fire out significant warnings about the short-term prospects of the stock market very often, but I'm going to today. I don't know of any warning that guarantees us lower prices ahead, but when the Volatility Index ($VIX) is rising and its correlation with the S&P 500 moves above zero (positive correlation), it typically results in market weakness. In layman's terms, the market is growing more fearful while prices are rising. That suggests that anything negative and "out of the blue" can cause a quick selloff. To visualize how this looks on a chart, check this out:
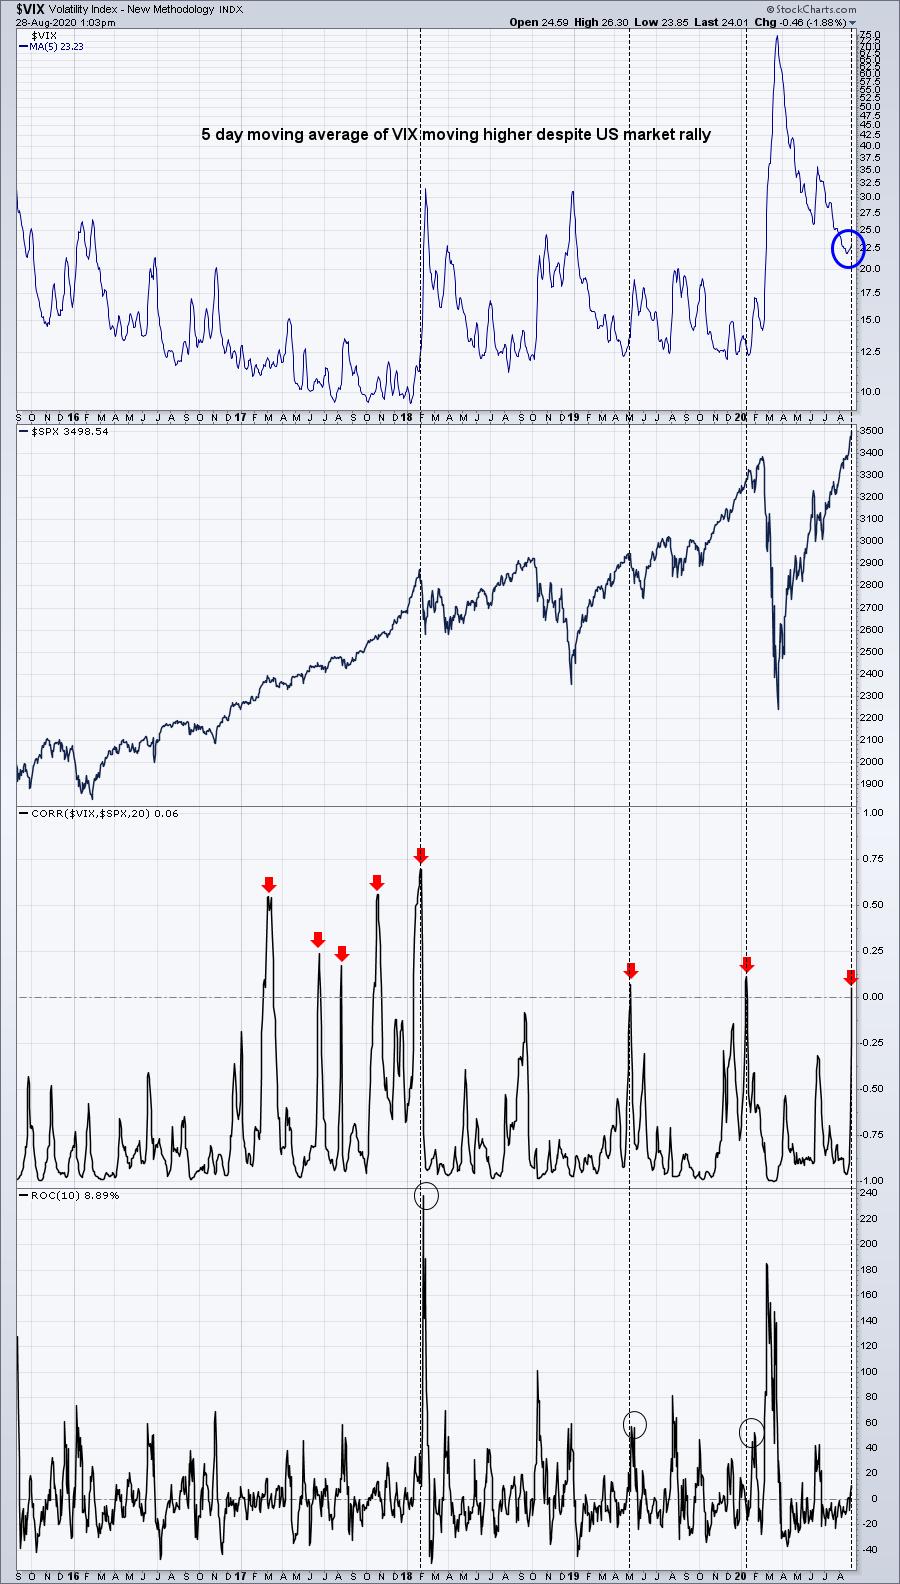
My first takeaway is that the correlation of the VIX and S&P 500 rarely goes above zero. This is just the third time since early 2018. The last two times this occurred, we saw sudden surges in the VIX afterwards, accompanying swift market declines. Let me say that this is NOT a long-term bear market warning. It simply means that the market has run significantly higher and it's getting nervous. I should also point out that these signals generated in 2017 multiple times with little impact. Again, there's no guarantee that we'll see a market decline from here, but to ignore this signal would be foolish, in my view. For those holding long-term, I'd likely stick with my stocks. Selling September covered calls might make sense for some to at least help protect against a portion of the downside risk. Buying put options on the SPX or NDX might also make sense for some for insurance purposes.
Note also that the VIX above is the 5 day moving average of the VIX, not the daily reading. So for a 5 day moving average to turn higher like this tells us that the market is nervous and has remained nervous for an extended period of time.
I'm much more of a short-term trader and I'm building significant amounts of cash. When warnings like these come along, I'd rather miss out on some upside than to hold during downside. That's just my preference, but the decision given these short-term bearish signals is up to each individual.
Sector/Industry Focus
Now let's also review the equity put call ratio ($CPCE), another sentiment indicator. While we worry about the sustainability of a market advance when the VIX rises, the CPCE becomes a problem when it falls as it tells us that the masses are loading up on calls. That can many times be a signal of an impending short-term top. Check out the CPCE chart:
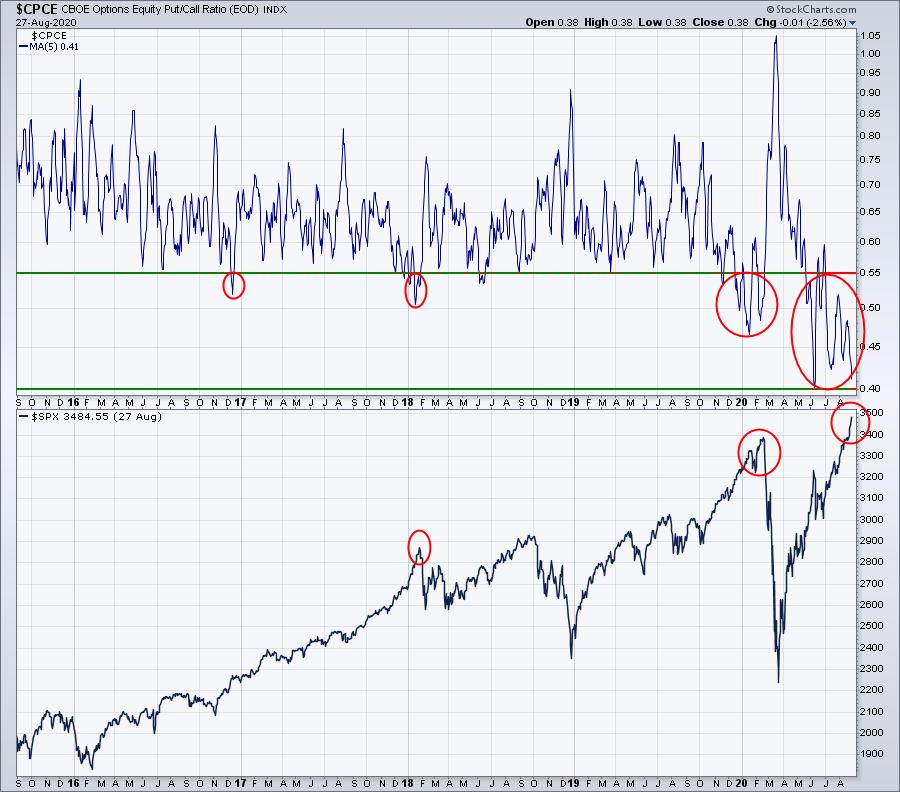
Normally, when the 5 day moving average of the CPCE hits .55, I take notice. That means a lot of call buying is taking place and that can mark short-term market tops. The market grew particularly bullish in late-2019 and early-2020 and we saw the result - of course there was a pandemic that worsened the problem. The current euphoria is even stronger than what we saw earlier this year. That does not, in any way, shape, or form, suggest that I'd like for another crash. But it does tell me that the short-term outlook is growing very cloudy. Storms are on the horizon. Will we ignore these storm clouds, much like we did in late-2016? Or will we succumb as we did in both early-2018 and early-2020?
ChartLists
I'm not providing trade ideas today as I'm concerned about the short-term warning signal being flashed by the VIX and CPCE, but especially the VIX.
I am, however, working on updating the Strong Earnings ChartList (SECL) and Strong Future Earnings ChartList (SFECL). They should both be updated and ready for your review and use over the weekend. I've been looking at the Strong AD and Weak AD ChartLists and I believe that it's time to update those as well. The condition of the AD lines on many stocks within both lists have changed dramatically, so it makes sense to update both as well. That might take place over the weekend, but a safer bet is early next week.
Earnings Reports
Here are the key earnings reports for today and tomorrow, featuring stocks with market caps of more than $10 billion. I also include a few select companies with market caps below $10 billion. Finally, any portfolio stocks that will be reporting results are highlighted in BOLD. If you decide to hold a stock into earnings, please understand the significant short-term risk that you are taking. Please be sure to check for earnings dates for any companies you own or are considering owning.
Friday, August 28:
BIG, HIBB
Monday, August 31:
ZM, CTLT
Economic Reports
July personal income: +0.4% (actual) vs. -0.2% (estimate)
July personal spending: +1.9% (actual) vs. +1.5% (estimate)
August Chicago PMI: 51.2 (actual) vs. 51.8 (estimate)
August consumer sentiment: 74.1 (actual) vs. 72.8 (estimate)
Happy trading!
Tom