
EB Daily Market Report - Thursday, September 3, 2020
Executive Market Summary
- Futures were significantly lower this morning, especially on the tech-laden NASDAQ
- Technology (XLK, -4.22%) is fueling the most significant selling in months as the NASDAQ 100 is down roughly 4% at last check
- Gold ($GOLD, -0.74%) is performing better on a relative basis, but not really offering much relief to those seeking shelter
- Crude oil ($WTIC, -2.36%) is tumbling, but energy (XLE, +0.28%) is the only sector above water
- The 10 year treasury yield ($TNX) is down 2 basis points to 0.63% as many traders are finding relief in the bond market
- The recent leaders - autos ($DJUSAU, -6.12%), renewables ($DWCREE, -5.45%), internet ($DJUSNS, -4.28%), computer hardware ($DJUSCR, -5.30%), software ($DJUSSW, -4.72%) - are taking the biggest hits
- Cruise lines are avoiding the carnage, while many financials (XLF, -0.67%) are being spared
- American Express (AXP, +0.79%) and JP Morgan (JPM, +0.33%) are providing a bit of relief on the Dow Jones
Market Outlook
Well, the warnings have come true in a rather big way today. Instead of rehashing key sentiment indicators that I've discussed in recent days, if you'd like to read my latest thoughts on the topic, I published an article this morning in my Trading Places blog, "2 Sentiment Indicators Are Suggesting Extreme Caution - BEWARE!".
Sector/Industry Focus
Technology (XLK), one of the undisputed leaders of 2020 and throughout the pandemic, is taking a big hit today. But we need to keep things in perspective. When stocks or sectors rise without meaningful pullbacks, this is the type of panicked selling that can result. It's exactly what I've been warning about. Everyone, and I mean EVERYONE, had turned incredibly bullish, yet fear was growing. That can be a lethal combination and it's proving to be just that today. We need time to pause, consolidate, and base and this is likely the beginning of that. Here's the XLK and what we might consider as key support as we move forward throughout September:
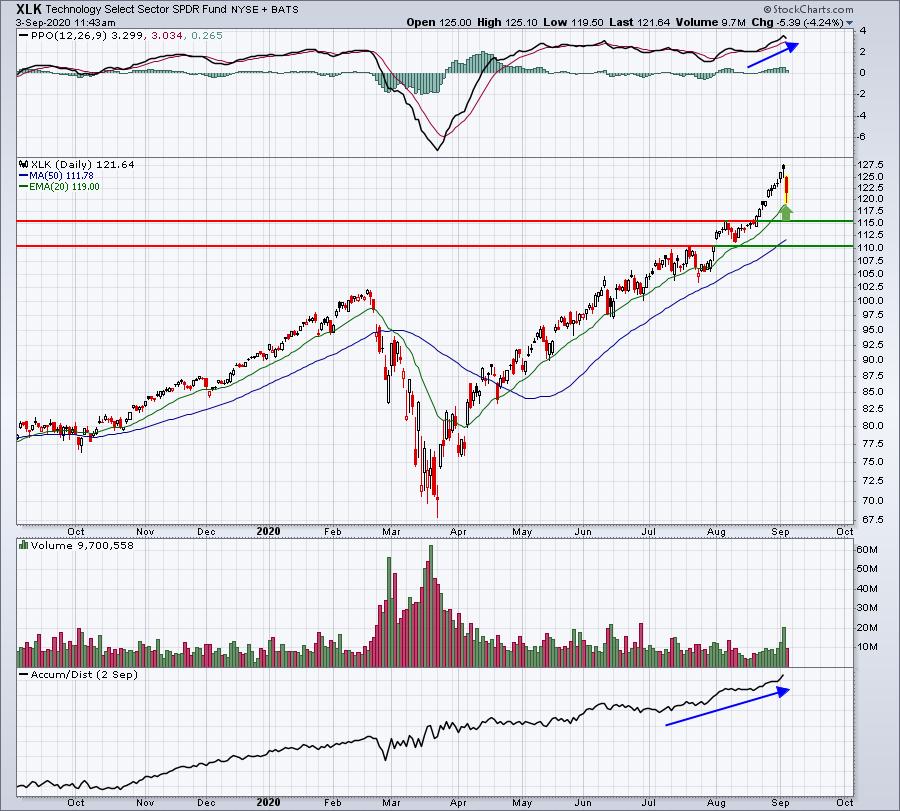
Best case scenario is that this selling is very short-lived and the near test of the rising 20 day EMA was the extent of the selling. The PPO and AD line would support this line of thinking, but that really wouldn't be much of a base. If the 20 day EMA is lost - today or in future days/weeks - then I'd look to the two key price support levels that I've provided. Technology is definitely a market leader and when the selling ends, we'll likely see Wall Street pour right back into this area.
ChartLists
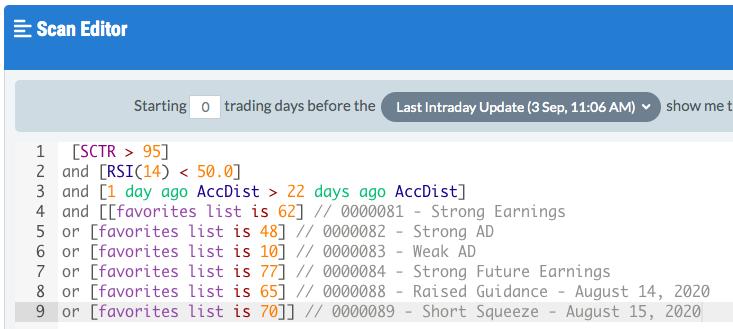
I scanned all of our ChartLists, searching for stocks that met the following criteria:
- SCTRs > 95
- RSIs < 50
- 1 day ago AD line > 22 days ago AD line
(Helpful hint: You cannot run a scan with an AD line for today as the scan engine doesn't recognize an AD line for today until AFTER the close. That's why I use "1 day ago")
Here's what the scan syntax looks like:
....and here were the 8 results:
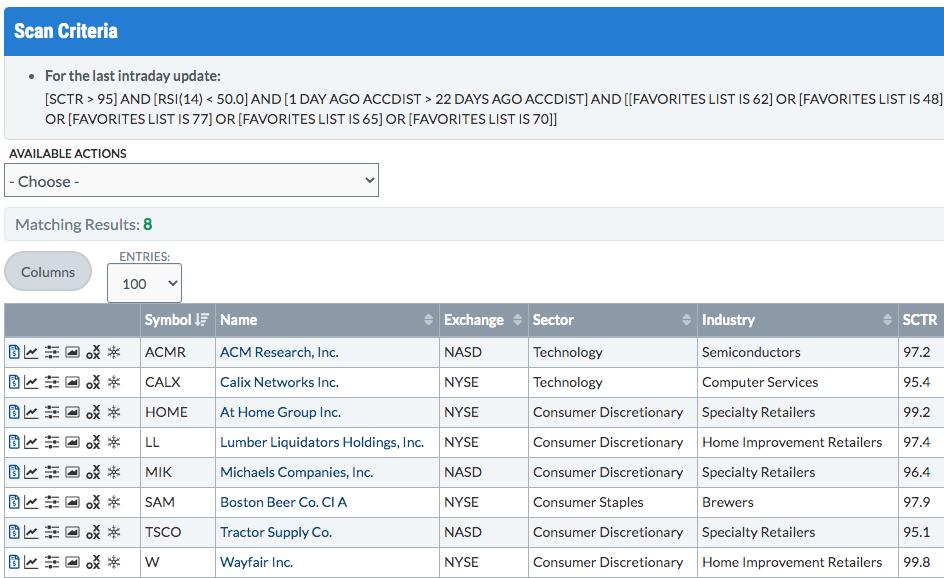
The obvious question is.....when will the selling end and should I enter now? Well, the market has been irrational to the upside, with nary a pullback in the past few months. It tends to be even more irrational when selling begins. If there are stocks that you've wanted to enter, but have waited for a selling episode, here's your selling episode. How deep will it go? It's difficult to say. I'd simply look at charts, pick out a few key support areas and begin to build positions as the market sells. For instance, I'll look at two of the above stocks returned from the scan:
W:
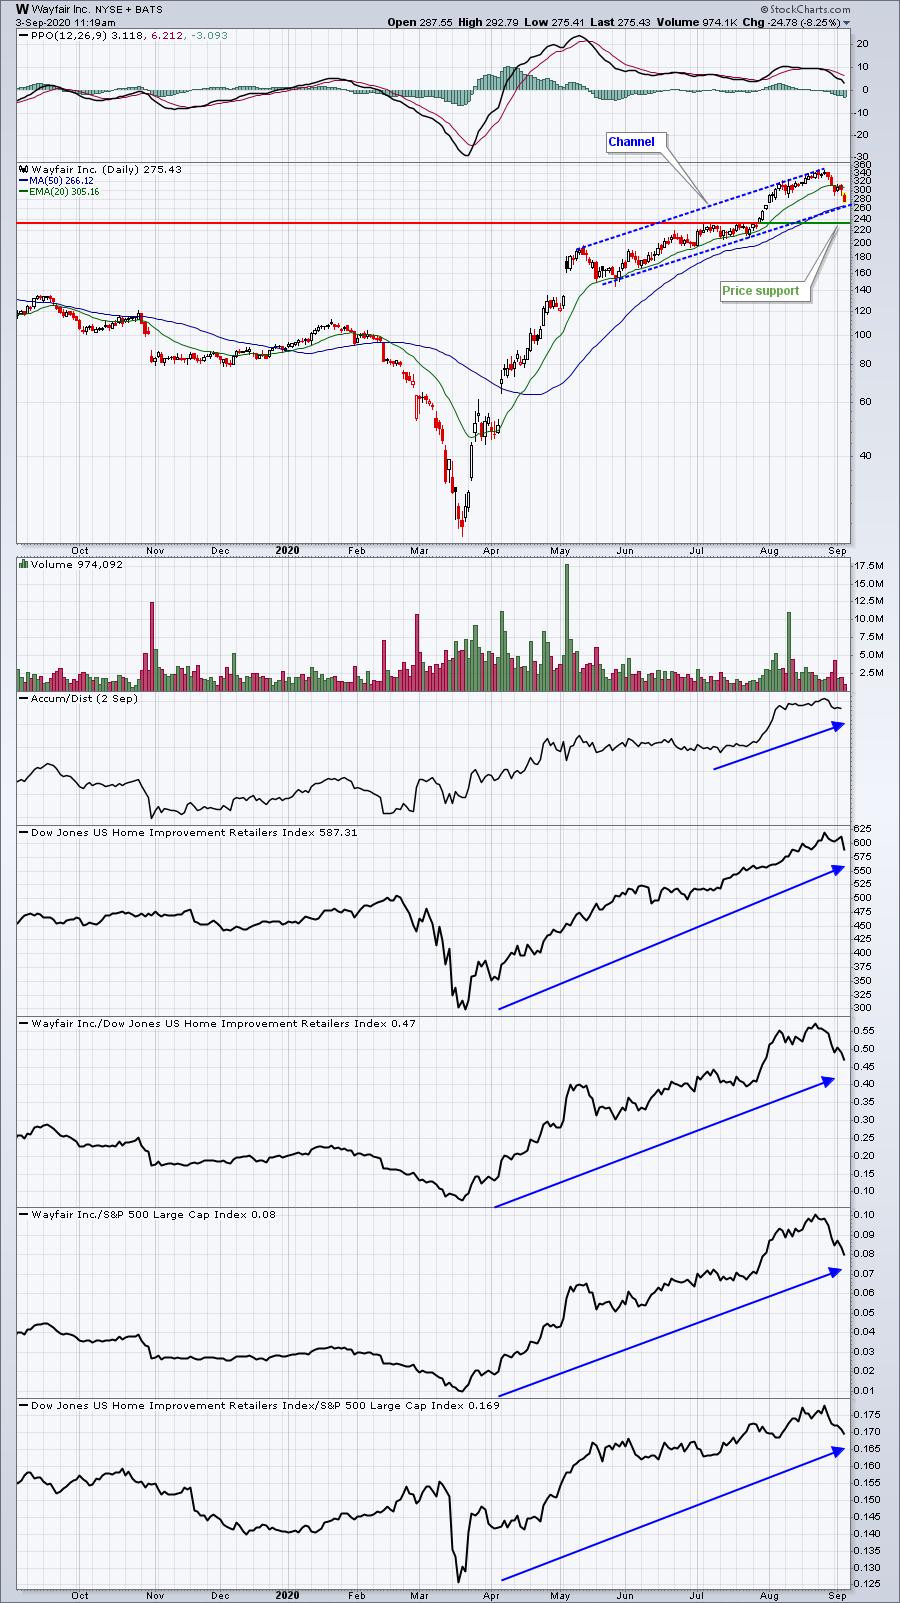
W has several potential entry points - from its current price all the way down to price support near 235. Channel support is very close to its 50 day SMA, so that's a level I'd certainly be interested.
HOME:
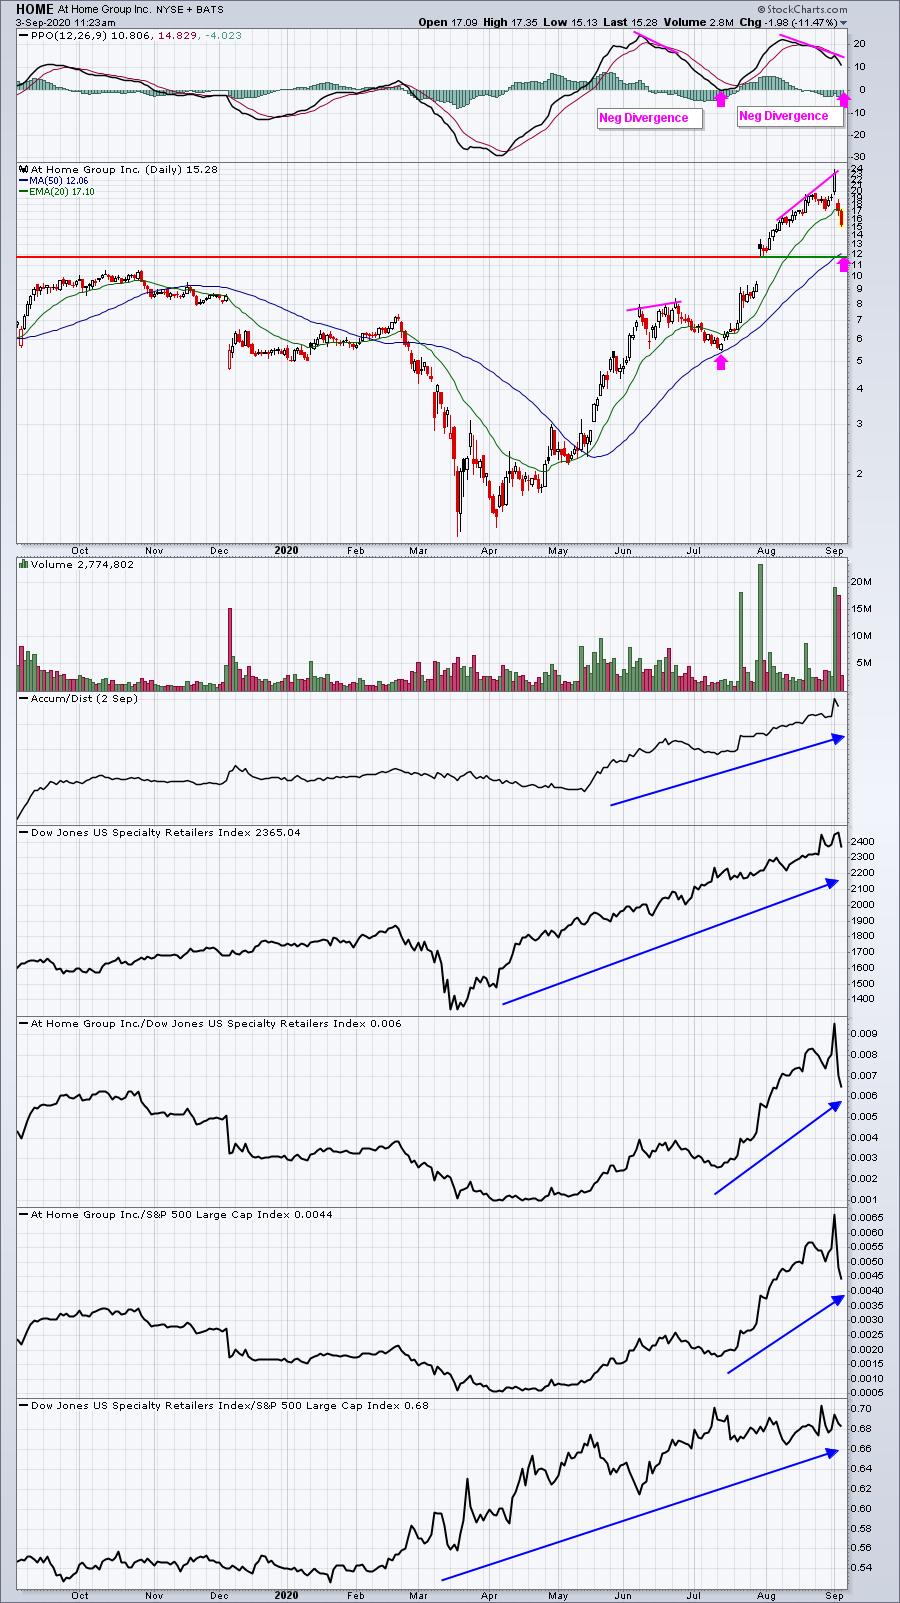
Like W, HOME has a very strong AD line, which makes me feel somewhat better about the recent selling. Note the negative divergences that have appeared on the HOME chart. The last time one appeared, HOME fell back to test its 50 day SMA and also saw a PPO centerline test. These are exactly the tests I look for after a negative divergence prints. The 50 day SMA currently resides very close to major gap support. HOME looks interesting to me the further it drops as the reward to risk continues to improve.
Earnings Reports
Here are the key earnings reports for today and tomorrow, featuring stocks with market caps of more than $10 billion. I also include a few select companies with market caps below $10 billion. Finally, any portfolio stocks that will be reporting results are highlighted in BOLD. If you decide to hold a stock into earnings, please understand the significant short-term risk that you are taking. Please be sure to check for earnings dates for any companies you own or are considering owning.
Thursday, September 3:
AVGO, DOCU, COO, CPB, TTC, DCI, MDLA, MOMO, PDCO, YEXT, KFY, MIK, DOMO, SIG
Friday, September 4:
None
Economic Reports
Initial jobless claims: 881,000 (actual) vs. 958,000 (estimate)
Q2 productivity - 2nd estimate: +10.1% (actual) vs. +7.4% (estimate)
August ISM services index: 56.9 (actual) vs. 57.0 (estimate)
Happy trading!
Tom